
- Long-term Bitcoin holders exhibited confidence, selling less despite market fluctuations and nearing all-time highs.
- Bitcoin’s strong support at $63,440-$65,470 and growing liquidity suggested potential for upward momentum.
CryptoQuant Founder & CEO Ki Young Ju recently commented on the behavior of Bitcoin [BTC] investors.
He stated that those who held Bitcoin for six months to two years have now largely sold their holdings as the crypto neared its previous all-time high.
The founder noted,
“If you’re selling Bitcoin now, you likely haven’t held it for over 3 years, as veteran holders aren’t selling.”
This behavior suggested that long-term investors have maintained their confidence in Bitcoin’s long-term value.
CrypNuevo also discussed Bitcoin’s future trajectory, pointing out that liquidity at the $68.9k level was steadily increasing.
According to CrypNuevo, it seems inevitable that Bitcoin will reach this level, although it remains uncertain whether there will be a dip before reaching it or if the price will continue to rise directly.
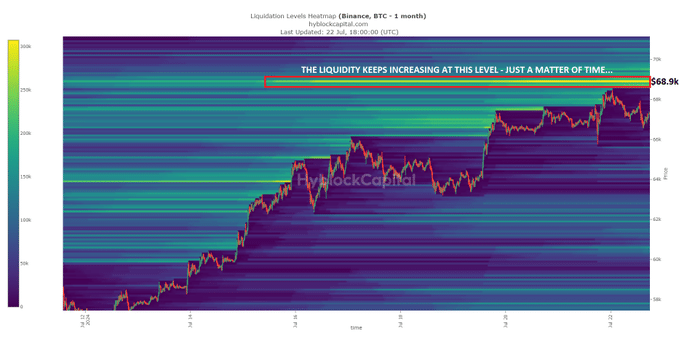
Source: X
According to analyst Ali Martinez, Bitcoin is currently.
“Breaking through multiple trend lines in the hourly chart.”
He also identified a crucial support level for Bitcoin between $63,440 and $65,470, where 1.89 million addresses acquired 1.23 million BTC.
This support zone is vital as it suggests a strong buying interest at these levels, which could help stabilize the price during any potential dips.
Current market conditions
As of press time, Bitcoin was priced at $66,680.44, with a 24-hour trading volume of $43,180,179,849. Bitcoin’s price has dropped by 0.85% in the last 24 hours.
The 9-day simple moving average (SMA) was at 6599, indicating that the recent price was slightly above this level, suggesting a short-term bullish trend.
The Moving Average Convergence Divergence (MACD) indicator showed a bullish crossover, with the MACD line crossing above the signal line earlier in July.
This bullish signal was supported by increasing green histogram bars, suggesting growing momentum.
However, caution is advised as the MACD approaches the overbought region, which may indicate a potential reversal or correction.
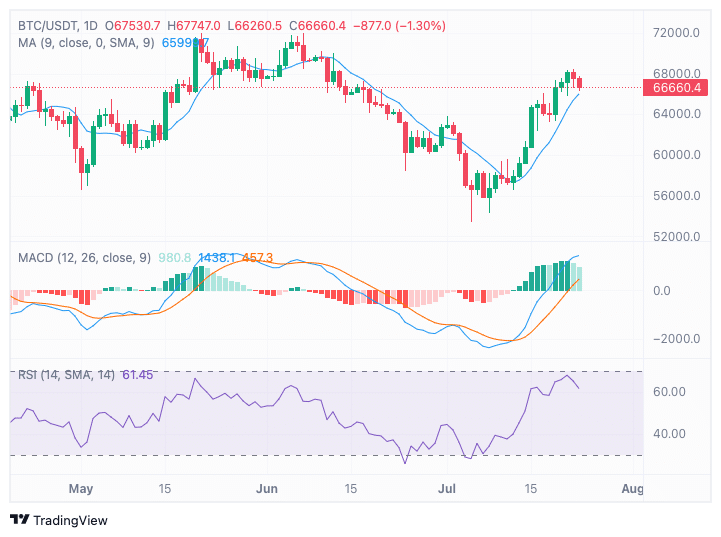
Source: TradingView
At the time of writing, the Relative Strength Index (RSI) was 61.45, suggesting the market is in bullish territory but not yet overbought.
The RSI has been rising from oversold levels seen in late June, reflecting strengthening upward momentum.
Despite the bullish sentiment, the RSI nearing the 70 level could signal emerging overbought conditions, warranting vigilance for potential bearish divergence or trend reversal.
On-chain activity
On-chain data revealed that active addresses have fluctuated, peaking significantly in late February and early April, but generally declining towards July, with the latest count at 766K.
Source: Santiment
Read Bitcoin’s [BTC] Price Prediction 2024-25
Transaction counts have mirrored this trend, with notable spikes in activity during the same periods and the latest transaction count at 185K.
This decline in on-chain activity suggested reduced engagement and transaction volume in recent months, aligning with the overall market trends.