Bitcoin
Bitcoin dips below $65K – Why a rebound to $91K could be next
Bitcoin’s price plummeted under the $65k mark, but the increase in FUD around it might result in a trend reversal.


- Bitcoin’s value dropped by more than 4% in the last seven days.
- Market indicators continued to remain bearish on BTC.
Bitcoin’s [BTC] performance over the last seven days was underwhelming, as its price dropped below the $65k mark. The price corrections sparked fear among investors. However, the trend might end soon as historical trends hint at a possible market bottom.
Bitcoin hits a market bottom
CoinMarketCap’s data revealed that BTC was down by nearly 4.5% in the last seven days. In fact, in the last 24 hours alone, the king of cryptos’ price dropped by over 2%.
At the time of writing, Bitcoin was trading at $63,931.44 with a market capitalization of over $1.26 trillion.
Meanwhile, Santiment recently posted a tweet highlighting an interesting development. As per the tweet, the market was mainly fearful or disinterested in Bitcoin, as prices ranged from $65K to $66K.
The tweet mentioned, “This extended level of FUD is rare as traders continue to capitulate. BTC trader fatigue, combined with whale accumulation, generally leads to bounces that reward the patient.”
To see whether Bitcoin was actually near its market bottom, AMBCrypto analyzed Glassnode’s data.
The Pi Cycle Top indicator pointed out that BTC’s price had dropped from its perceived market bottom of $66.5k. This clearly hinted at a price increase in the coming days.
For starters, the Pi Cycle indicator is composed of the 111-day moving average and a 2x multiple of the 350-day moving average of Bitcoin’s price.
Going forward, if things turn bullish, then BTC might as well reach its market top of $91k in the coming weeks or months.
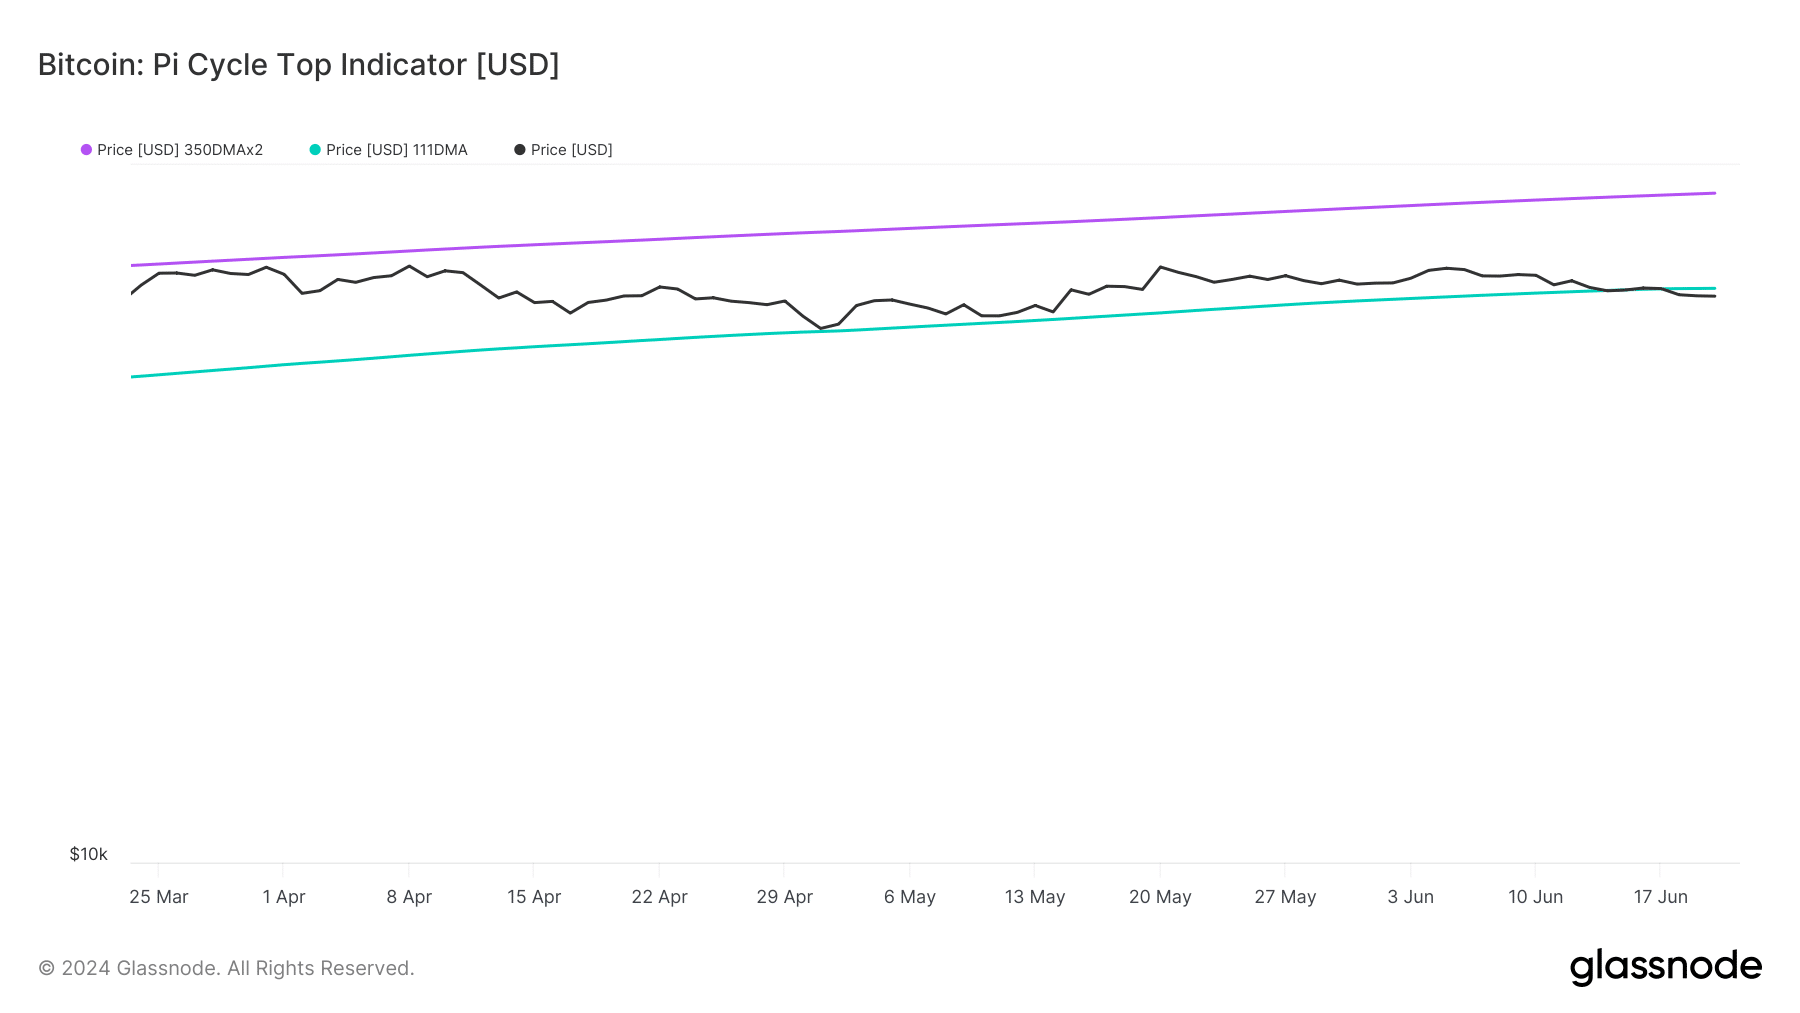
Source: Glassnode
Looking ahead
Like the aforementioned data, a few other metrics also looked bullish. For example, at press time, BTC’s
fear and greed index had a value of 37%, meaning that the market was in a “fear” phase.Whenever the metric hits this level, it indicates that the chances of a bull rally are high.
However, AMBCrypto’s look at CryptoQuant’s data revealed a few bearish metrics. For instance, BTC’s exchange reserve was increasing.
Its net deposit on exchanges was high compared to the last seven days’ average, meaning that selling pressure on Bitcoin was high.
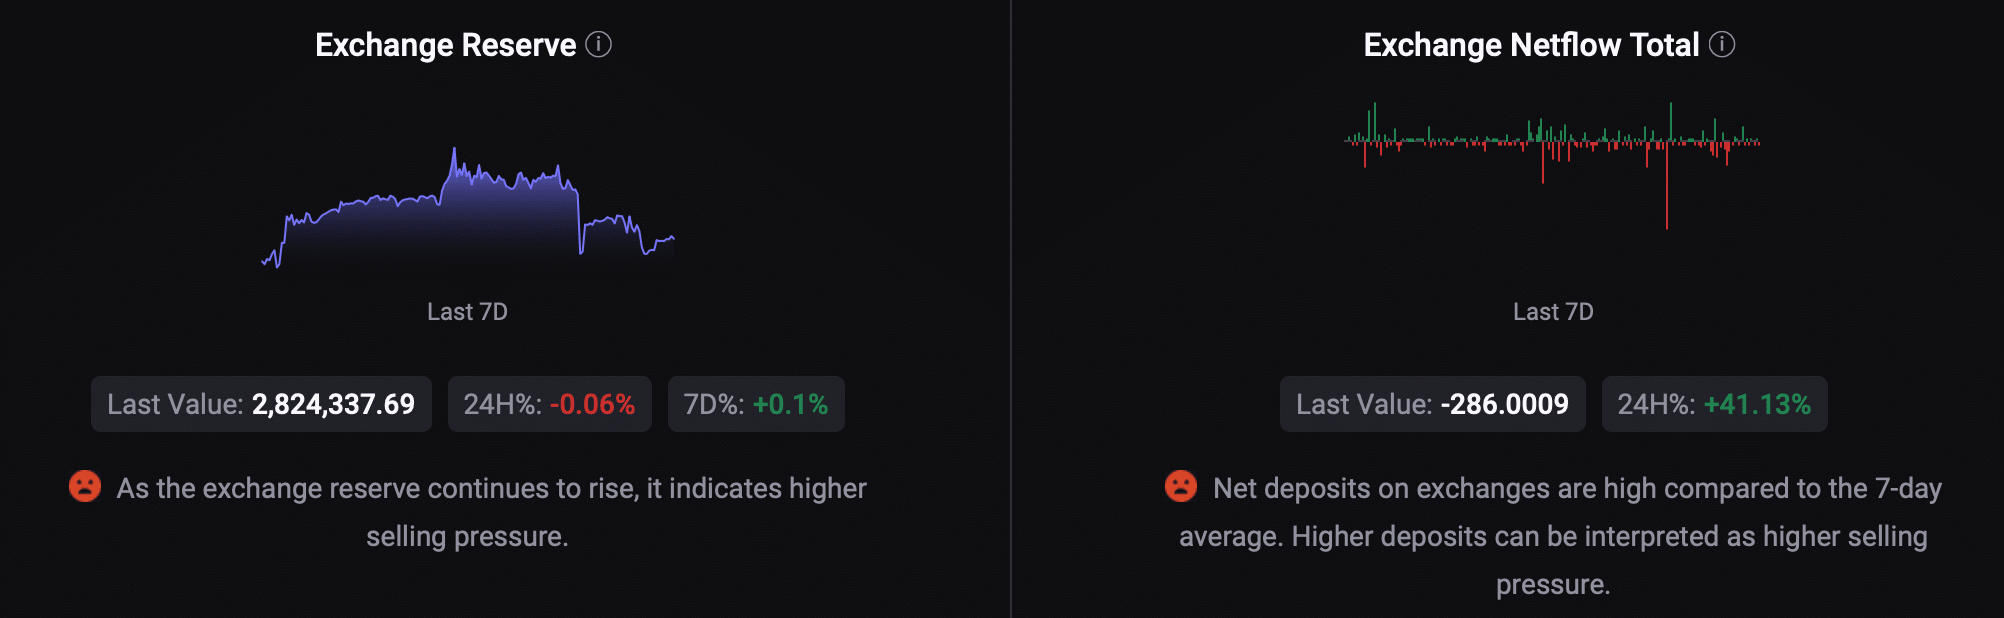
Source: CryptoQuant
Read Bitcoin’s [BTC] Price Prediction
2024-25We then planned to have a look at BTC’s daily chart to better understand whether bulls were preparing for a rally. We found that most of the indicators were bearish.
The MACD displayed a clear bearish upperhand in the market. The Relative Strength Index (RSI) registered a downtick. BTC’s Chaikin Money Flow (CMF) also followed a similar declining trend, hinting at a continued price drop.
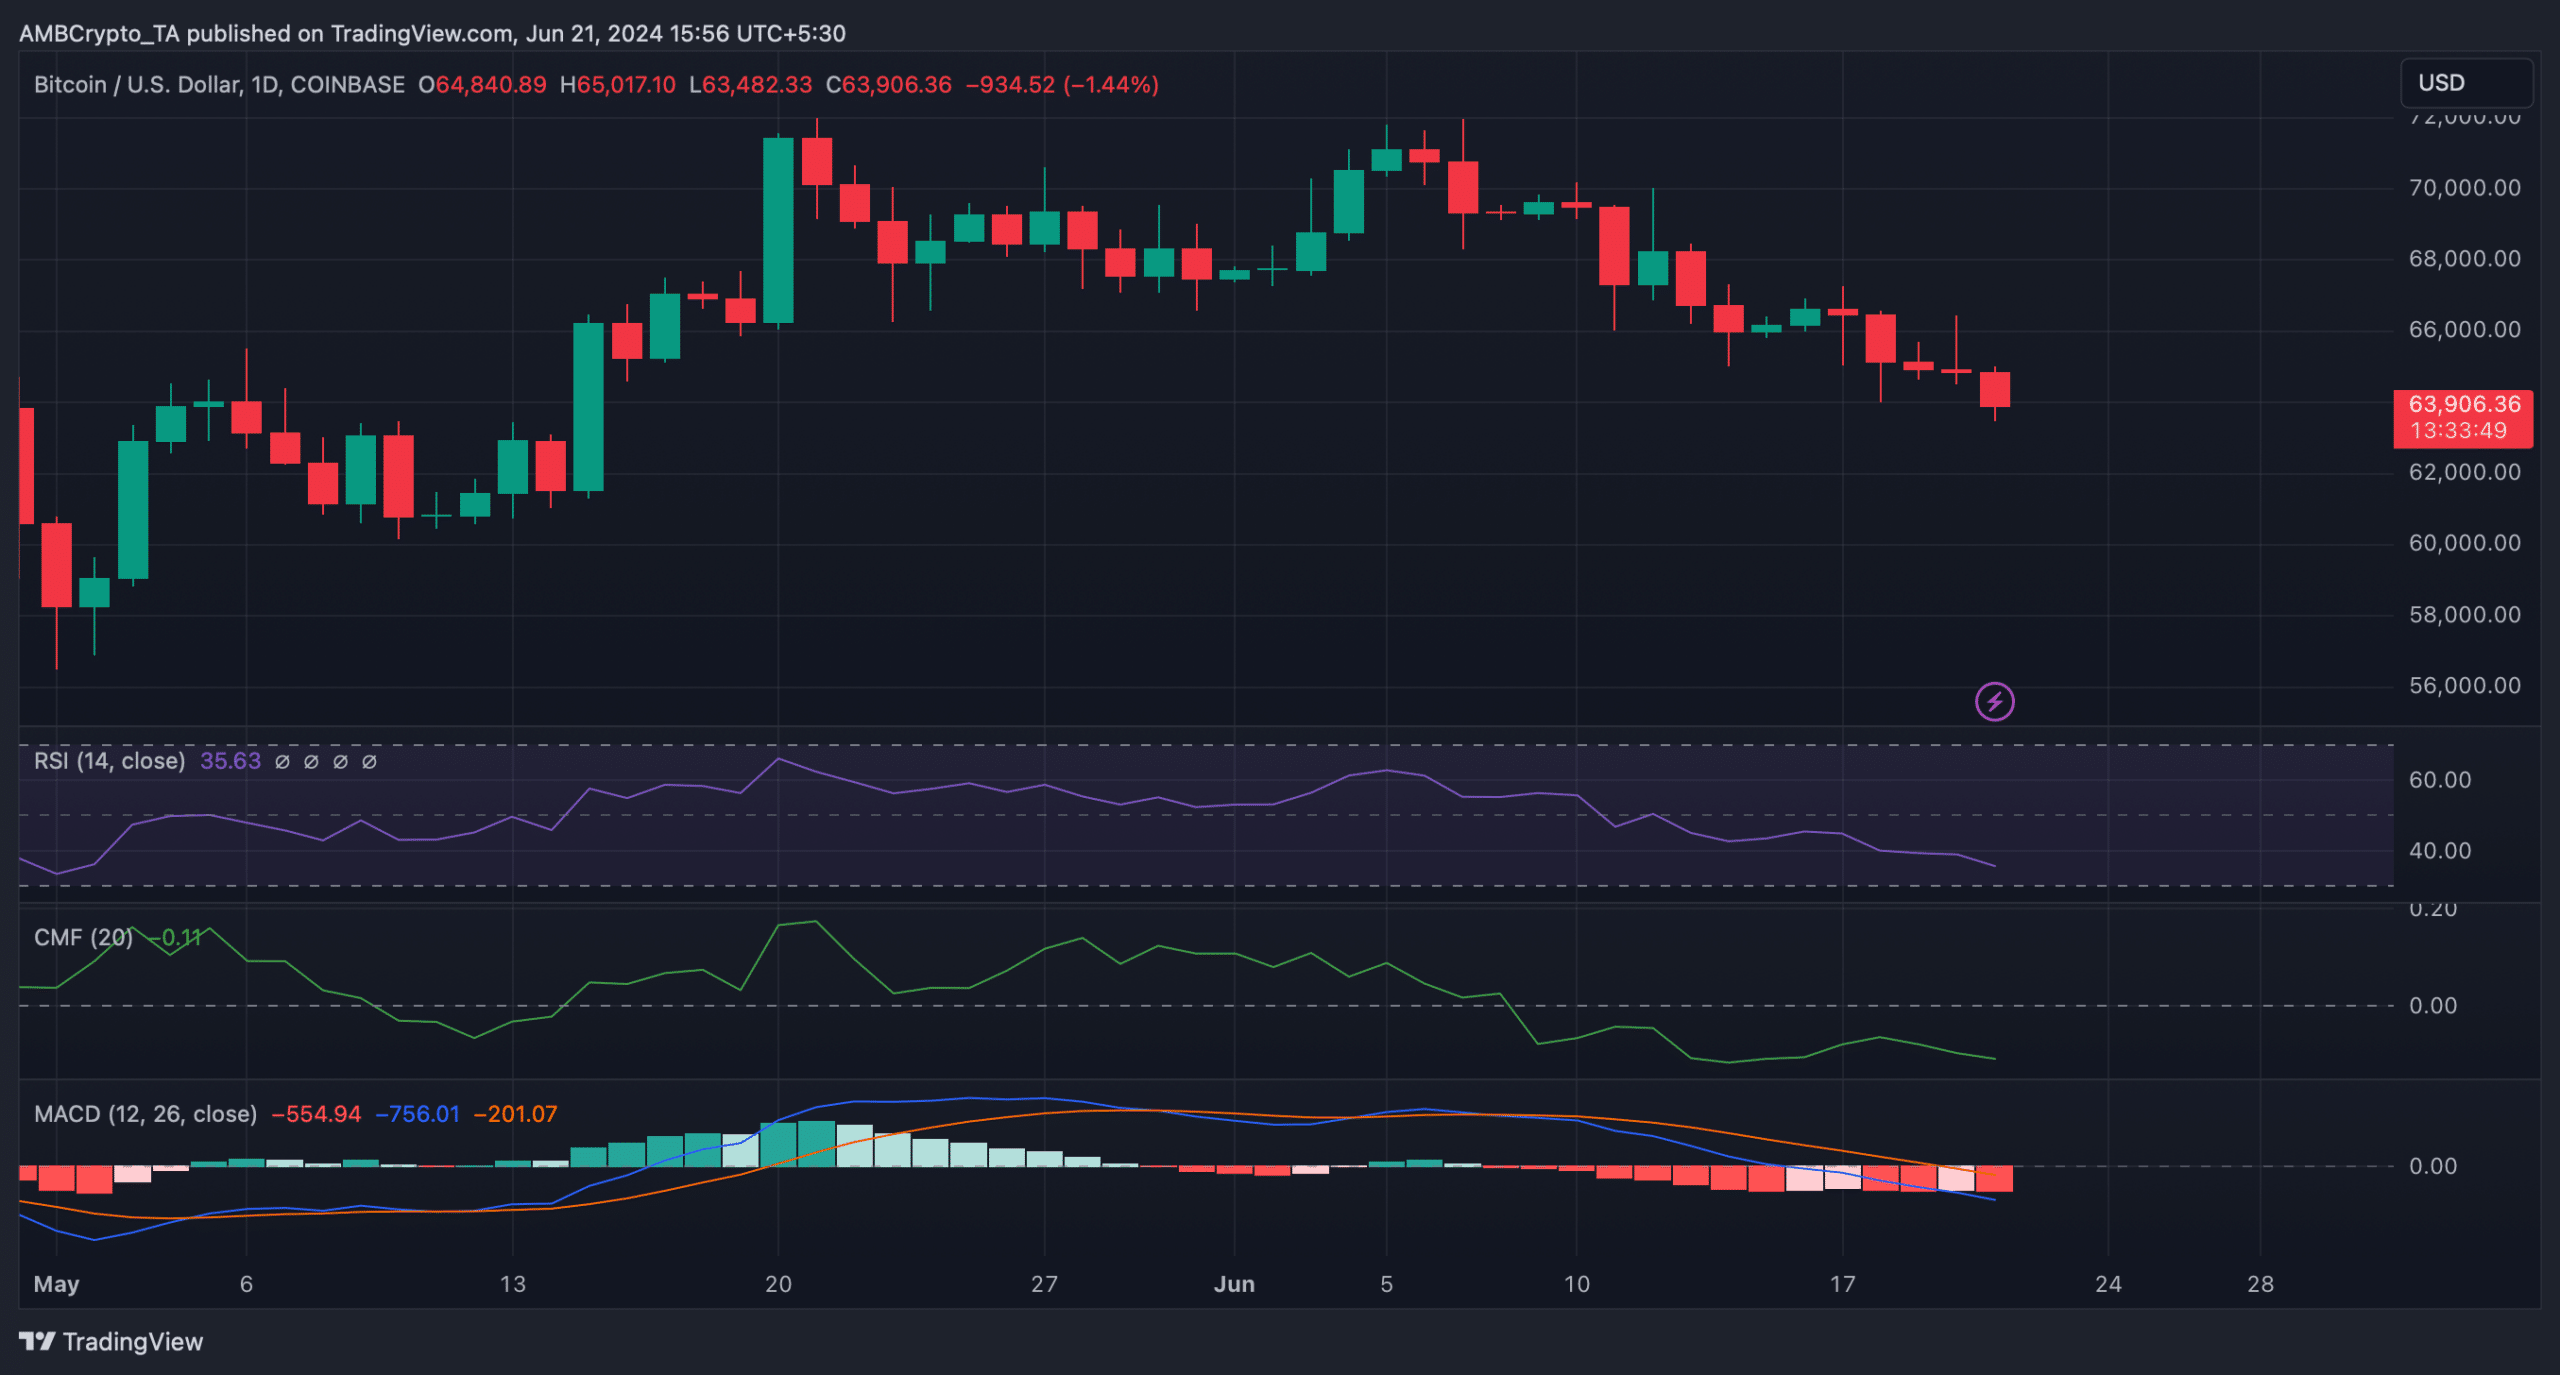
Source: TradingView