Bitcoin, Dogecoin, UNI Price Analysis: 06 July

The cumulative crypto-market cap rose as high as $1.46T on the back of a 2.08% hike over the last 24 hours. While yesterday’s BTC price dip had a bad influence on the overall market, the market had since stabilized.
Similar to Bitcoin, DOGE too seemed to consolidate its holdings as it tried to enter the bullish territory after a period of sideways movement. UNI, however, registered an exceptional uptick over the past week, with an over 25% jump in price and dominant bullish sentiment.
Bitcoin [BTC]

After falling by 7% yesterday, Bitcoin’s price rose by 2.1% later. At press time, it was trading in the green at $34,796 after recovering from a drop below the crucial $34,000-mark. However, it has continued to oscillate between the $32,377-support and $36,545-resistance levels since 18 June.
The Bollinger Bands were slightly converged on the 4-hour chart. Ergo, sharp price movement cannot be expected due to low market volatility. Although the MACD witnessed a bearish crossover yesterday, the indicator and signal line seemed to be heading for another crossover as the lines were in convergence and bearish momentum on the histogram was low.
Buying pressure also plunged yesterday. However, pushback from the bulls led to the Relative Strength Index (RSI) moving up above the median line as selling pressure was subverted.
Dogecoin [DOGE]
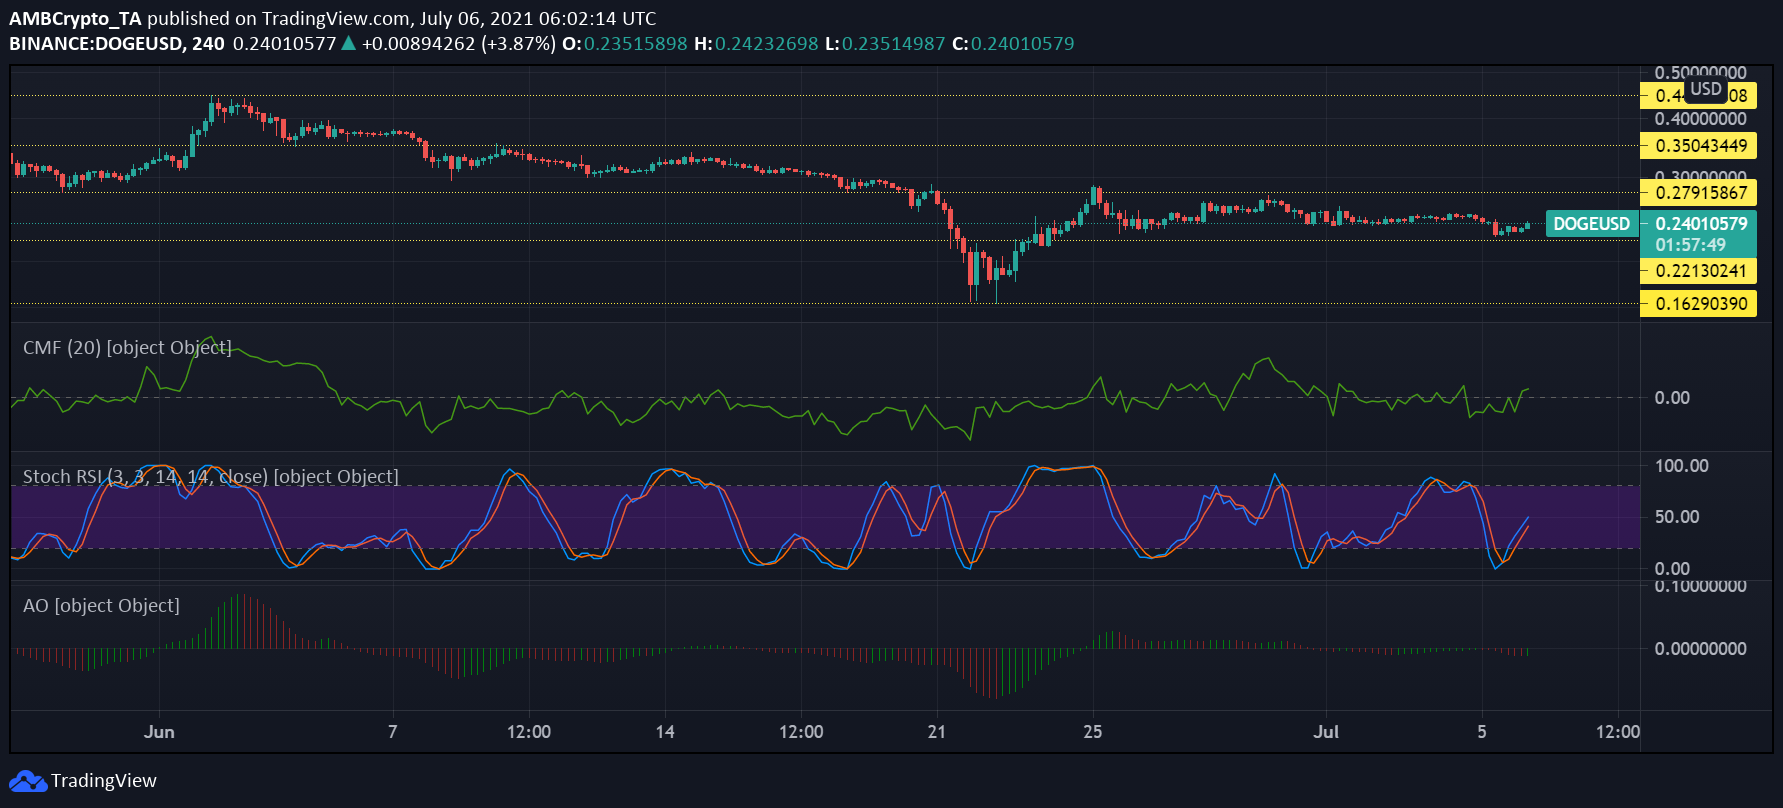
Dogecoin’s 7-day price change was negative 6% while it gained 0.6% of its price over the last 24 hours. Moreover, it lost over 35% of its valuation over the preceding month. The meme-coin has moved sideways with short candlesticks since the consolidation on 25 June as price action remained low. No attempted breakthroughs from the $0.27-resistance and $0.22-support marks were noted during this time.
Capital inflows into DOGE’s market increased yesterday as the Chaikin Money Flow moved above the equilibrium zone. However, it remained in neutral bullish territory. The Stochastic RSI exited the oversold region at the same time after registering a bullish crossover. The lines remained below the median line at press time, heading for the bullish zone.
Momentum for the asset remained low, as highlighted by the small bars on the Awesome Oscillator due to an extended contraction of the price range. Bearish momentum on the histogram could be seen declining with the emergence of a green bar.
Uniswap [UNI]
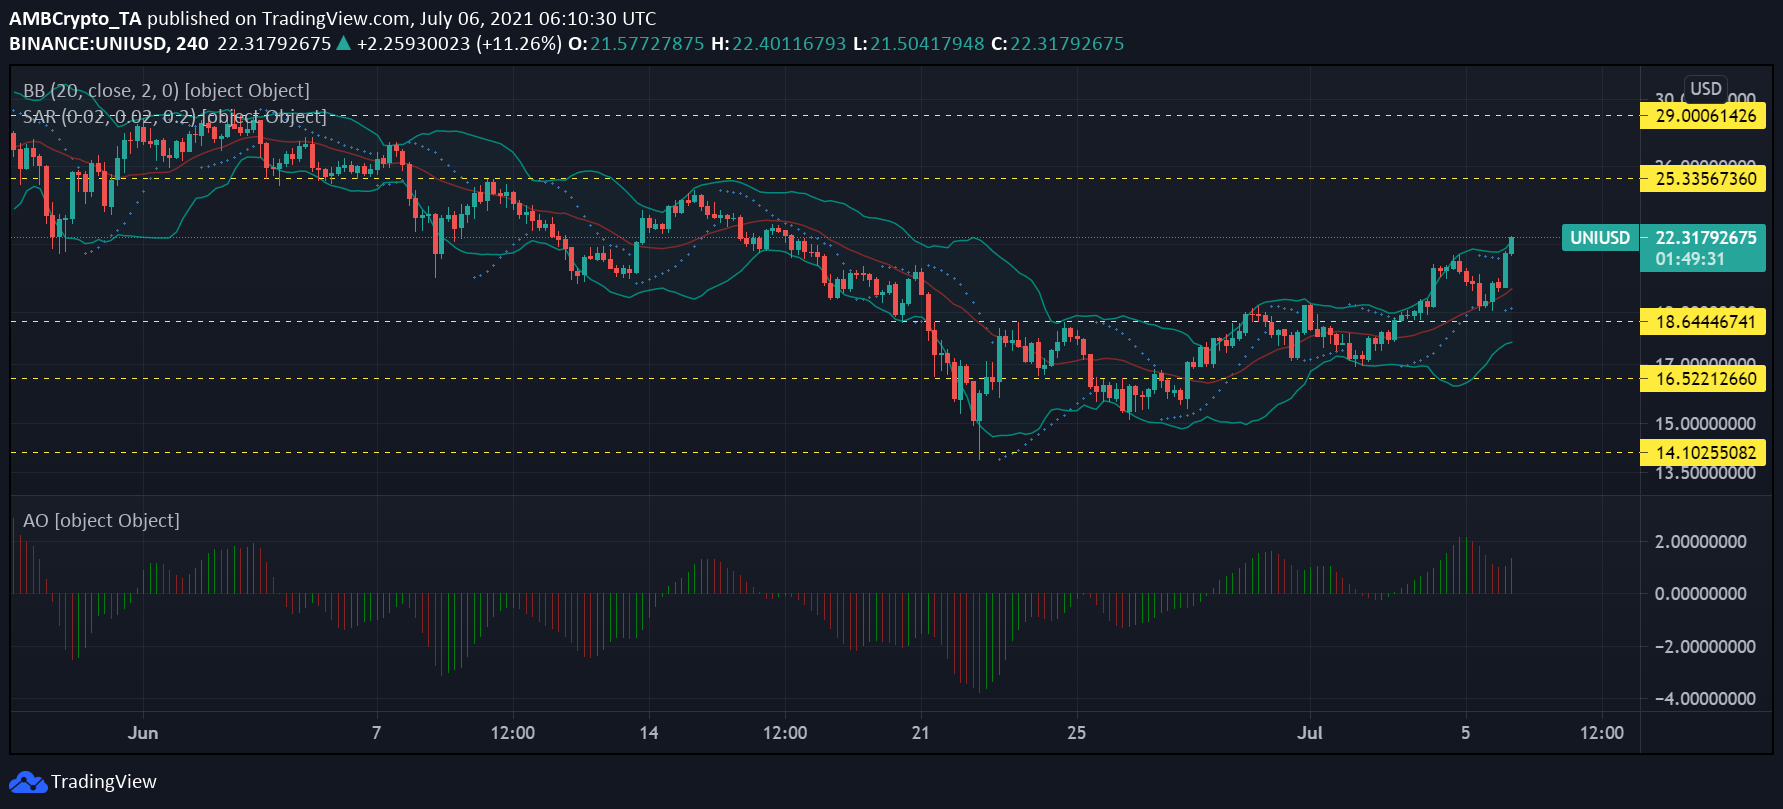
UNI broke through the $18.6 resistance on 3 July and remained suspended above it as support. The coin managed to surge by 25.4% in just one week, with a 9% spike in 24 hours. Its trading volume also increased by 14% during this time.
The divergence of the Bollinger Bands suggested that the DeFi token experienced sharp price action as the market continued to remain volatile. The asset was mostly under a bullish influence over the week, even as the Parabolic SAR’s dotted line formed above the candlesticks during yesterday’s market correction. It was oscillating below it once again as the price movement followed a bullish trend.
The formation of long green bars above the Awesome Oscillator’s histogram pictured the emergence of dominant bullish momentum on the coin’s price chart. In the event of a sustained price surge, the asset could find resistance around the $25-mark.


