
- Bitcoin dominance fell under the support of an ascending triangle pattern.
- BTC’s price successfully tested a crucial support level in the last few days.
Bitcoin [BTC] has been facing setbacks for several days as it continued to struggle well under $60k. Meanwhile, its dominance also fell, which hinted at a rise in altcoins’ presence. But there was more to the story.
Bitcoin dominance looks concerning
AMBCrypto’s analysis of CoinStats’ data revealed that the Bitcoin dominance has been on a declining trend over the last seven days. At press time, the indicator had a value of 53%.
In fact, Sensei, a popular crypto analyst, posted a tweet highlighting a major development. As per the tweet, BTC dominance fell under a crucial support level of a rising triangle pattern, suggesting that BTC’s price might fall further in the coming days.

Source: X
Simultaneously, another prominent BTC indicator registered a massive decline. Axel, a famous crypto analyst, recently posted on X that Bitcoin’s Relative Strength Index (RSI) was dropping.
As per the tweet, the RSI has dropped to its lowest level since July of this year. For starters, a drop under 30% means that an asset is heavily oversold.
Though at first this looked bearish, a look back in the past revealed something bullish. A similar decline was seen in 2023. When BTC’s RSI dropped sharply last year, it indicated a market bottom.
This was the case as soon after the RSI dropped, BTC’s price gained upward momentum, which resulted in the last bull rally.

Source: X
Is BTC’s market bottom here?
AMBCrypto’s analysis of Glassnode’s data revealed that BTC’s price was already well below its market bottom. As per the Pi Cycle Top indicator, BTC’s possible market bottom was at $63k.
CoinMarketCap’s data revealed that at the time of writing, BTC was trading at $54,706.58 with a market capitalization of over $1.08 trillion.
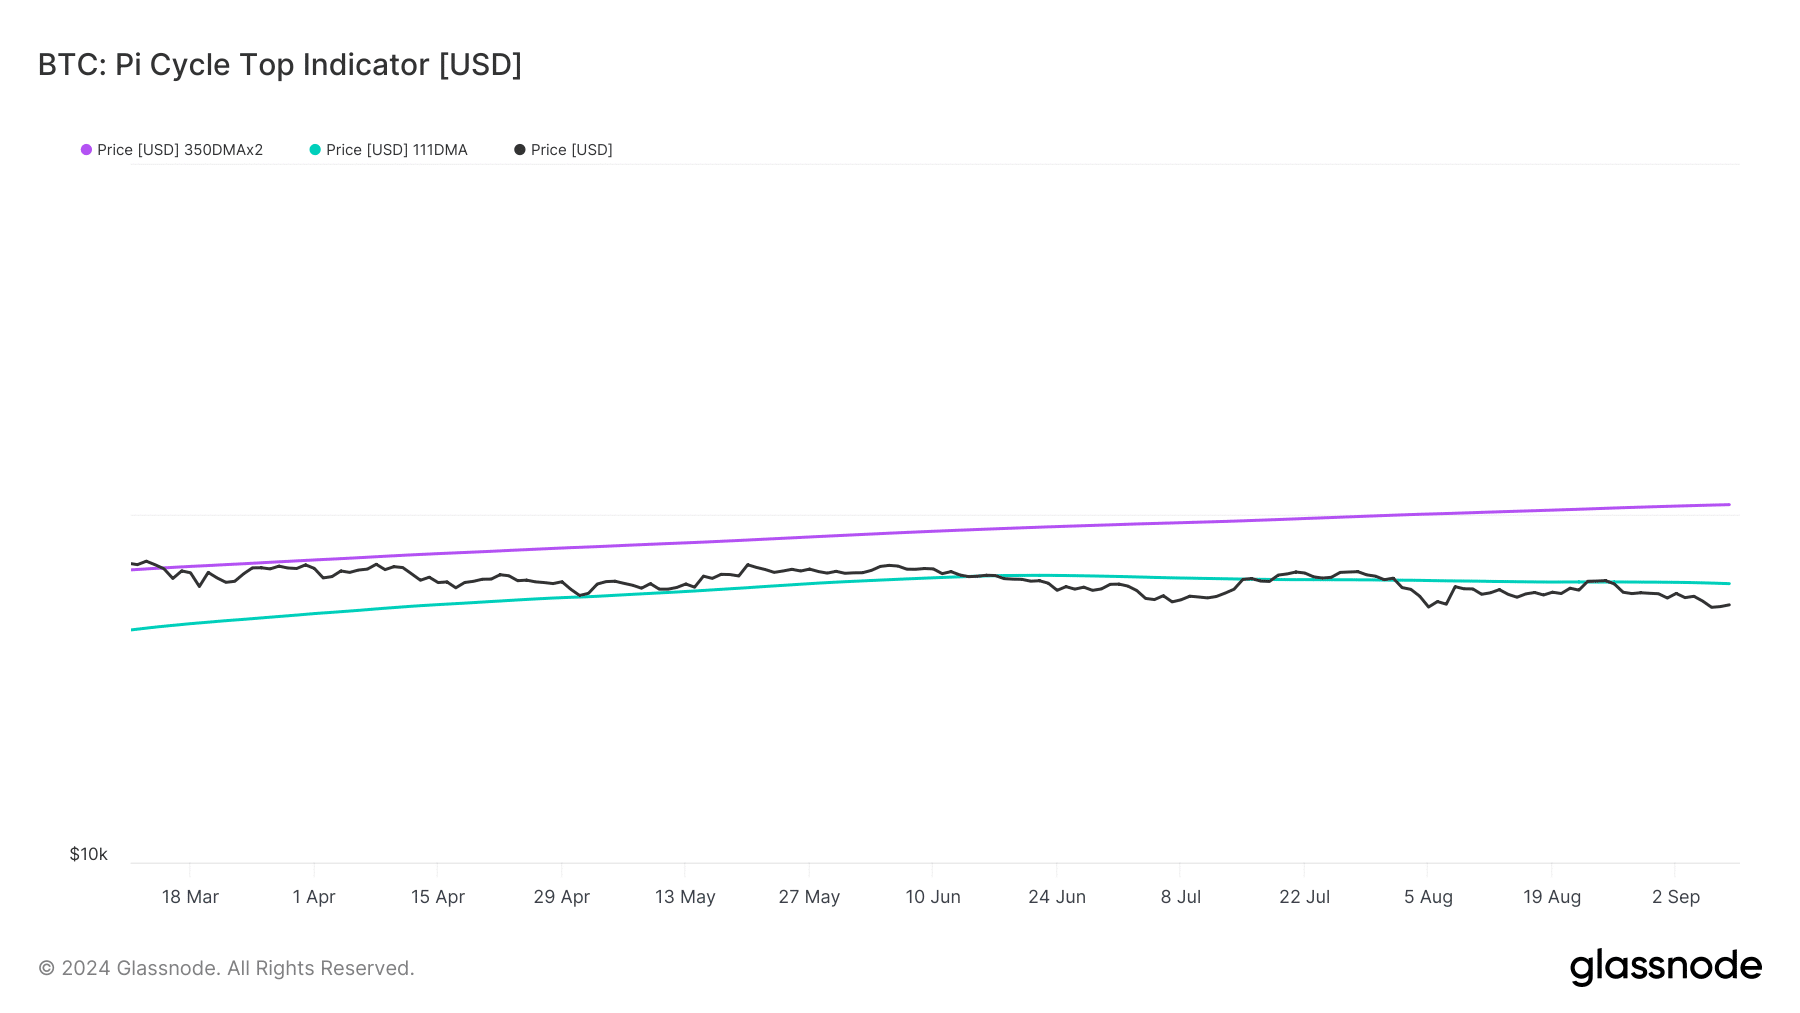
Source: Glassnode
The good news was that after a week where BTC witnessed a nearly 5% price correction, the last 24 hours were in investors favor. This was the case as the king coin managed to push its price up marginally.
If the aforementioned datasets were true and the Pi Cycle Top indicator is to be believed, then the chances of BTC’s price falling further were low.
Read Bitcoin’s [BTC] Price Prediction 2024–2025
Therefore, AMBCrypto took a look at BTC’s daily chart to better understand what to expect from it. We found that BTC had successfully tested its support at $54k.
The Chaikin Money Flow (CMF) registered an uptick, suggesting that BTC might begin a recovery journey.
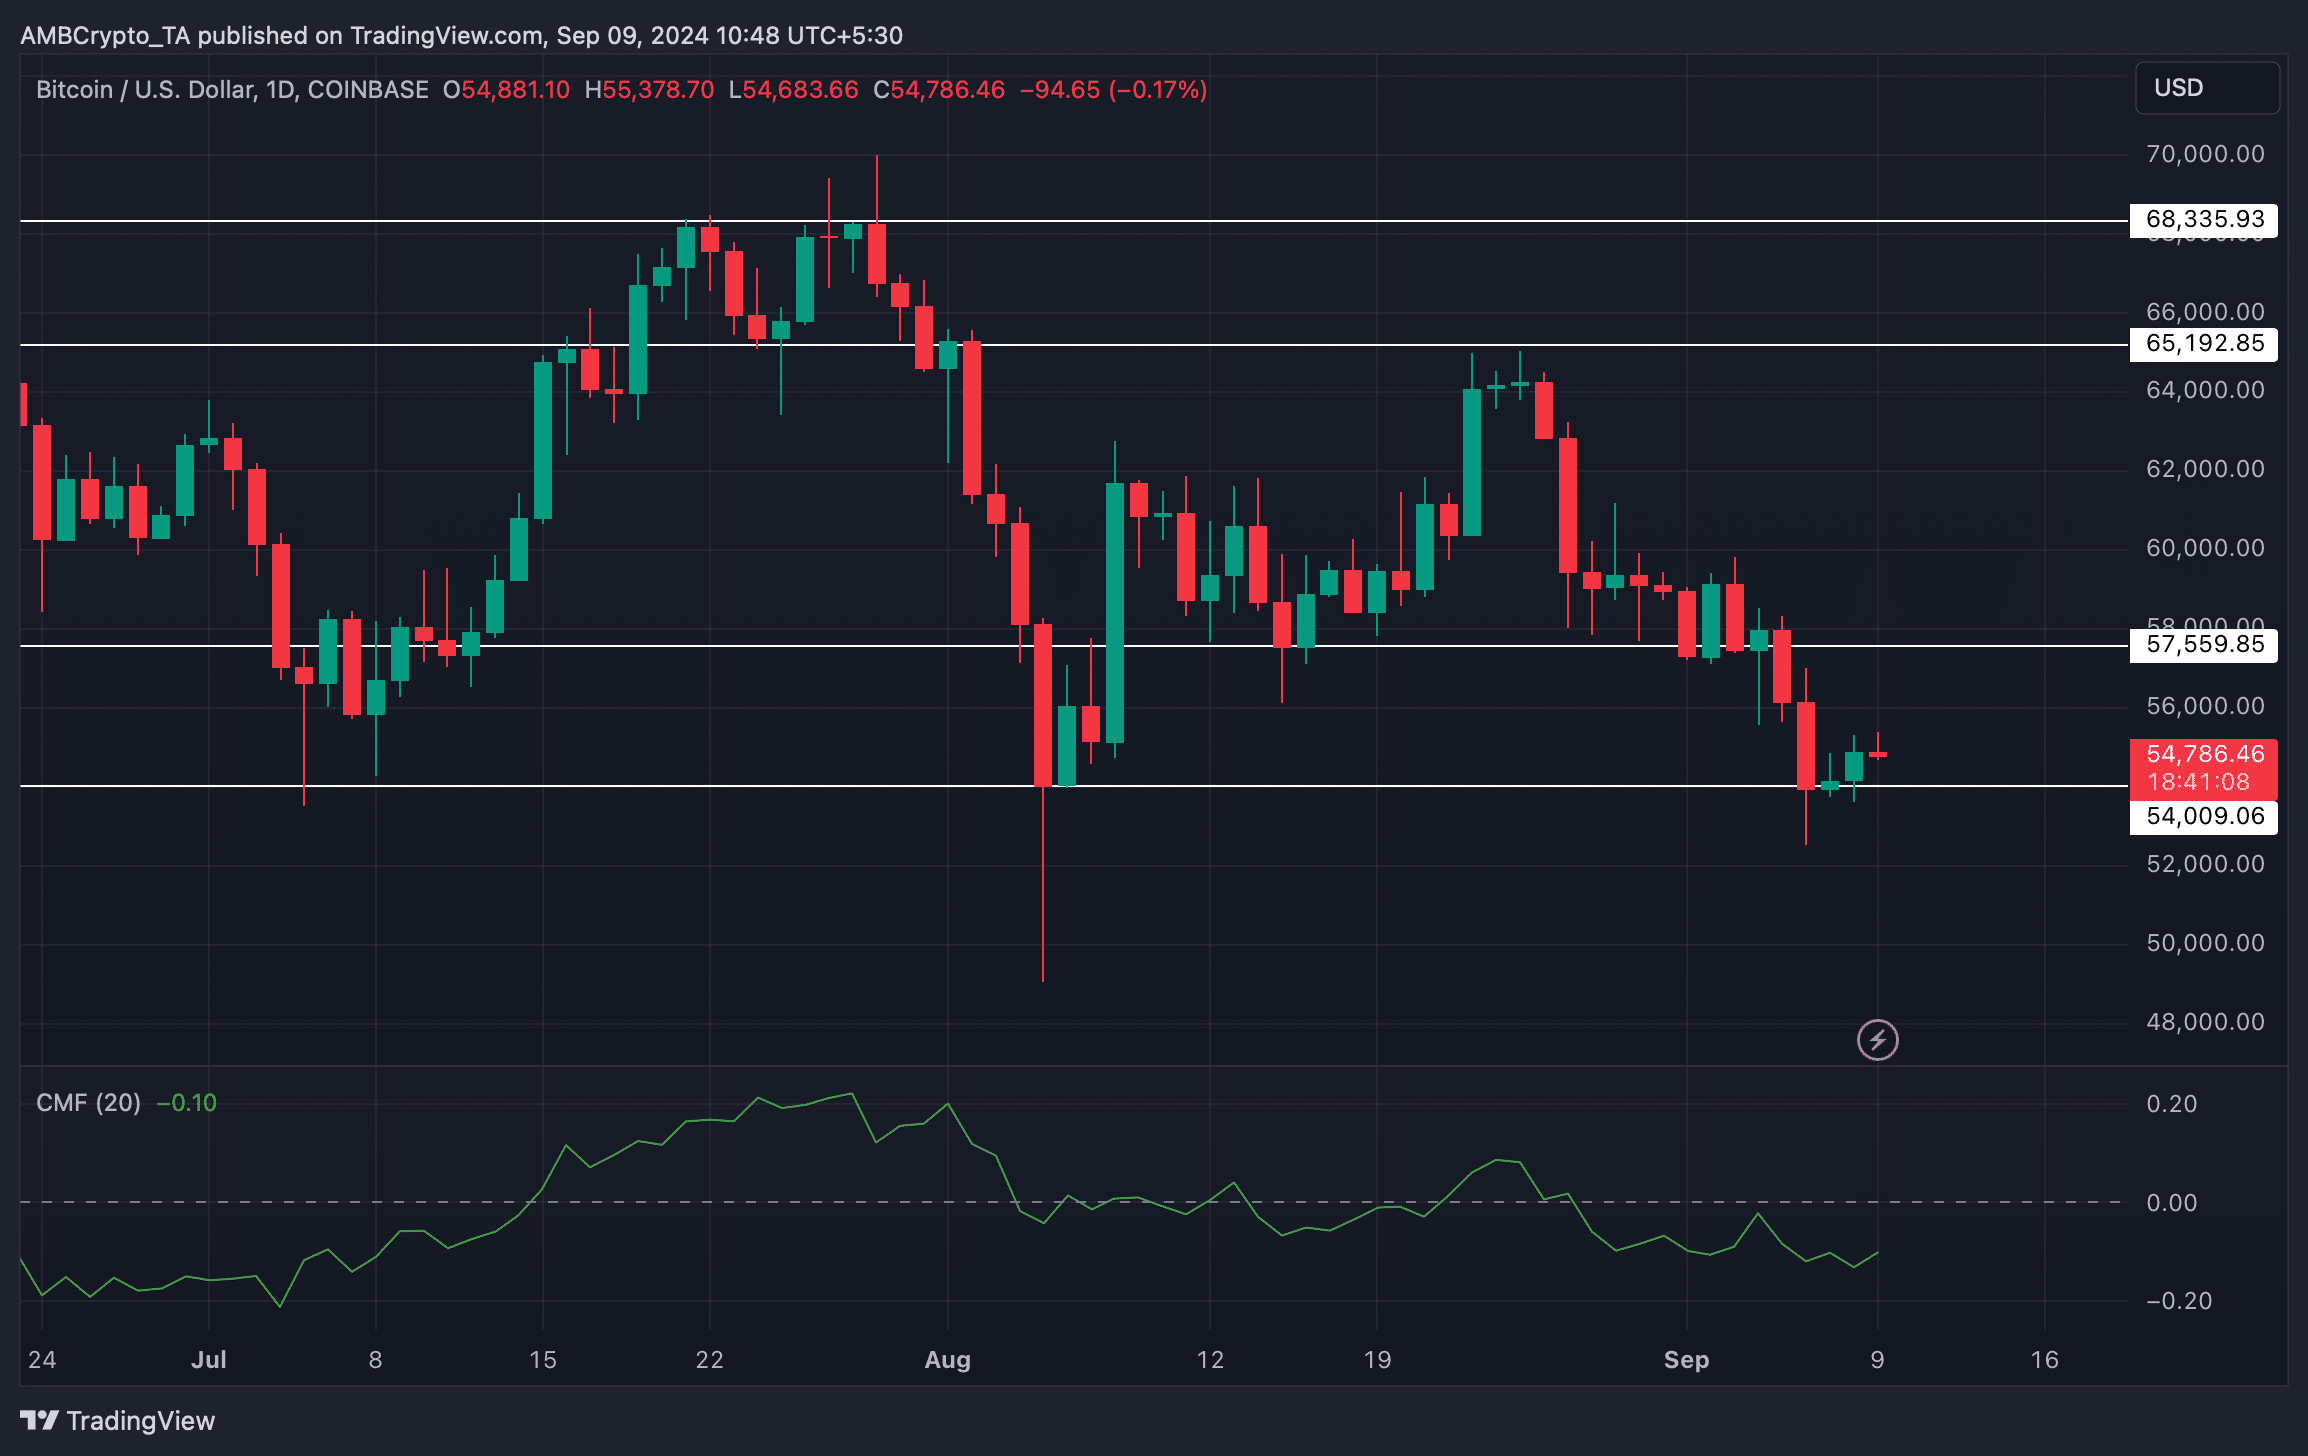
Source: TradingView