


Bitcoin [BTC] has finally caught the attention of Wall Street investors. After five straight days of outflows, Spot Bitcoin ETFs recorded a massive inflow on the 12th of June. Whales are showing a similar bullish stance, signaling growing confidence in the asset.
At press time, BTC climbed 1.30% over the past 24 hours and was trading at the $63,750 level. Despite the price jump, market participants appeared hesitant, as reflected in the trading volume, which tumbled 16% to $24.07 billion.
On-chain and derivatives data signal a shift in market sentiment
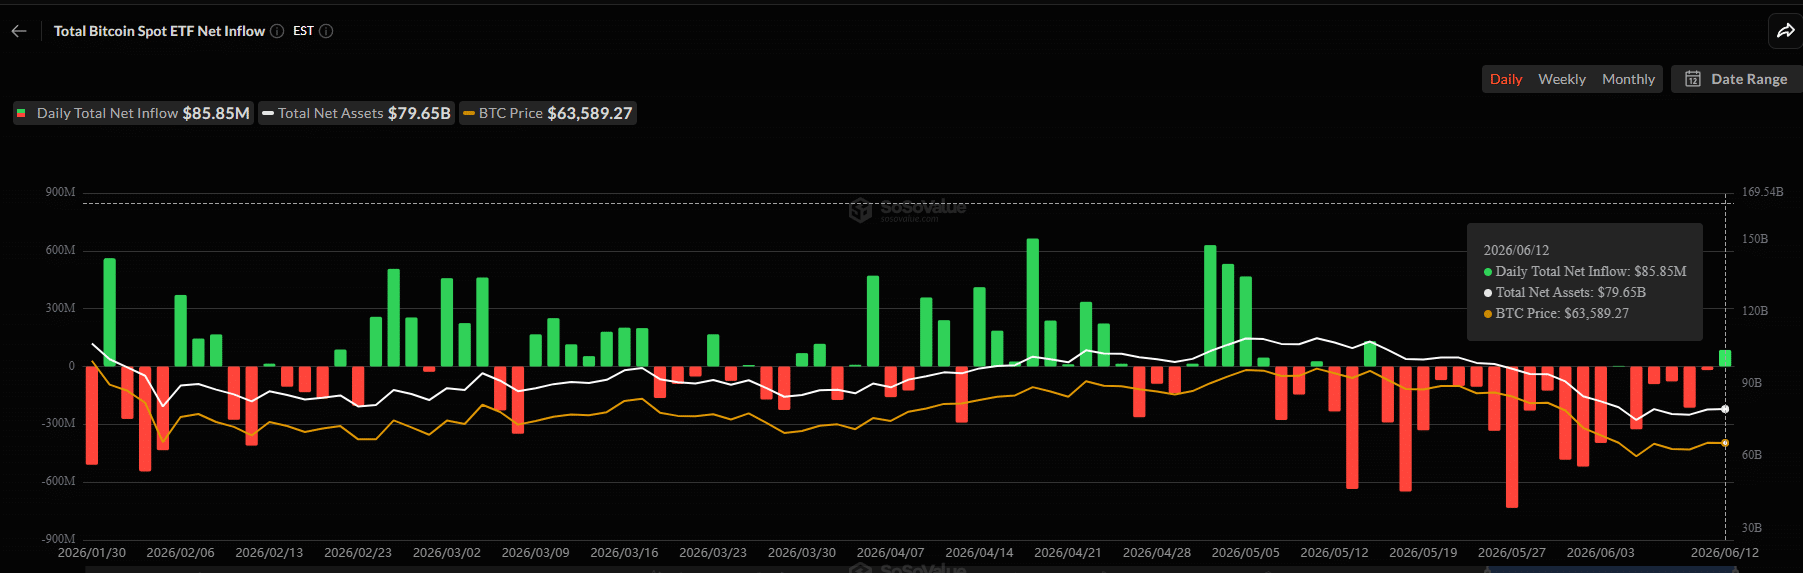
Data from the analytics platform SoSoValue reveals that on the 12th of June, U.S. Spot Bitcoin ETFs recorded a strong inflow of $85.85 million.
This inflow came after five consecutive days of outflows, suggesting that institutional sentiment may be turning bullish again as investors return to accumulate BTC ahead of a potential price reversal.
Meanwhile, crypto investors are also following a similar trend by accumulating BTC. Crypto transaction tracker Onchain Lens shared a post on X, noting that a newly created wallet withdrew 328 BTC worth $20.08 million from Binance.
In addition to investors and long-term holders, traders are also following a similar trend. Data from the derivatives analytics platform CoinGlass shows that Bitcoin’s Long/Short Ratio has risen to 1.03, indicating growing bullish sentiment among traders.
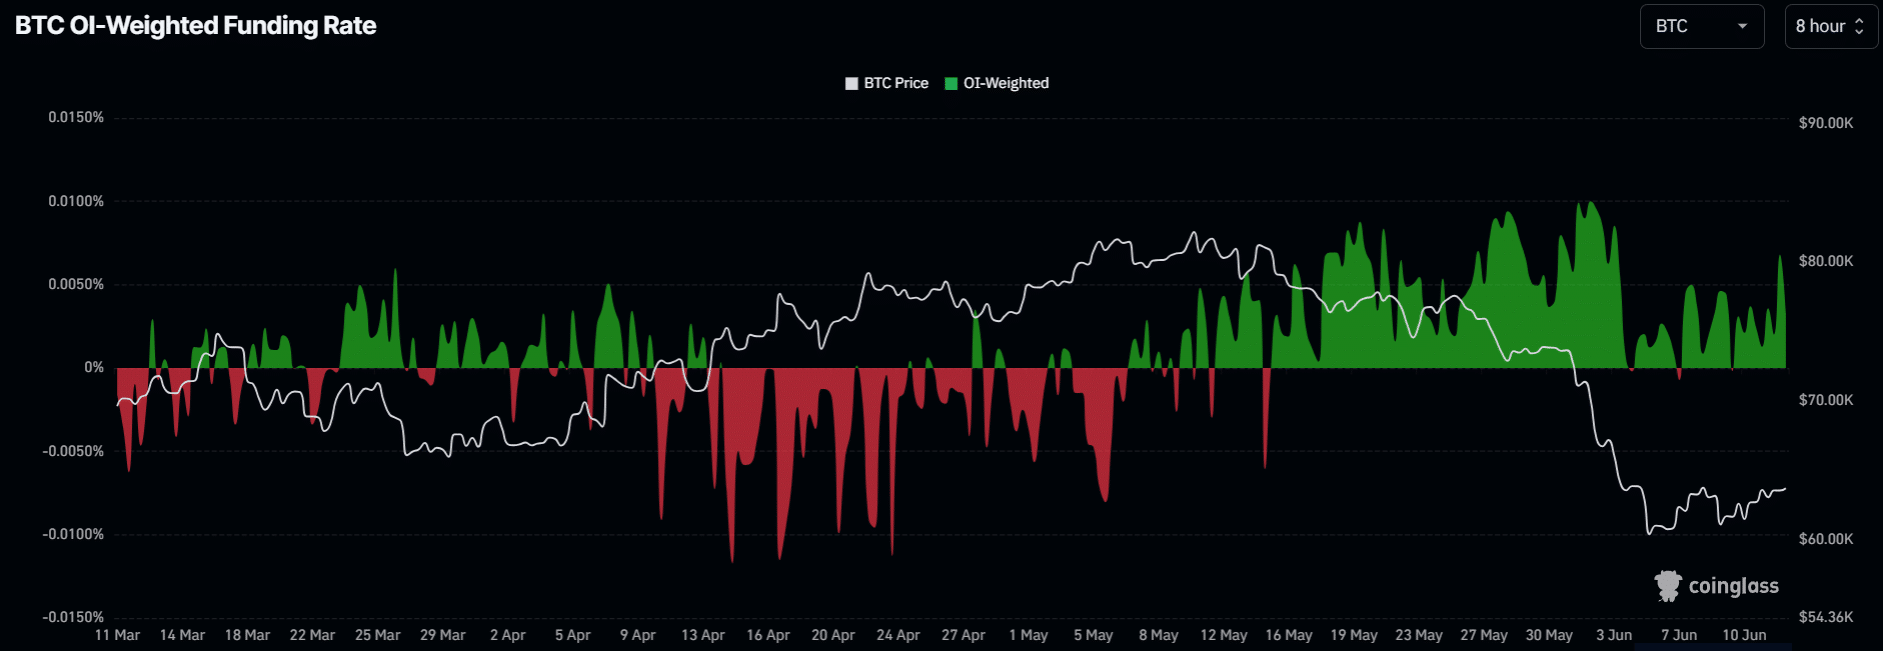
Meanwhile, the OI-Weighted Funding Rate has turned positive and reached +0.0068%, suggesting increasing confidence in a potential upside move.
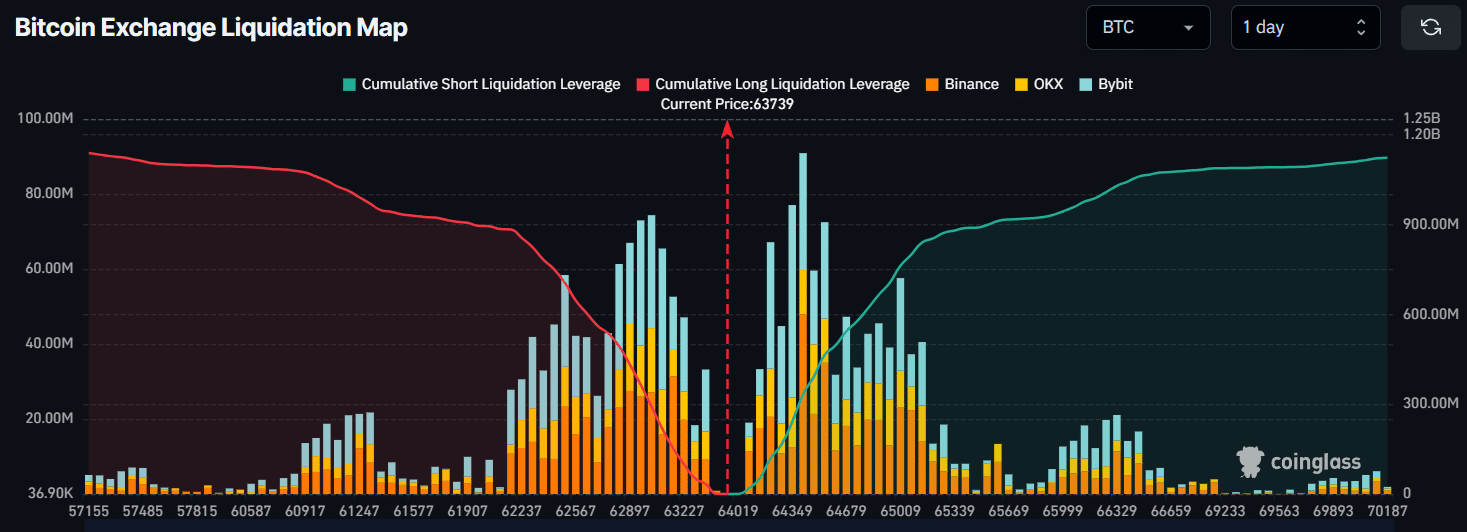
At press time, there were two major liquidation clusters at $63,029 and $64,415, where traders have built significant leveraged positions. Traders at these levels have built $315 million worth of long-leveraged positions and $305 million worth of short-leveraged positions.
When combining this on-chain data with derivatives market metrics, it appears that both investors and traders are bullish on BTC and are expecting the asset to continue its upward move in the coming days.
Bitcoin eyes an 8% price jump, but there’s a catch
According to the daily chart on TradingView, BTC appears to be recovering but is currently approaching a key resistance level at $63,900.
The asset has been facing this level for the past nine trading days, and each time it has approached it, BTC has encountered selling pressure and recorded a notable price decline.
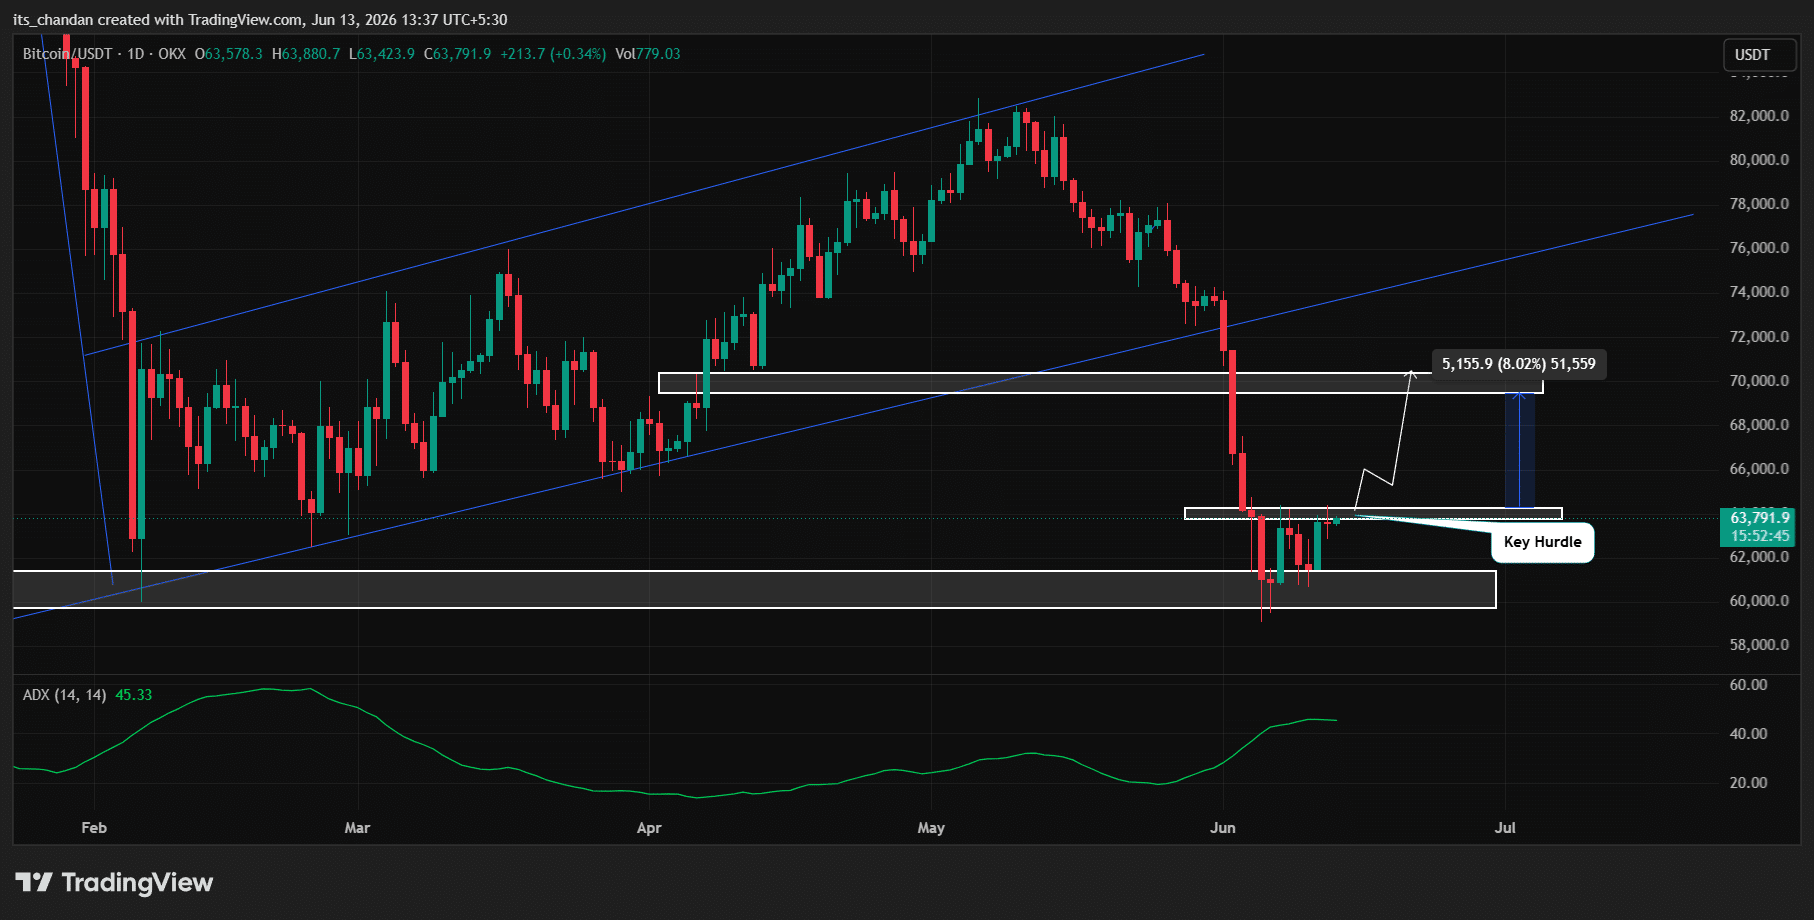
This time, however, sentiment appears to be different. Based on the current price action, if BTC clears this hurdle and closes a daily candle above the $64,000 level, it could open the door for a further upside move.
If that happens, BTC could see an additional price gain of more than 8% and potentially reach the $69,500 level.
However, if it fails to break above the $64,000 level, history may repeat itself, with the asset facing renewed selling pressure and a notable price decline.
Final Summary
- U.S. Spot Bitcoin ETFs recorded an inflow of $85.85 million after five consecutive days of outflows.
- BTC’s daily chart shows that the asset is approaching a key hurdle at $63,900, and a successful breakout above it could trigger an additional 8% price rally.