Bitcoin ETFs shed $773M in 2 days – Yet onchain BTC signals suggest…
A shift toward net exchange inflows, combined with negative positioning index scores, would be a strong warning sign of further bearish pressure.



On the 22nd and 23rd of October, Bitcoin [BTC] spot ETF outflows totaled $773.5 million. On these two days, the leading crypto shed 3.45% on the price charts and has continued to post losses heading into the weekend.
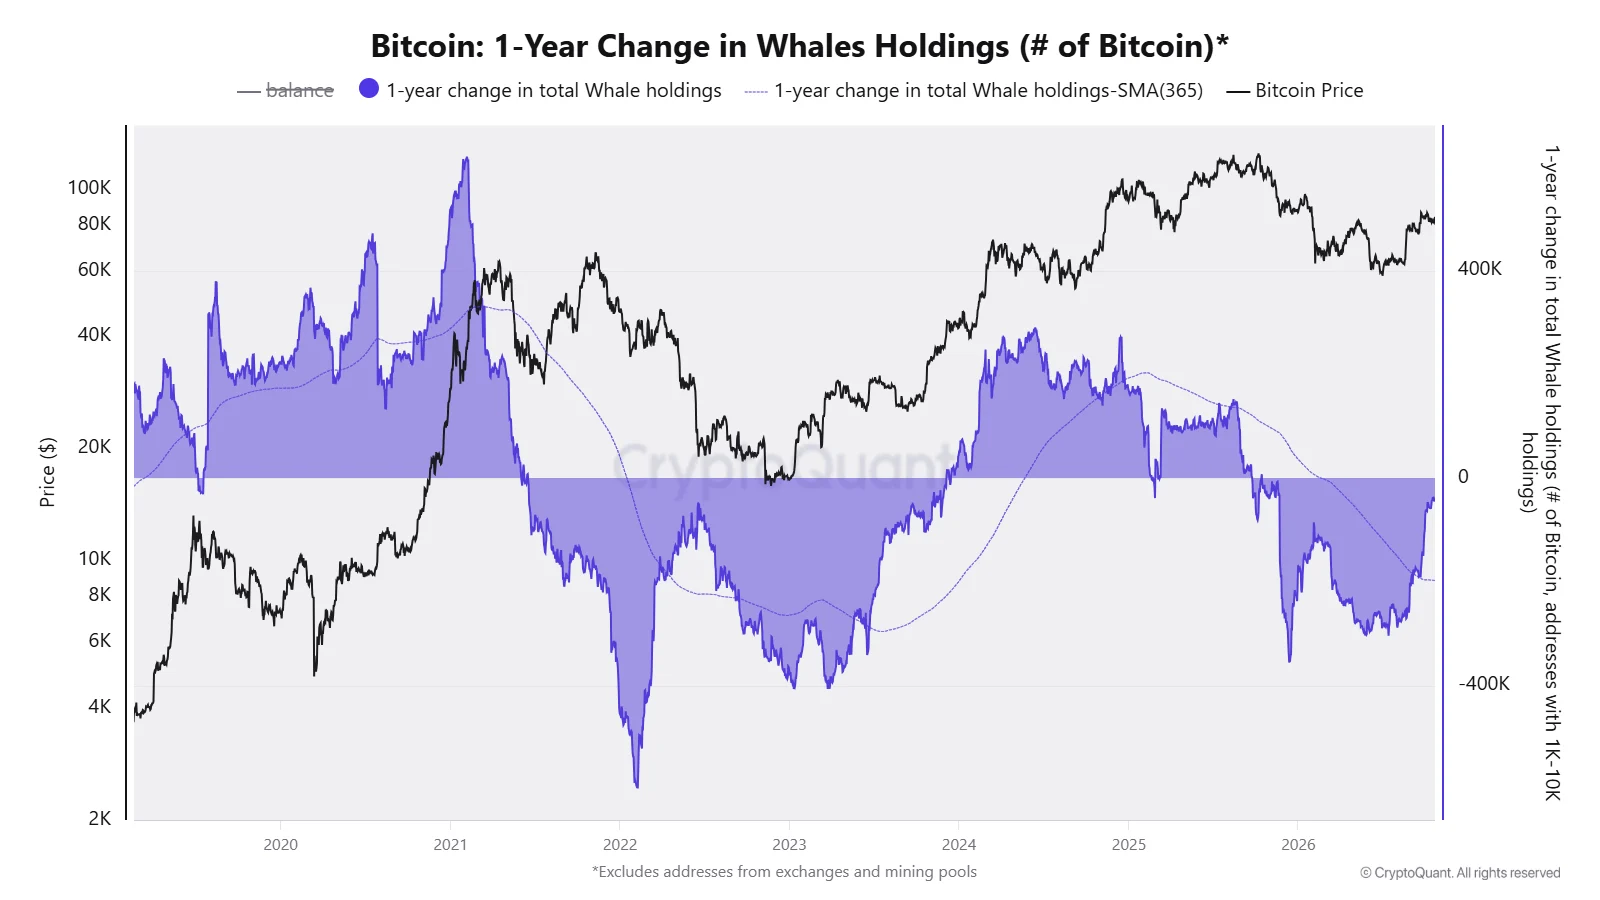
While spot ETFs saw net negative flows for the week from 20th to 23rd October, the whale holdings metric appeared to shift in the other direction. Analyst CW8900 reported that the Bitcoin 1-year change in whale holdings indicator was nearing positive territory.
The selling pressure from whale distribution has been in decline since July, and the change in BTC holdings has climbed from -282k BTC to -39k BTC. In less than three months, whales have bought 243k BTC, the analyst observed.
Bitcoin still in early accumulation phase
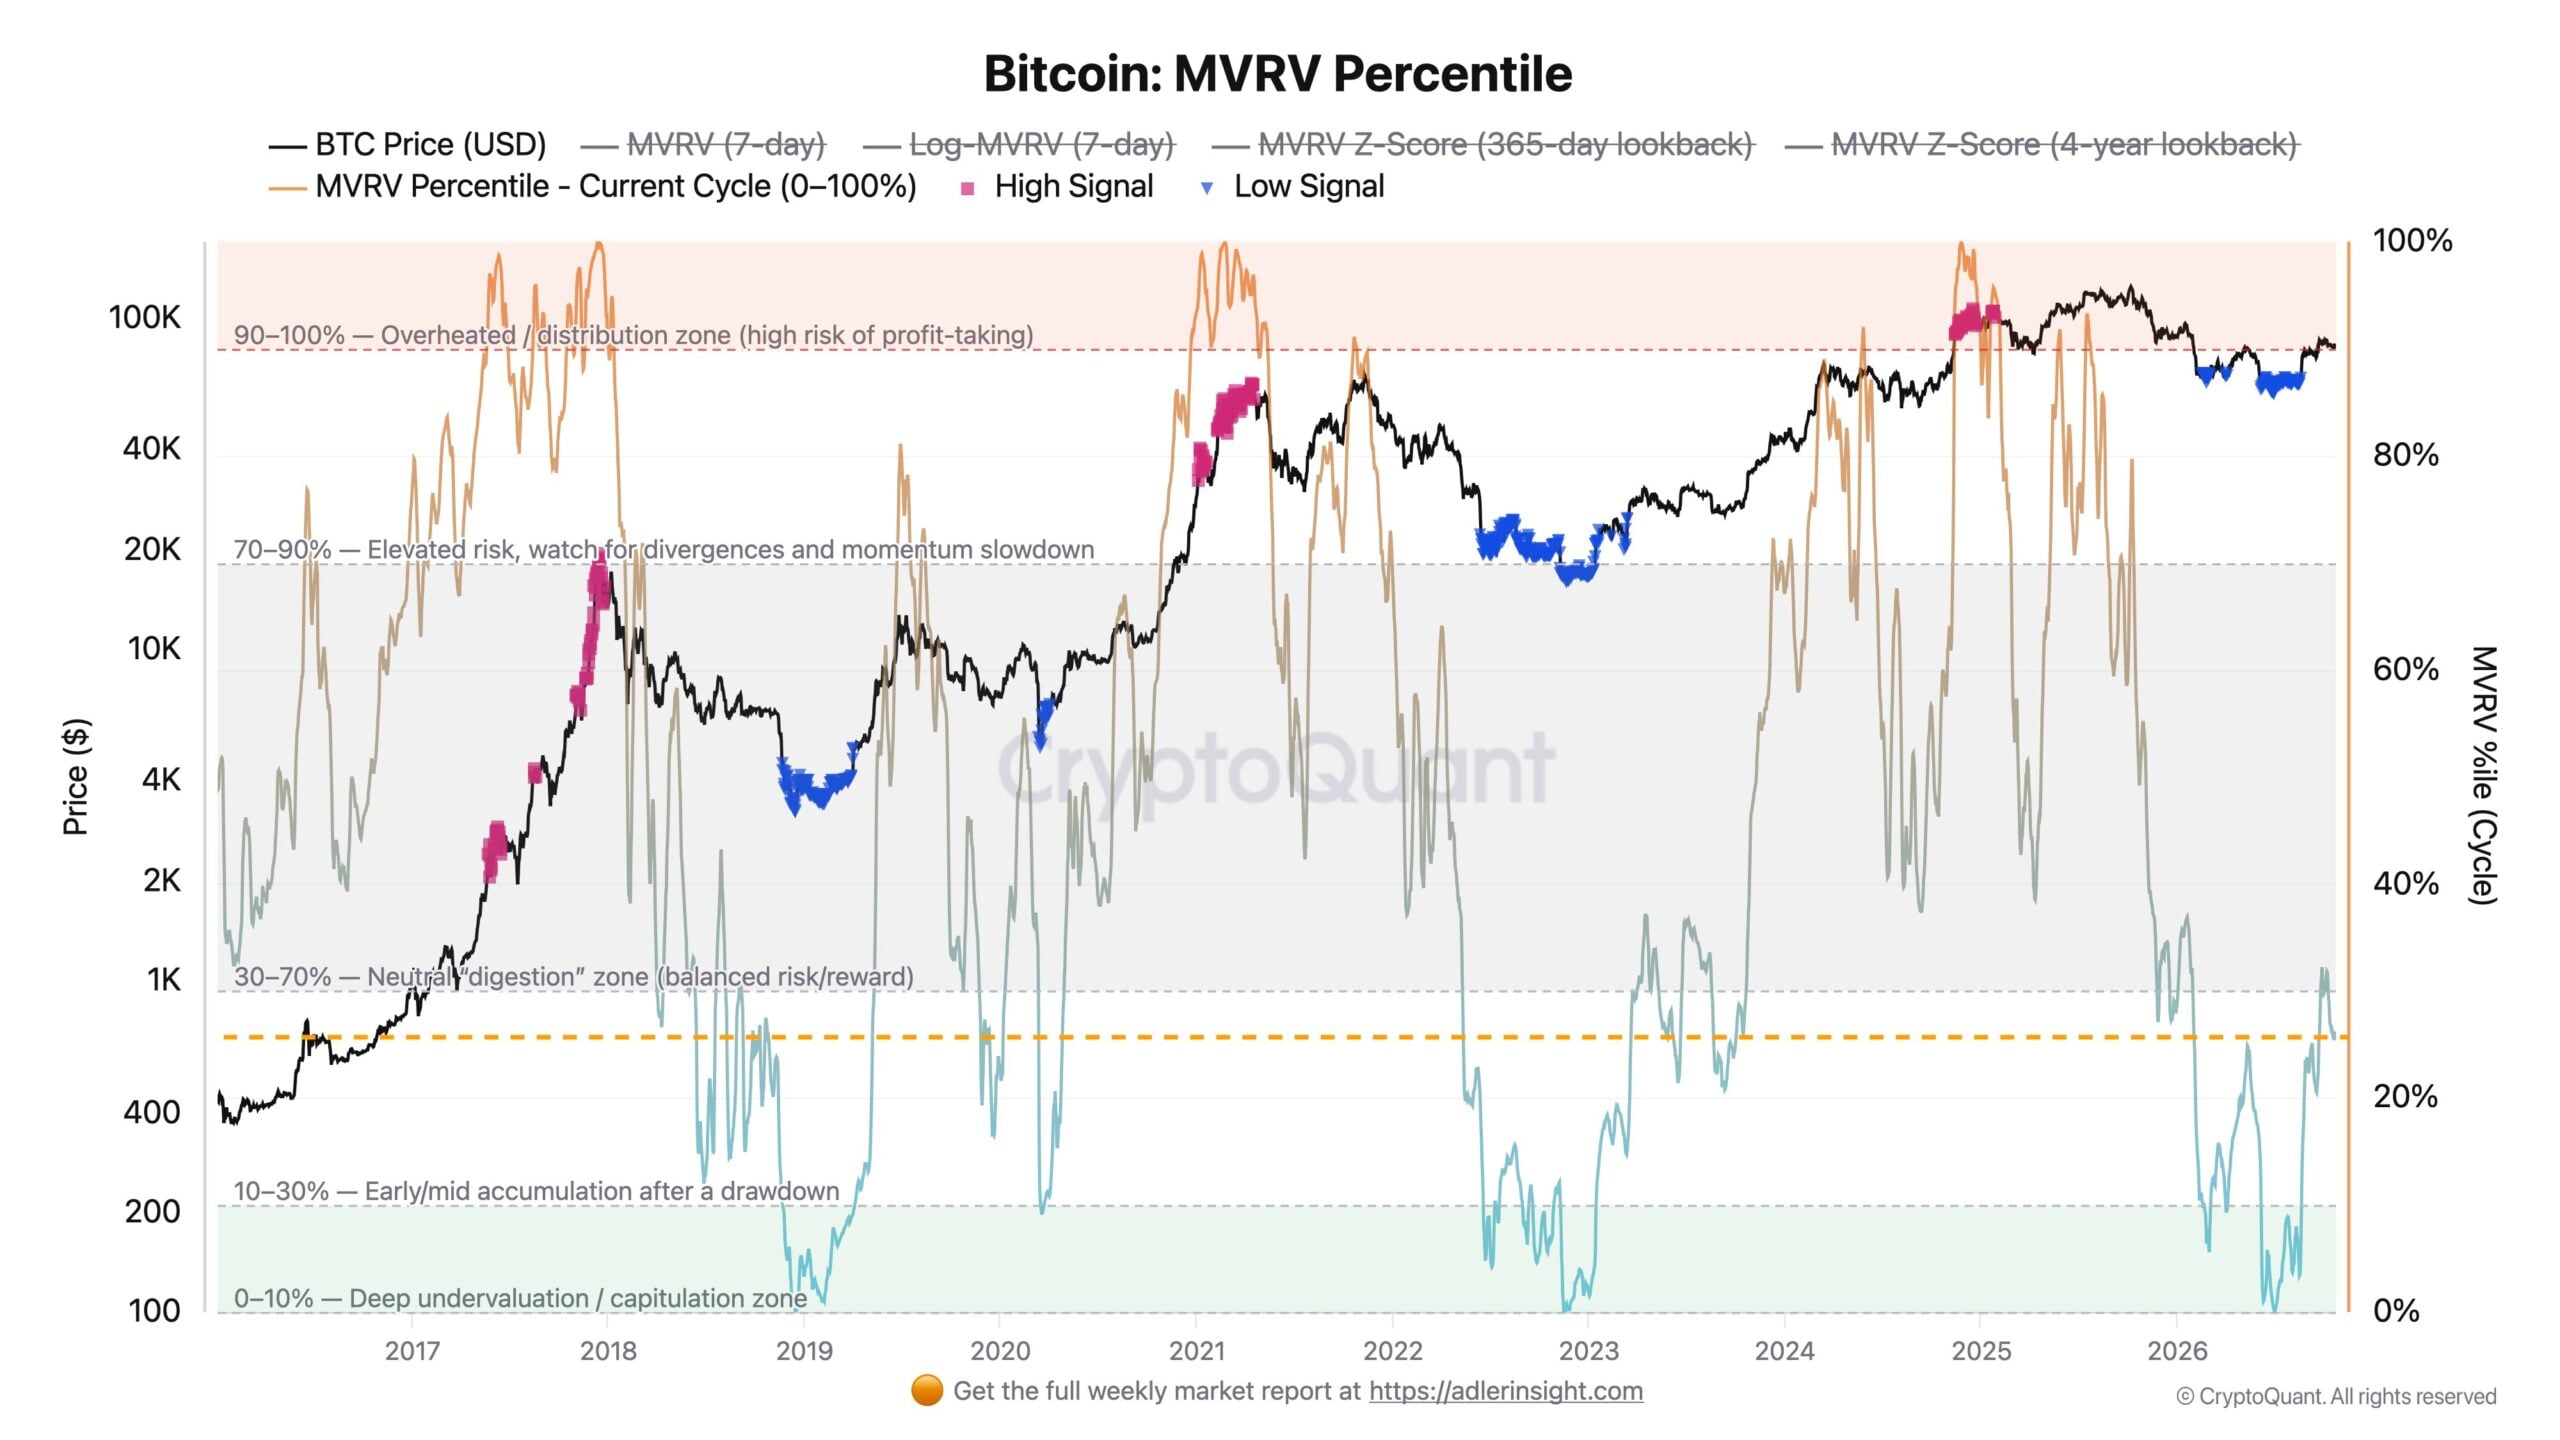
On the 1st of July, when Bitcoin was trading at $59.3k, the MVRV Percentile reached 0%. The metric recovered to 32% by late September, and has since pulled back to 25%.
The metric normalizes the MVRV data into a scale from 0% to 100%. Extremely low values reflect deep undervaluation and, similarly, high values show market euphoria and overextension phases.
Based on the MVRV Percentile reading with this historical context, the market was still in an early to mid accumulation phase, the analyst reported.
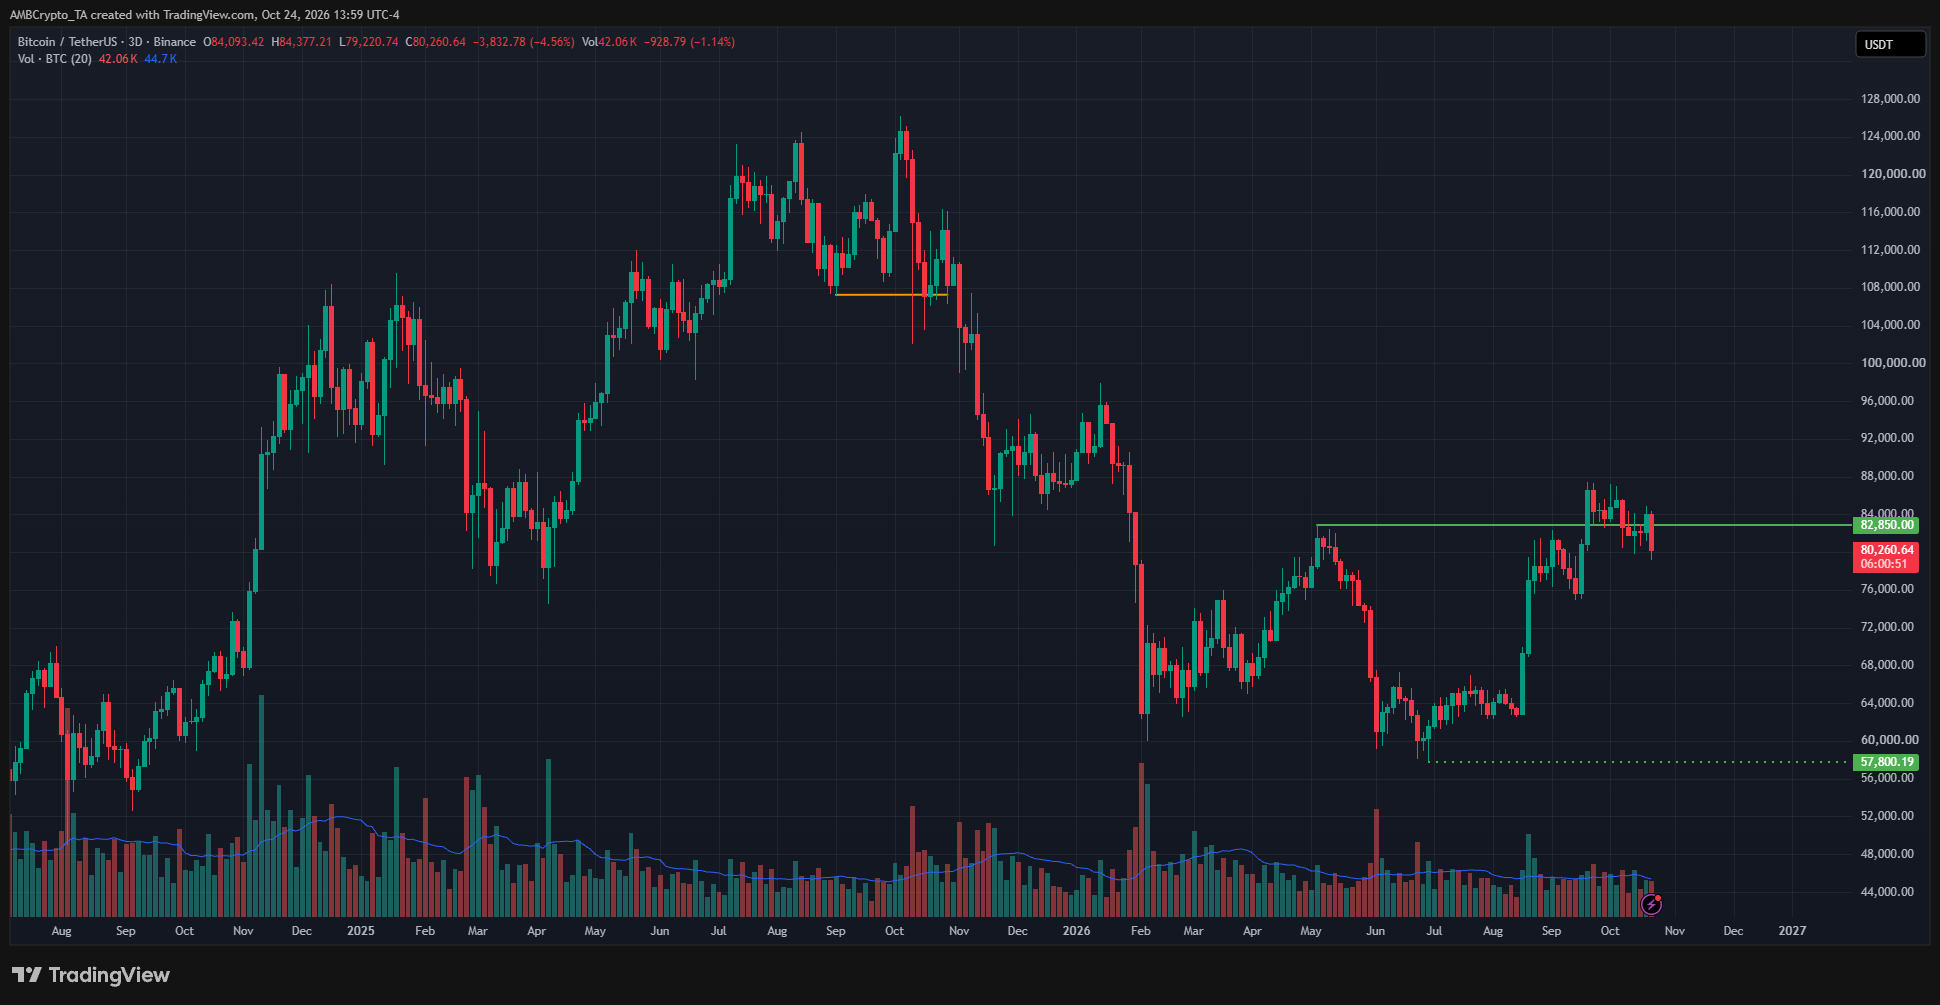
The 3-day timeframe’s price chart also revealed a bullish structure in place, helping hold up the long-term bullish view of a shift in market regime.
Bitcoin exchange supplies shrink while futures buyers and sellers remain balanced
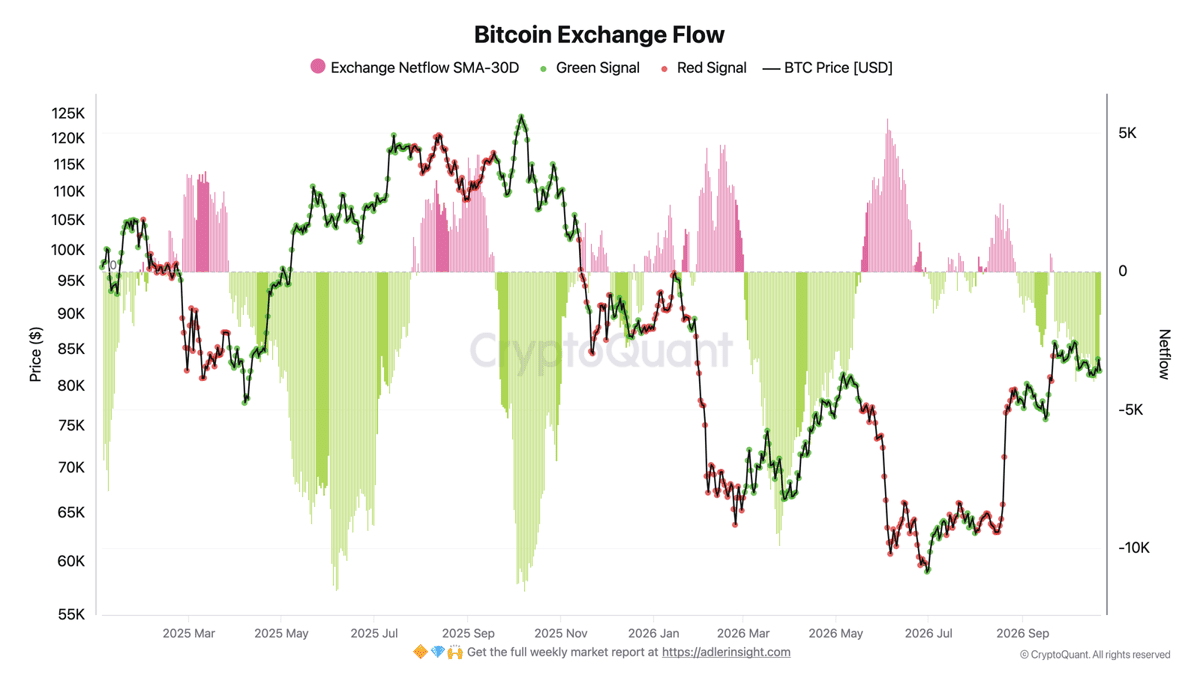
Since the 22nd of September, the 30-day exchange flow has been positive. More BTC has been leaving exchanges than entering, which meant supply on exchanges readily available for selling was shrinking.
It is generally considered to be a sign of buying.
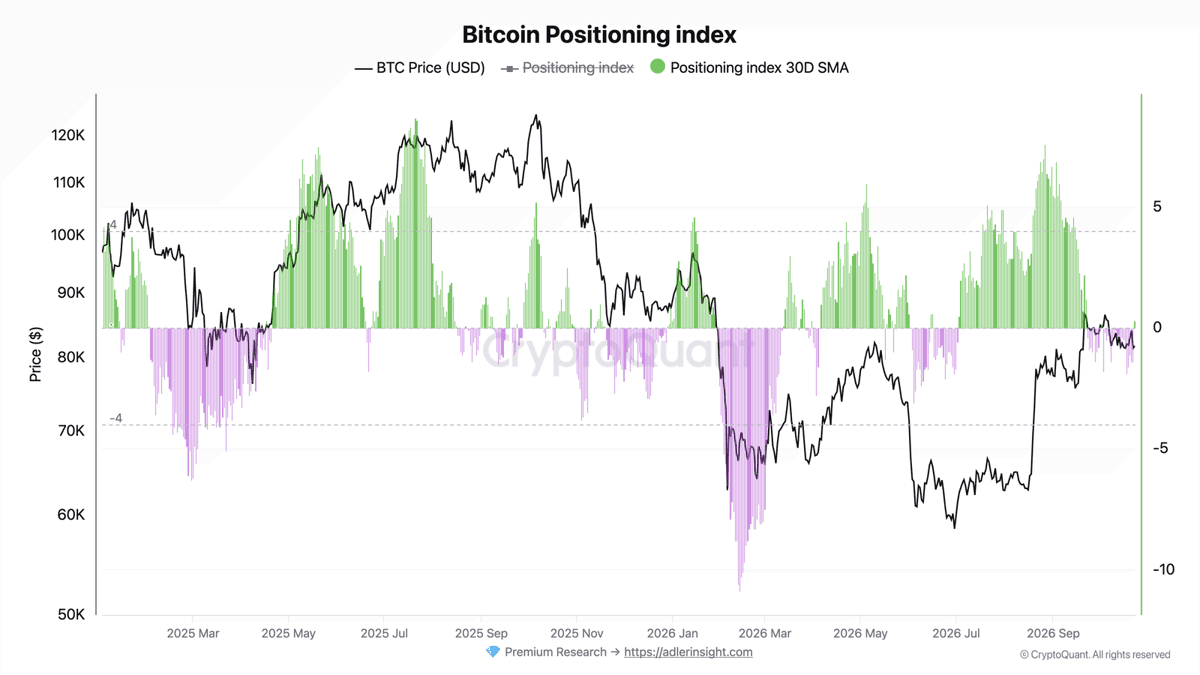
Meanwhile, the 30-day positioning index in the futures market rose to +0.3, up from -0.5 a week ago. The reading was positive but very close to zero, showing that buyers and sellers maintained an equilibrium.
Neither side has an advantage. The analyst warned that a shift toward net exchange inflows, combined with negative positioning index scores, would be a strong warning sign of further bearish pressure.
Final Summary
- The Bitcoin spot ETF outflows of the past week were accompanied by neutral positioning index scores.
- However, the longer-term market cycle appeared to be in an accumulation phase, evidenced by whale buying and coin outflows from exchanges.