Bitcoin & Ethereum: Here’s the reality check on their price trajectories

Bitcoin and Ethereum are moving towards their worst weekly candle close of 2021. If the previous week is clubbed together, the losses are tragic, creating a significant sense of panic in the market. BTC, ETH were respectively down by ~46% and ~53%. Hence, the case for a fractured bull cycle is becoming more evident.
This article analyzes a few fundamentals to evaluate the immediate future for these two crypto assets.
Bitcoin and Ethereum do not exhibit structural market strength at the moment. Both assets have not held positions above their supports. Right now, sliding strongly towards their low from May 19th, the chart indicates the potential degree of sell-off.
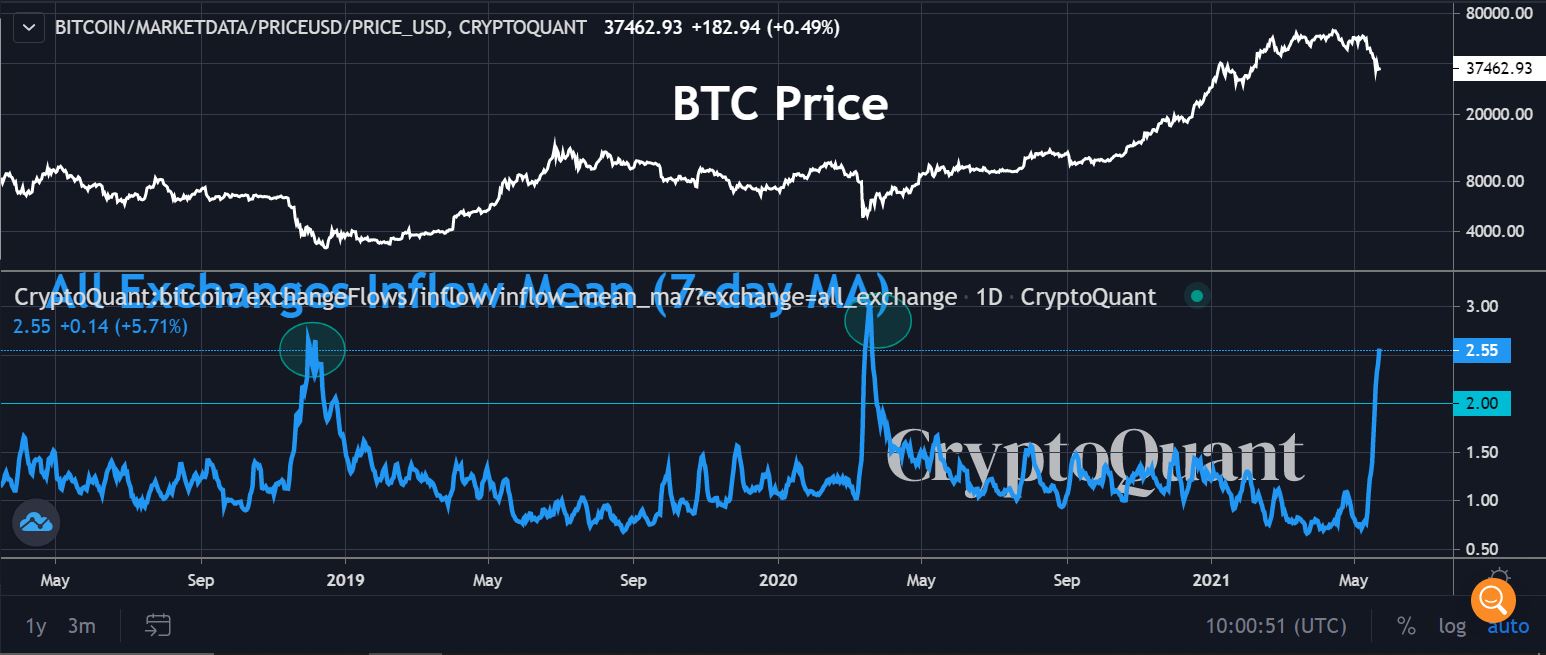
Average exchange inflows have been minimal during the current bull run. The last time mean exchange inflows were up dramatically can be dated back to the March 2020 market collapse. Before that, it can be observed in November 2019. A similar level of inflows has been triggered at press time, which possibly indicates aggressive selling pressure. The sell-off can be considered to be a reason for the invalidation of market supports. As Bitcoin is firmly driving the sentiment, the Altcoin markets are facing a similar decline.
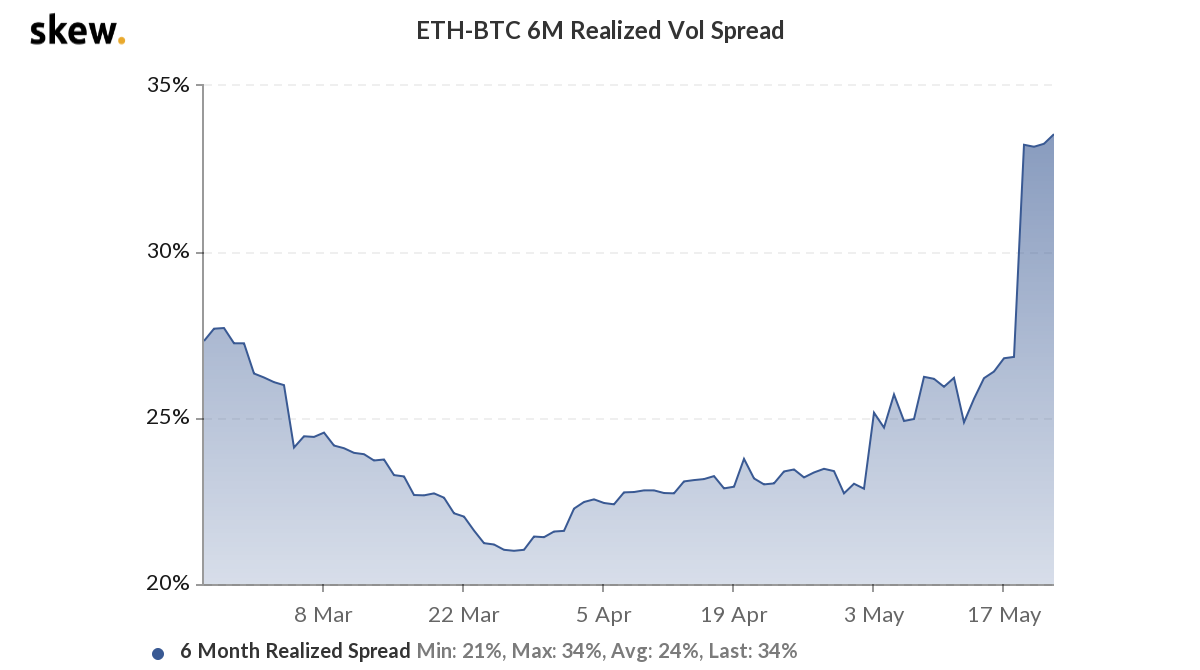
Ethereum-Bitcoin Realized Volatility

Source: Skew
For the majority of 2021, realized volatility of ETH with respect to BTC has played in the Altcoins’ favor. However, an excessive extension in the above chart is another point of concern.
Realized volatility is investors’ witnessing volatility of an asset over a specific period and is driven by net buying pressure for options and historical price volatility. In this case, the focus is on the difference, or spread, between the realized volatilities of the two crypto assets. It creates a major caveat because now the volatility is extensive in a bear market. It can be speculated that the drawdown could possibly be more detrimental if buying pressure does not pick up.
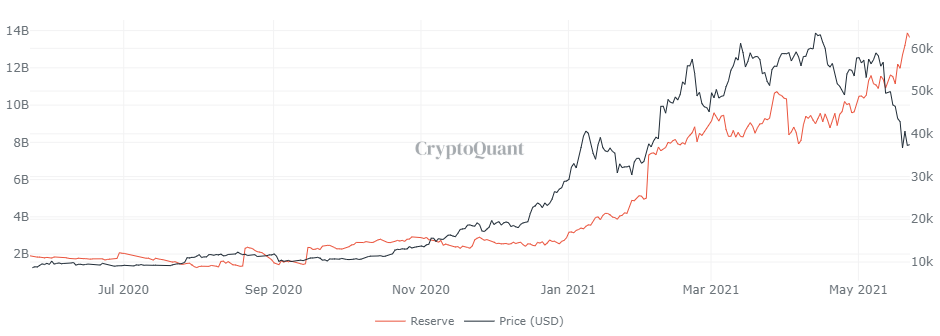
Speaking of buying pressure, the reserve is right there!
While Bitcoin inflows might be increasing, one reference point to where it might be going can be illustrated by the above chart. The stablecoin reserves on exchanges reached a new top, indicating that people were keeping their capital on exchanges, rather than liquidating for cash.
This is a positive sign considering, selling pressure will reach a point of exhaustion eventually. Stablecoins reserves increasing on exchanges suggest that the sentiment is still positive among traders, as the game of patience is currently in play.
Taking it one week at a time?
Two weeks of a bearish market will close out in a few hours. While it may vary for a third, the last time three weeks of corrections was observed, was back in March 2020. Considering, we are not facing a black swan event now, traders may look for some substantive recovery in the coming days. However, getting back in full-bullish mode might take a while now, so Diamond Hands could be the next trending phrase on Twitter.


