Bitcoin eyes $100k milestone: Just one hurdle left to clear!

- Bitcoin registered double-digit growth over the last seven days.
- Market indicators remained bullish in the king of cryptos.
Bitcoin [BTC] has remained bullish throughout the last week, as its weekly and daily charts were both green. Things can get even better for the king of cryptos if it manages to stay above a critical mark before ending this week.
Let’s find out what metrics suggest regarding BTC closing above that level.
Bitcoin’s road to $100k
CoinMarketCap’s data revealed that BTC’s price increased by more than 11% in the last seven days. The king of crypto’s daily price chart also remained green.
At the time of writing, BTC was trading at $66,998.13 with a market capitalization of over $1.32 trillion.
While BTC bulls were pushing the coin’s price up, Titan of Cryptos, a popular crypto analyst, recently posted a tweet revealing an interesting update.
As per the tweet, if Bitcoin manages to close this week above $65.1k, then it might trigger yet another bull rally. If that happens, then expecting BTC to touch $100k in the coming days or weeks won’t be a long shot.
The possibility of BTC touching $100k didn’t look very ambitious, as a key indicator also hinted at that possibility.
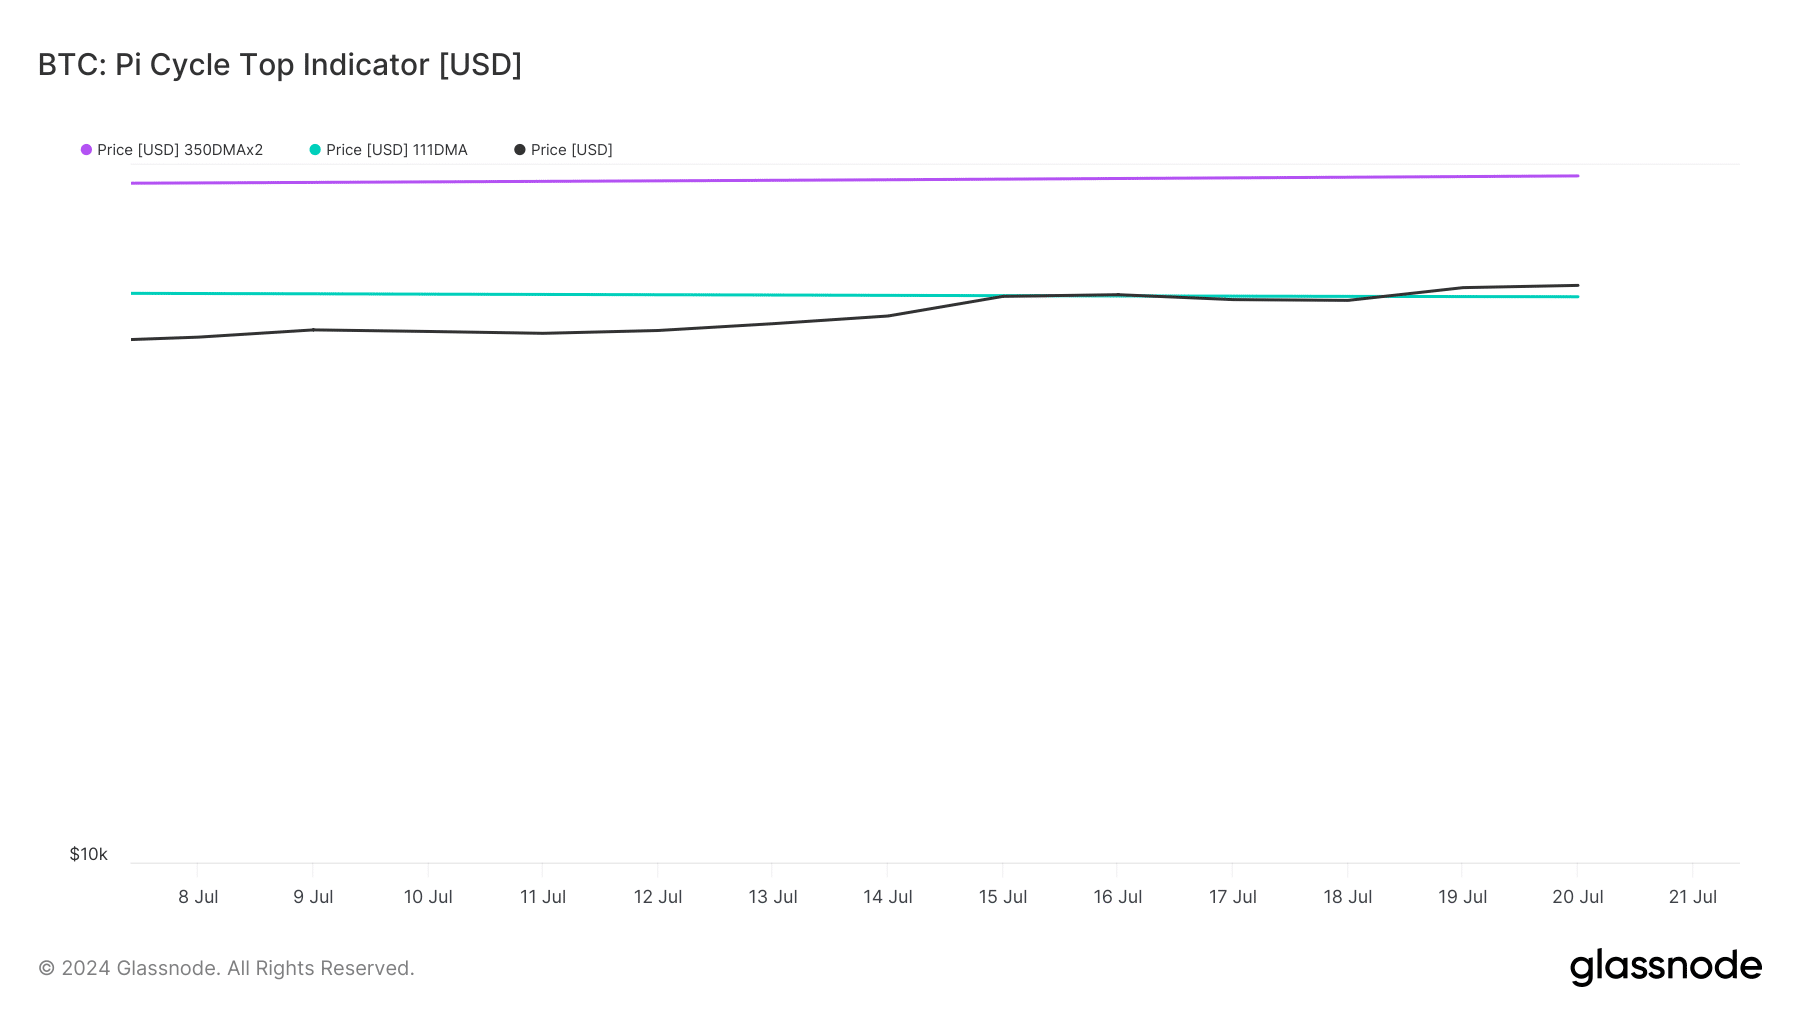
AMBCrypto’s look at BTC’s Pi Cycle top indicator revealed that BTC’s price was finally trading above its market bottom. If the indicator is to be believed, then BTC’s possible market top would be $96.4k.
Will BTC sustain its bullish momentum?
AMBCrypto then checked CryptoQuant’s data to see whether metrics supported the possibility of a continued bullish price action. As per our analysis, BTC’s exchange reserve was dropping, meaning that selling pressure was low on the coin.
Both its active addresses and transactions also increased in the last 24 hours, which can be considered bullish.
On top of that, miners were also confident in BTC. This was evident from its green Miners’ Position Index (MPI), meaning that miners were selling fewer holdings compared to their one-year average.
However, its aSORP was red, suggesting that more investors were selling at a profit. In the middle of a bull market, it can indicate a market top.
At the time of writing, BTC’s fear and greed index had a reading of 72%, meaning that the market was in a “greed” phase. Whenever the metric hits this level, it suggests that the chances of a price correction are high.
Read Bitcoin’s [BTC] Price Prediction 2024-25
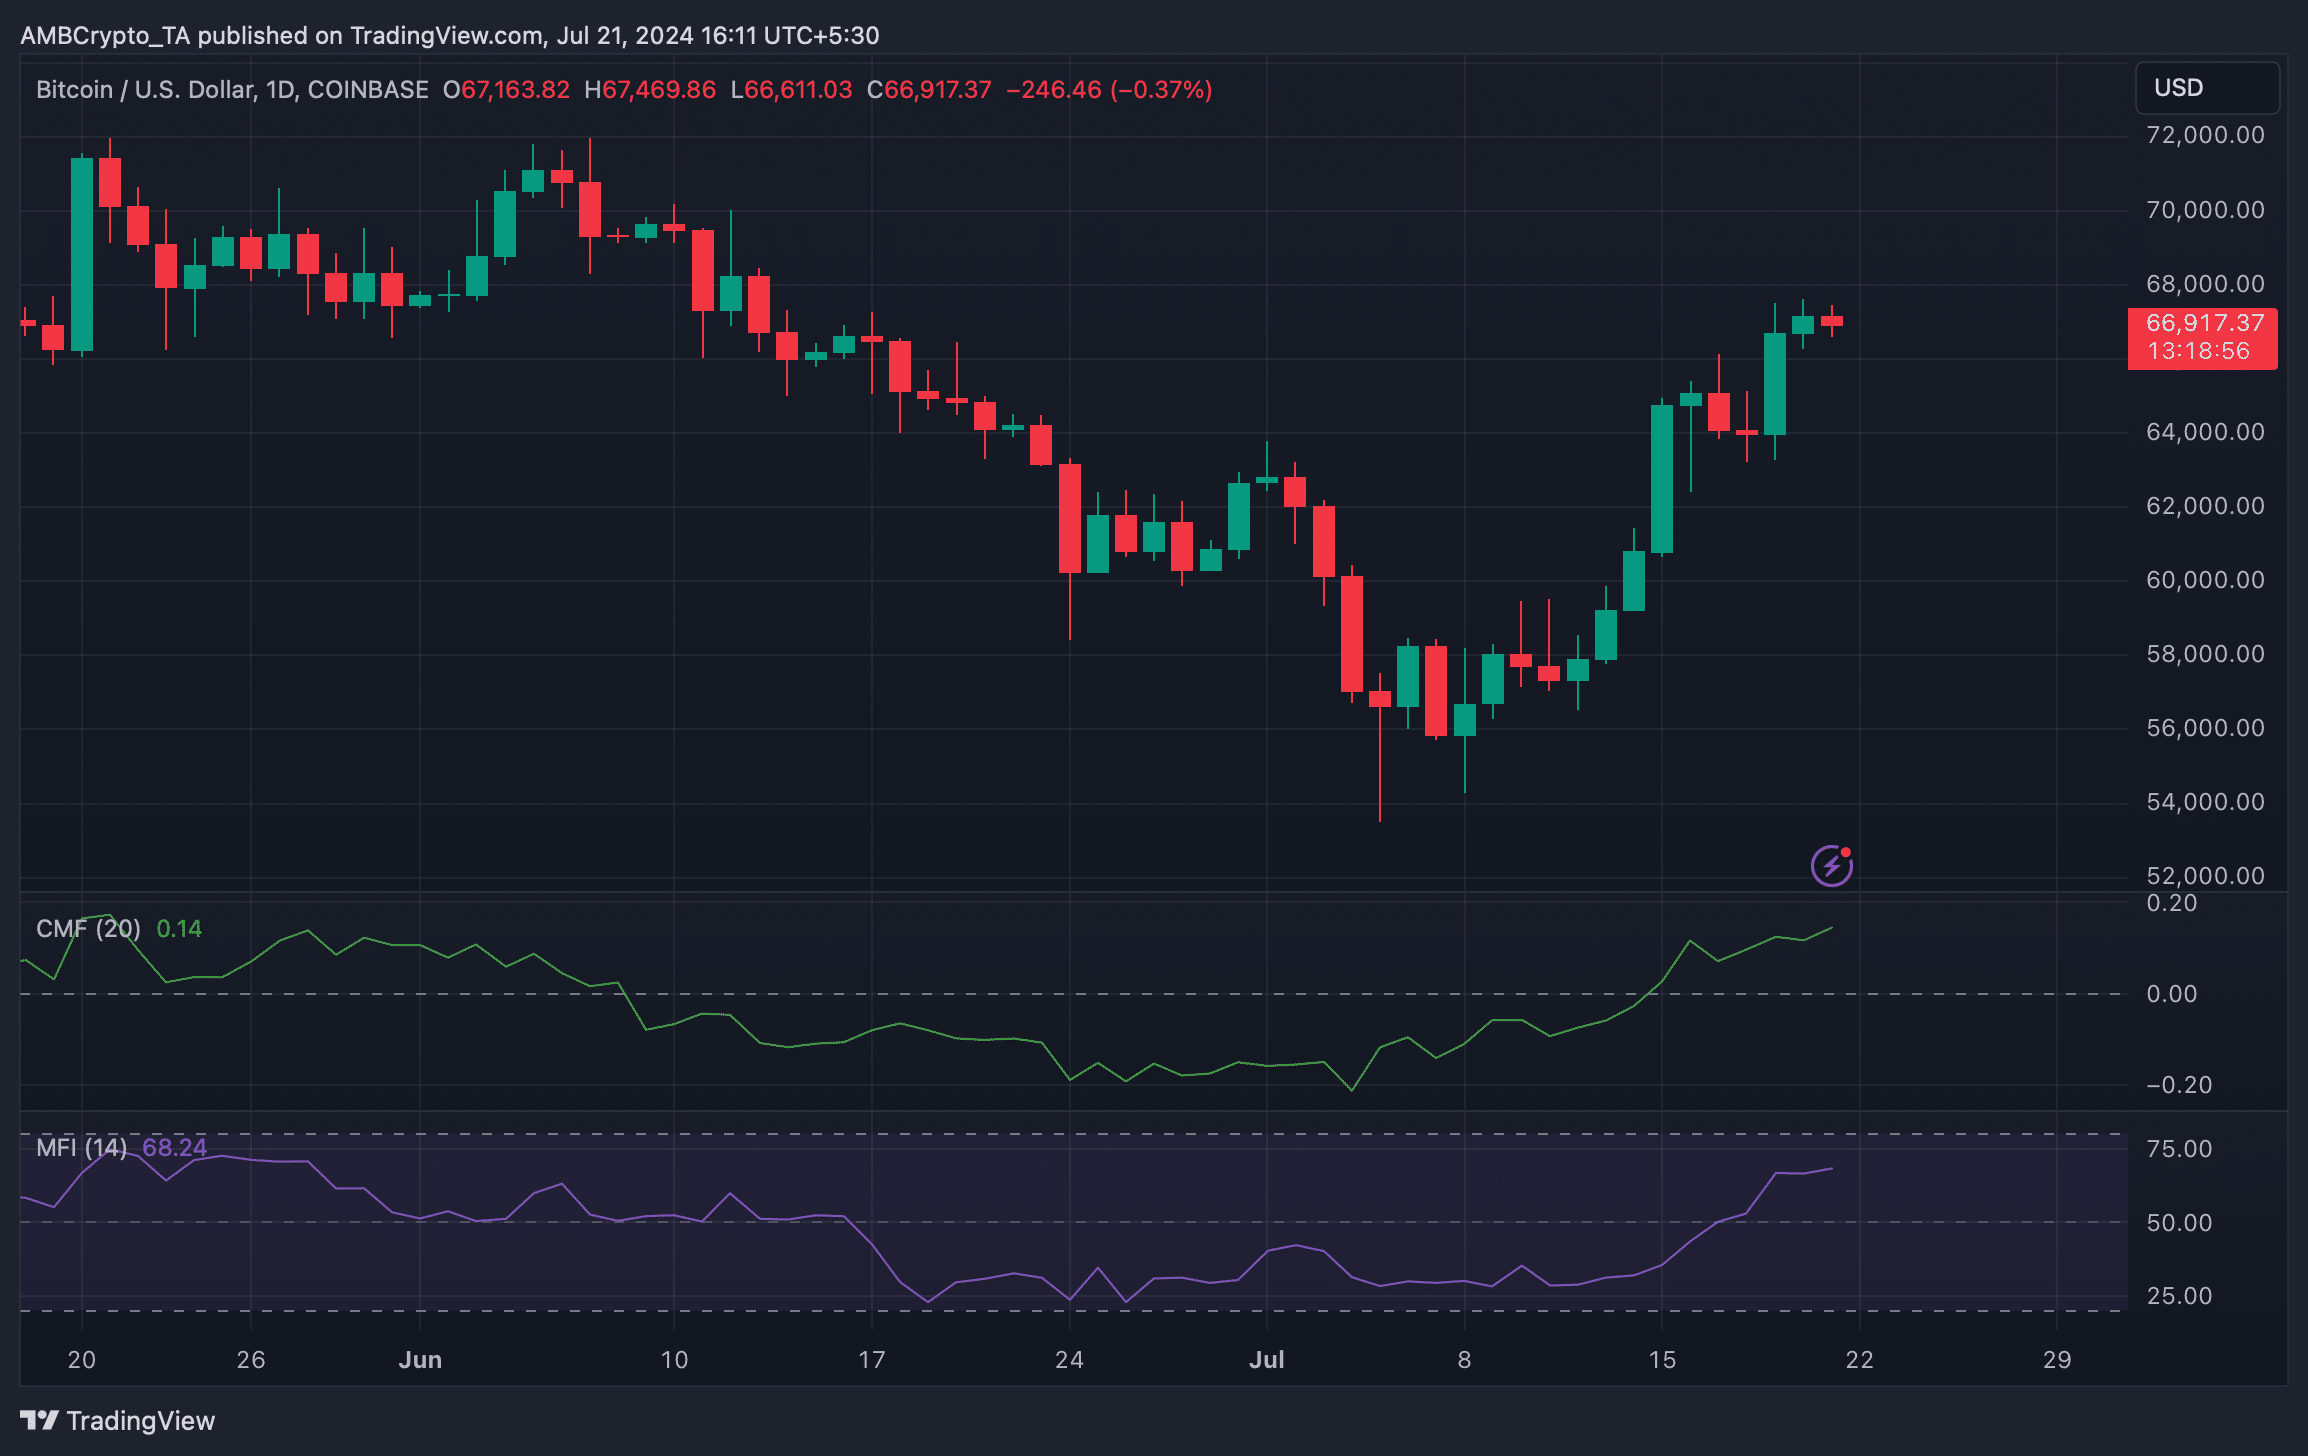
To see whether that’s possible, AMBCrypto then checked BTC’s daily chart. Unlike the aforementioned metrics, market indicators remained bullish.
For example, BTC’s Money Flow Index (MFI) and Chaikin Money Flow (CMF) registered upticks, hinting at a continued price rise.


