- After touching $61k, BTC witnessed a price correction.
- Selling pressure on the coin increased over the last 24 hours.
In the last 24 hours, optimism in the crypto market increased as Bitcoin [BTC], the king of cryptos, reclaimed $61k. However, the trend didn’t last long as the coin witnessed a price correction. Let’s have a closer look at what’s going on with BTC.
Bitcoin turns bearish again
The king of cryptos gained bullish momentum and managed to go above $61k on the 20th of August. But the scenario changed soon as the bears took over the market.
According to CoinMarketCap, BTC’s price dropped by over 2.5% in the last 24 hours. At the time of writing, the coin was trading at $59,378.99 with a market capitalization of over $1.17 trillion.
The interesting bit was that this recent price correction wasn’t unforeseen.
Ali, a popular crypto analyst, posted a tweet revealing that BTC’s TD sequential flagged a sell signal. Soon after the signal got revealed, the coin’s price witnessed a correction.
AMBCrypto’s look at CryptoQuant’s data pointed out quite a few factors that might have played a role in cursing BTC to plummet. As per our analysis, BTC’s exchange reserve was rising, indicating an increase in selling pressure.
The fact that investors were selling Bitcoin was further proven by its exchange netflow as it increased.
To be precise, BTC’s net deposit on exchanges was high compared to the 7-day average. Higher deposits can be interpreted as higher selling pressure. Nonetheless, BTC’s Coinbase Premium remained green, suggesting that buying sentiment was dominant among US investors.

Source: CryptoQuant
Will this trend continue?
AMBCrypto then took a look at Glassnode’s data to find out the odds of this bearish trend continuing. We found that Bitcoin’s NVT ratio dropped significantly.
A decline in the metric means that an asset is undervalued, hinting at a price increase. For starters, the NVT ratio is computed by dividing the market cap by the transferred on-chain volume measured in USD.
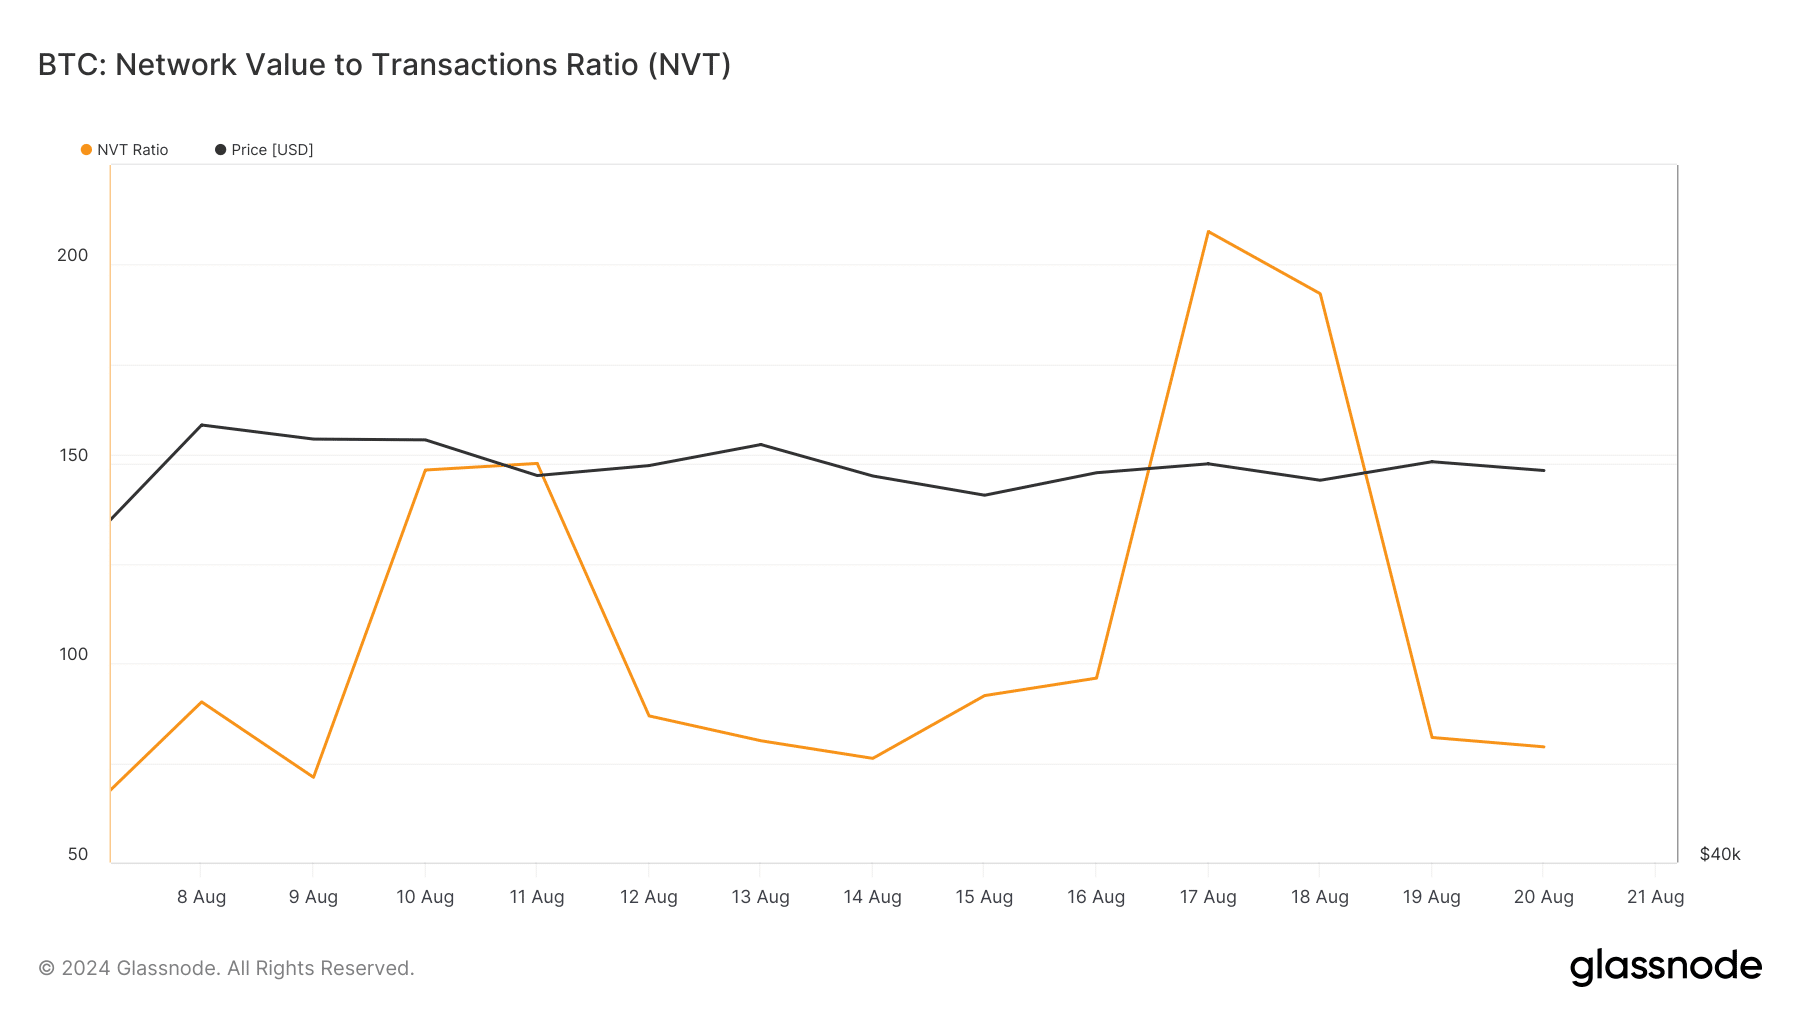
Source: Glassnode
But things in the derivatives market didn’t look in buyers’ favor. For instance, BTC’s taker buy/sell ratio turned red. This clearly meant that selling sentiment was dominant in the futures market.
Therefore, AMBCrypto checked BTC’s daily chart to better understand what to expect. The technical indicator MACD displayed a bullish crossover.
Is your portfolio green? Check out the BTC Profit Calculator
BTC’s Relative Strength Index (RSI) was slowly approaching the neutral mark, which was a bullish signal.
Nonetheless, the Chaikin Money Flow (CMF) turned bearish as it registered a downtick.
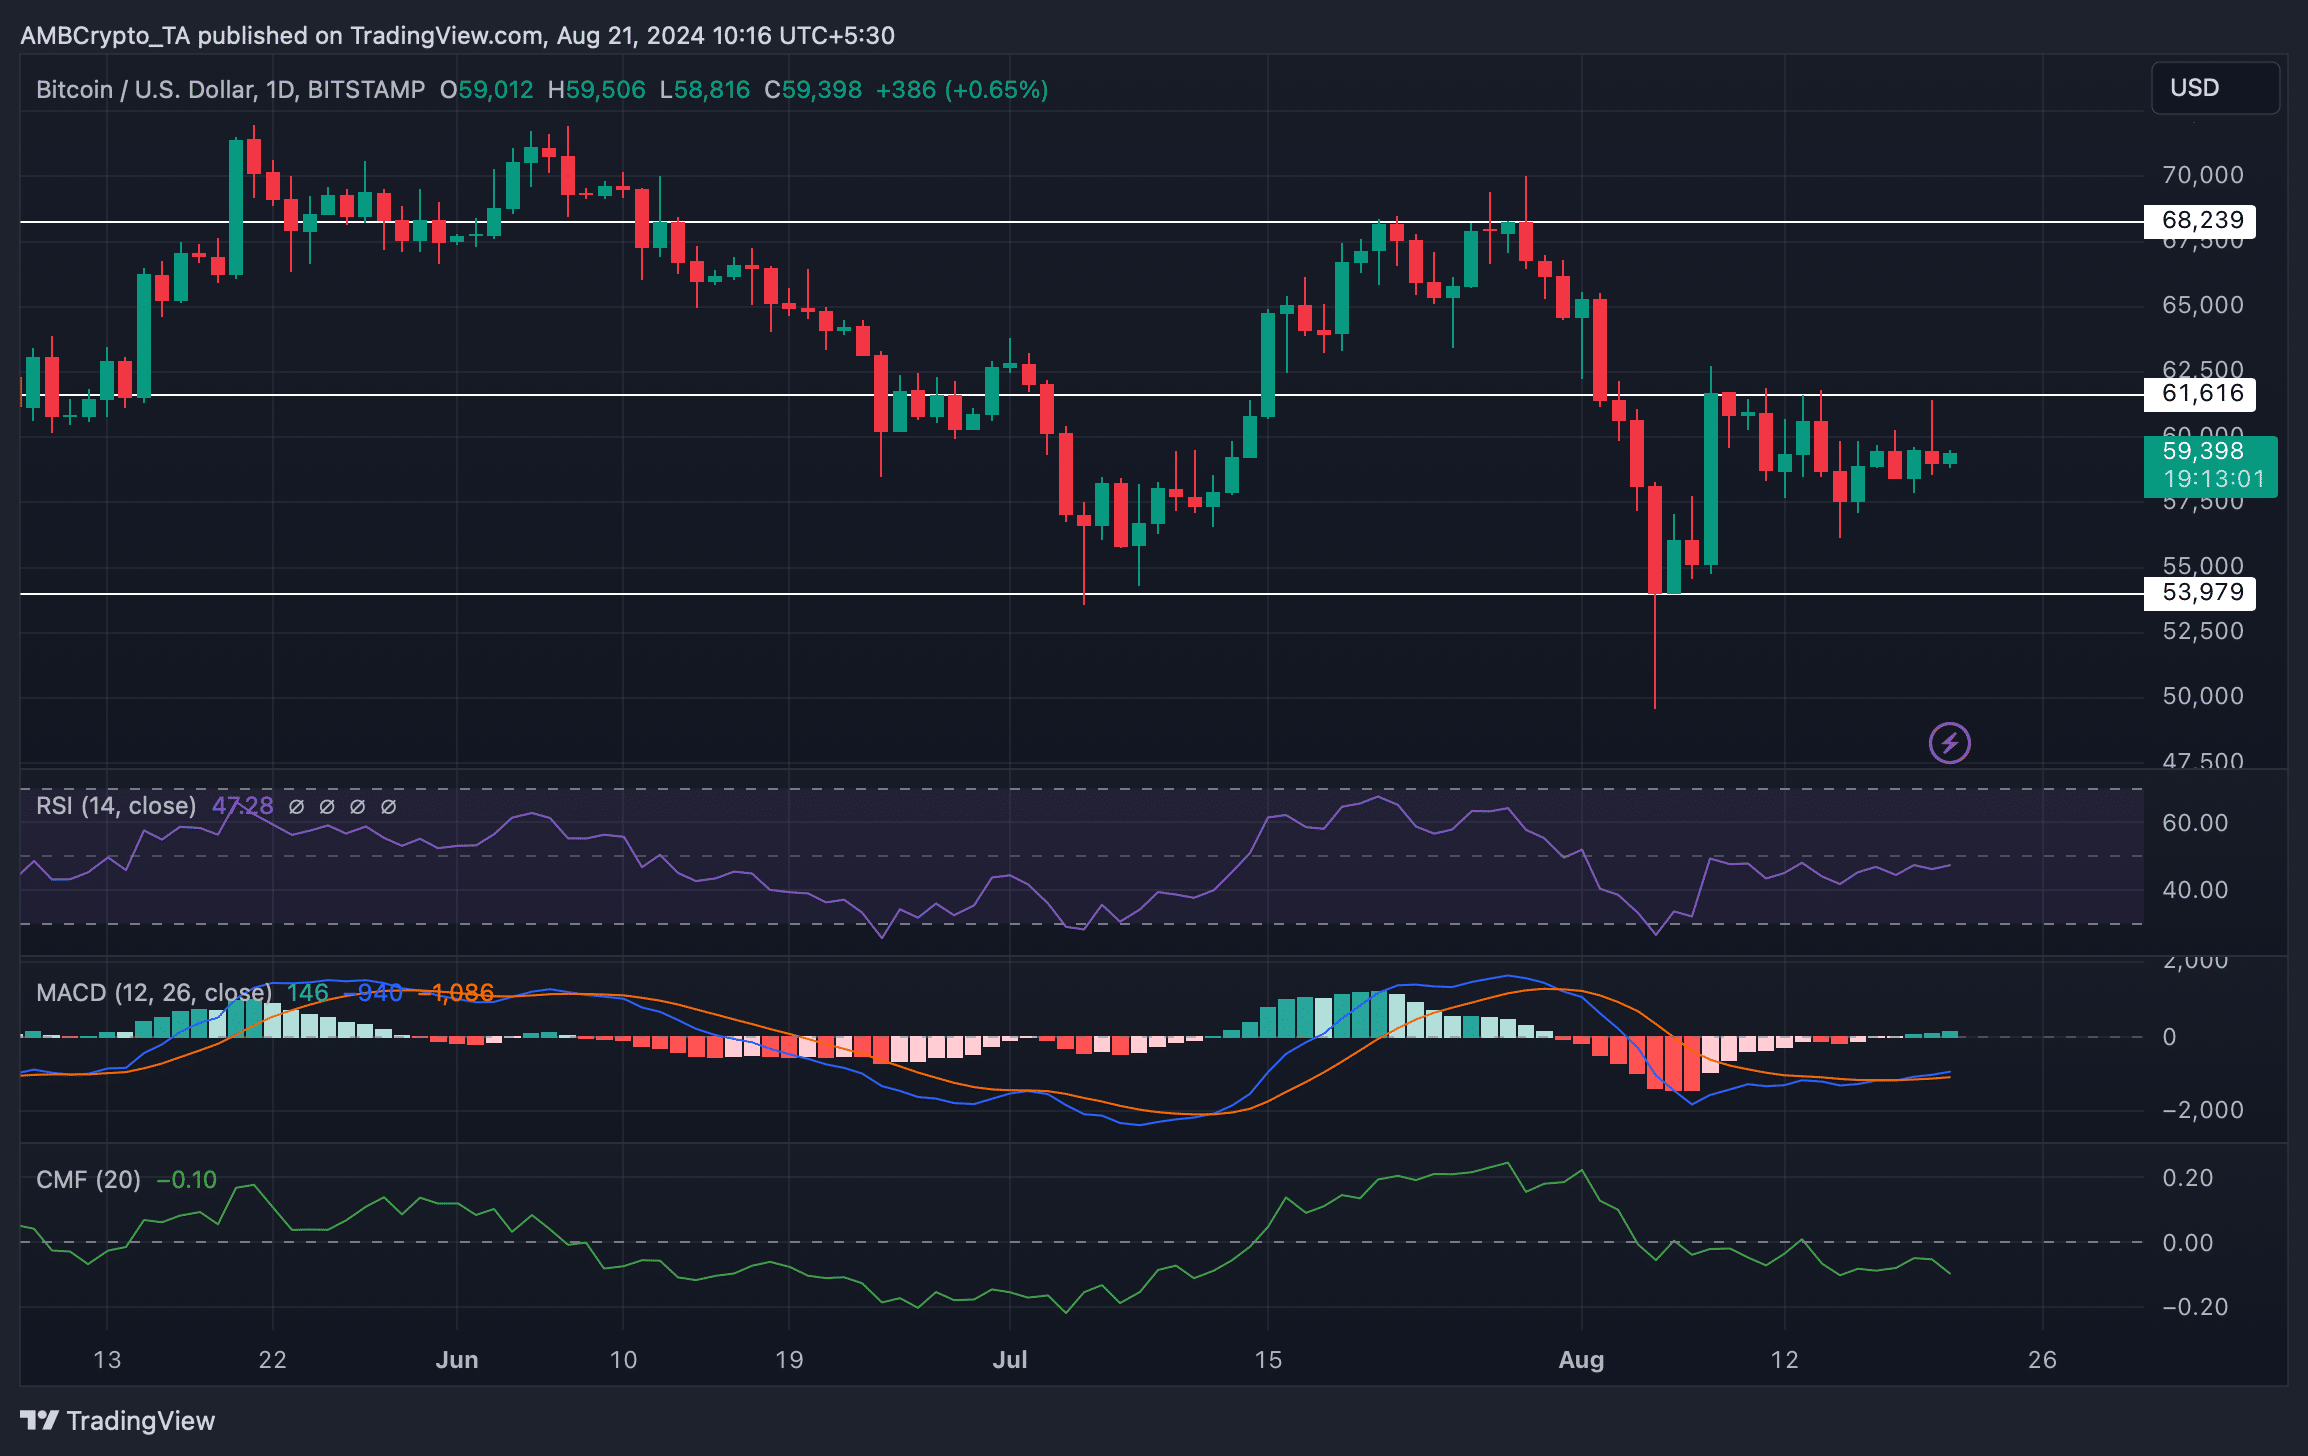
Source: TradingView