Bitcoin falls below $80k: Consolidation or drop, what’s next?
The liquidation heatmap suggested that consolidation could occur over the next week or two.

- Bitcoin found some support at the $74.5k level.
- The price action in late March could repeat itself, based on clues from the liquidation heatmap.
Bitcoin [BTC] fell below the $80k mark on the 6th of April and reached $74.5k on the 7th of April, a date that sent shockwaves across the global markets.
The leading crypto can not be called resilient at a time like this — it might already be in a bear market.
Michael Saylor’s Strategy remained on the sidelines during the recent major dip, making headlines once again but this time for a lack of activity in the market.
Bitcoin could consolidate for some time

The bearish market structure was reinforced when the recent lower low at $78.6k was breached on the 7th of April. The price has not formed a bottom and bounced, so a new swing low was not yet set.
The RSI on the daily chart was falling lower to show growing bearish momentum. Yet, although trading volume has ticked higher over the past ten days, the OBV remained without a trend during this period.
This showed that the OBV did not indicate overwhelming selling pressure, the likes of which we saw toward the end of February.
This was only a faint glimmer of hope. The 61.8% Fibonacci retracement level at the $74.4k region was about to be tested as support once more. It was unclear if BTC bulls could defend this level.

Zooming into the 4-hour chart, we found that there was some space for hope. The $75.1k and the $80k levels appeared to form a short-term range for Bitcoin.
Both the OBV and the RSI have made higher lows during the recent retest of the range’s low.
This exaggerated bullish divergence revealed the potential for some bullish momentum in the short term. However, it was not strong enough to reverse the downtrend or the recent losses.
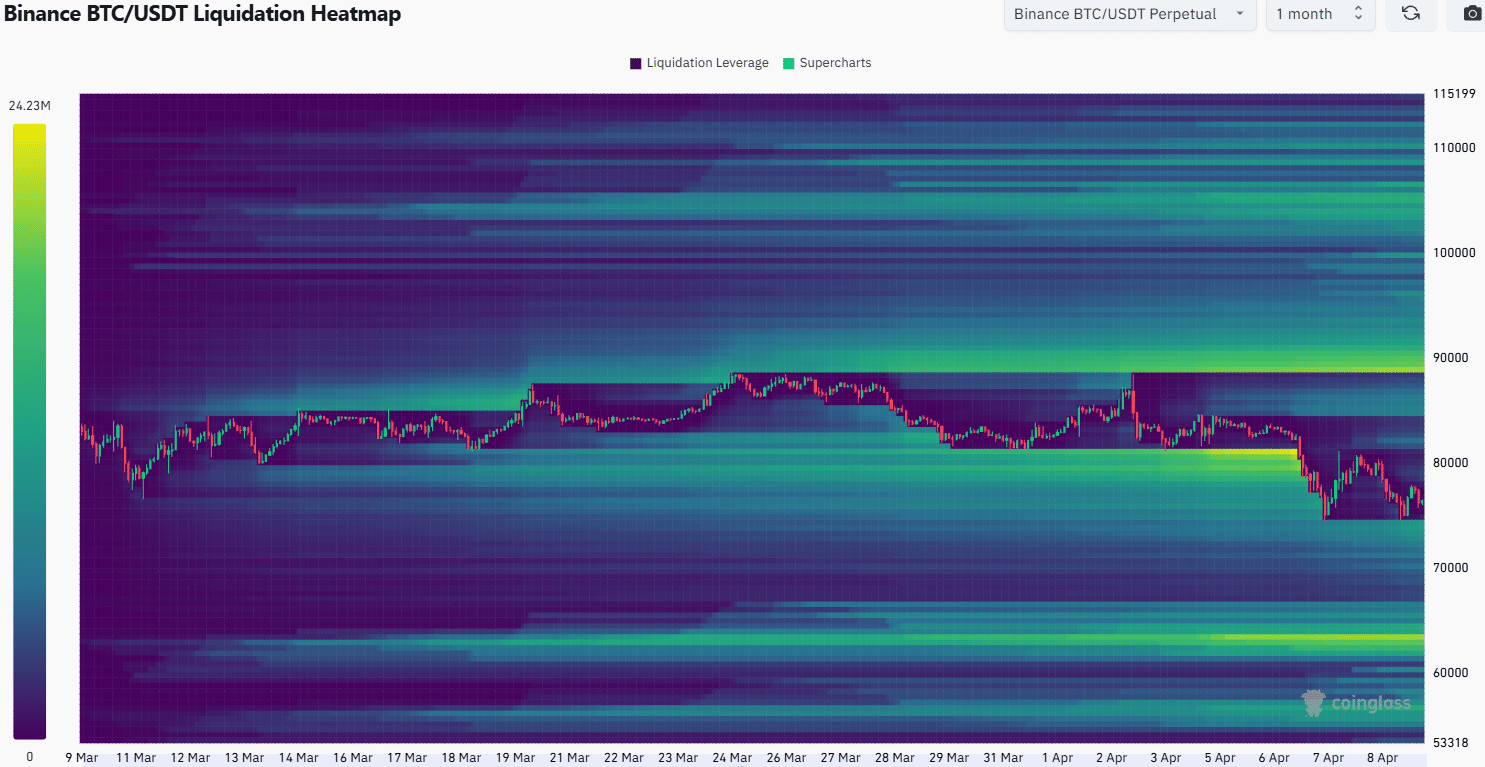
The idea of consolidation came from the 1-month liquidation heatmap. In the second half of March, BTC traded above the $82k short-term support. It allowed time for a build-up of long liquidations around $81.1k.
Similarly, the price of Bitcoin might stabilize above $74.5k. This was to build up long liquidations to the south before hunting them down.
Traders should be prepared for BTC to dive below $74.5k, since uncertainty was rising each day.
Disclaimer: The information presented does not constitute financial, investment, trading, or other types of advice and is solely the writer’s opinion