Bitcoin Fear and Greed Index fuels fears of BTC’s price drop
Contrary to popular belief, rising fear may make the $60K - $61K range resistance, not support.

- Bitcoin grips moderate fear; if it persists, short-term holders may sell to break even.
- Their exit could signal a price bottom.
Bitcoin [BTC] bulls have prevailed after what seems to be the longest consolidation in history, pushing BTC above $60K. However, the momentum was brief, with BTC retracing below support and trading at $59.8K at press time.
Consequently, the market sentiment has shifted back to fear, as bulls and bears battle for control of key support levels.
Bitcoin Fear and Greed shows high fear
Historically, an index below 20 signified extreme fear, often aligning with price bottoms. During these periods, new investors flood the market seeking cheap BTC, while short-term holders exit to break even.
Currently, the Bitcoin market is experiencing moderate fear, making investors more cautious. If this trend holds, it could increase the likelihood of a price bottom.
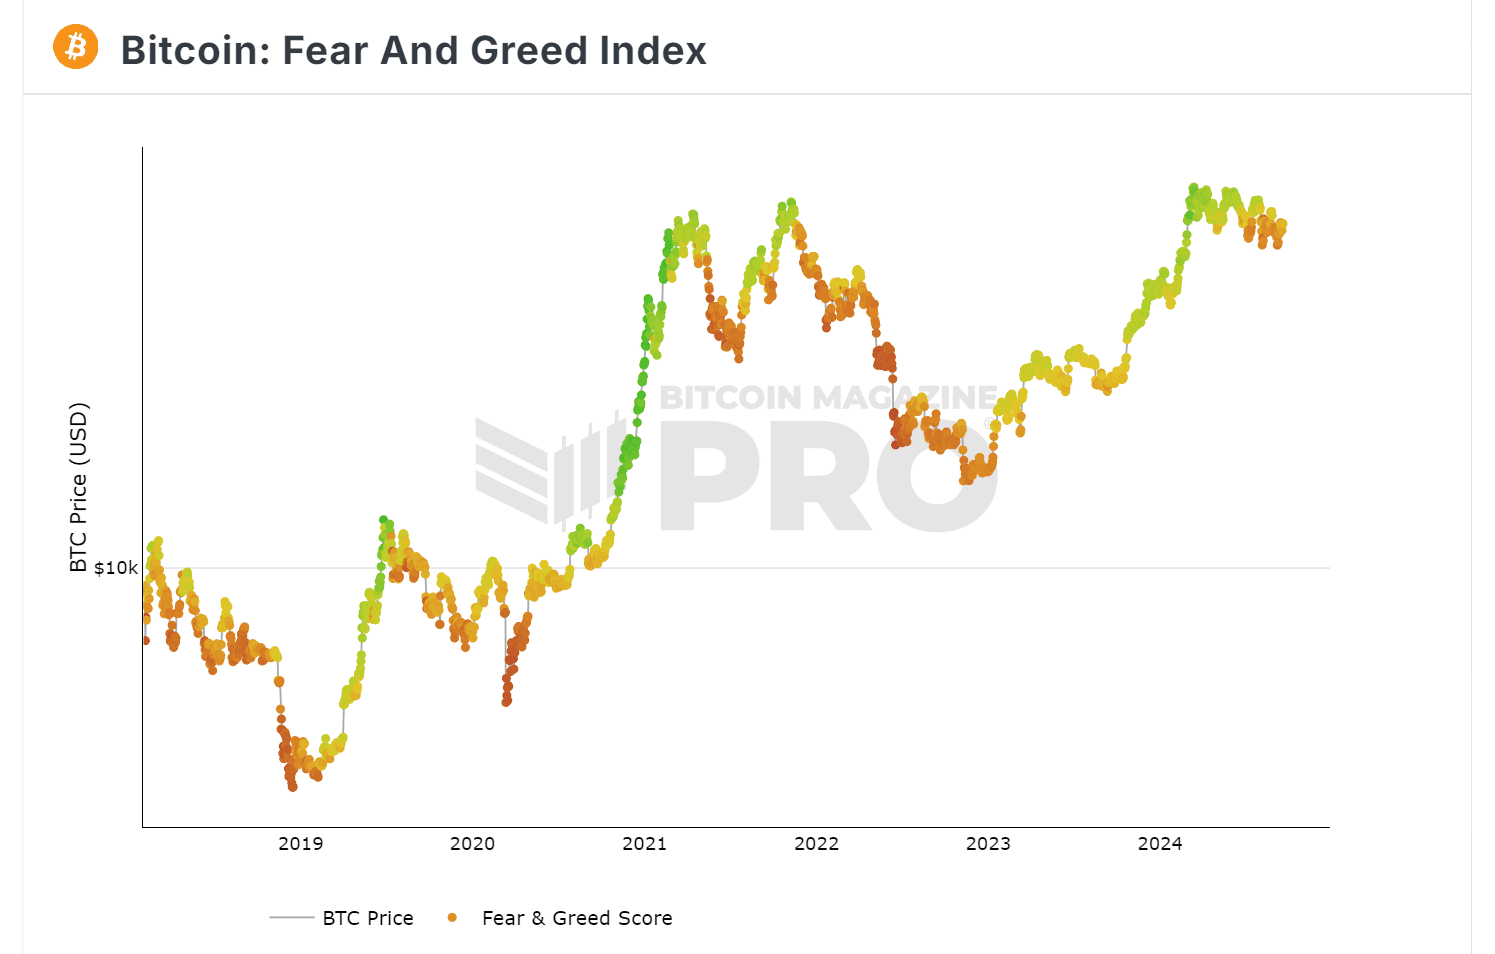
Put simply, if fear persists, short-term holders might sell, pushing prices down. Only once a price bottom is reached, a rebound could attract investors to buy the dip.
Therefore, monitoring STH activity could provide insights. If fear leads to panic selling, Bitcoin might head toward a price bottom.
STH exit poses a real threat
According to AMBCrypto’s analysis of the chart below, a spike in the negative net position of STH often signals a market top, followed by a bearish pullback.
In short, STH exits typically occur when BTC hits key resistance, with the subsequent decline reflecting their strategy to exit before prices fall.
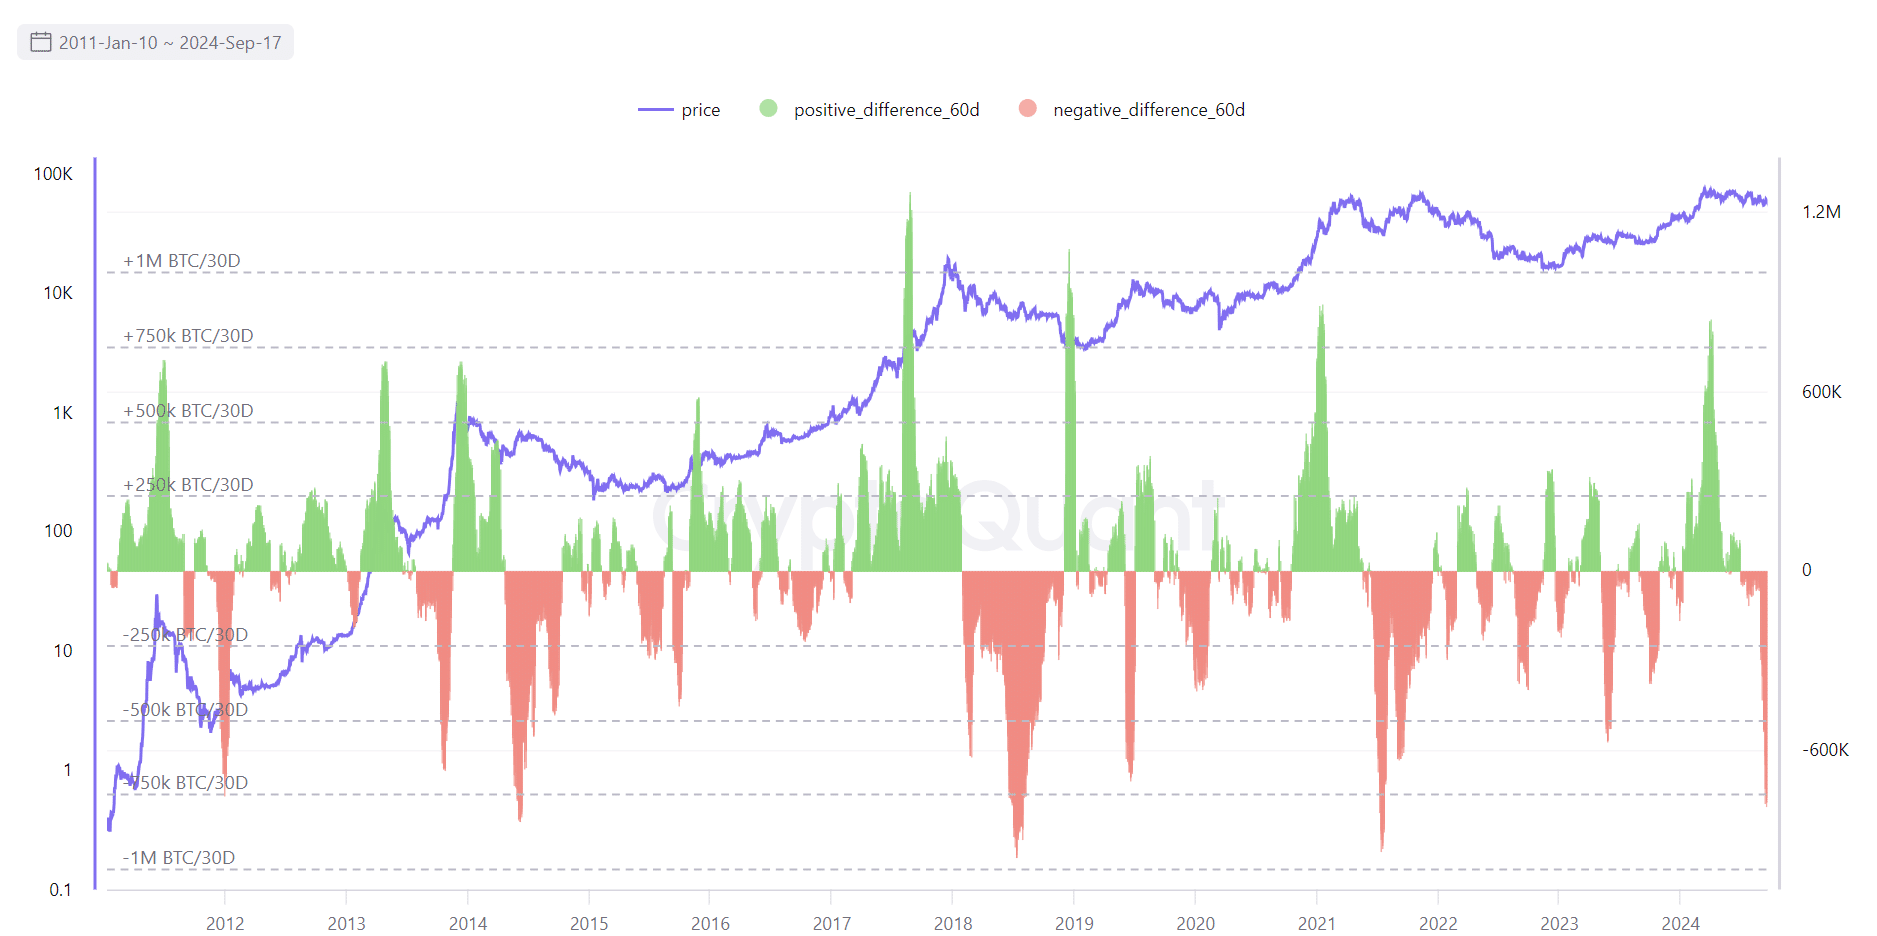
Contrary to popular belief, if this trend holds, the $60K — $61K range might act as resistance rather than support.
Therefore, if bulls fail to maintain control, BTC might retrace to the $51K support before a potential correction.
To confirm this trend, AMBCrypto examined long-term holders. If $60K becomes the next bottom, it could present a buy-the-dip opportunity.
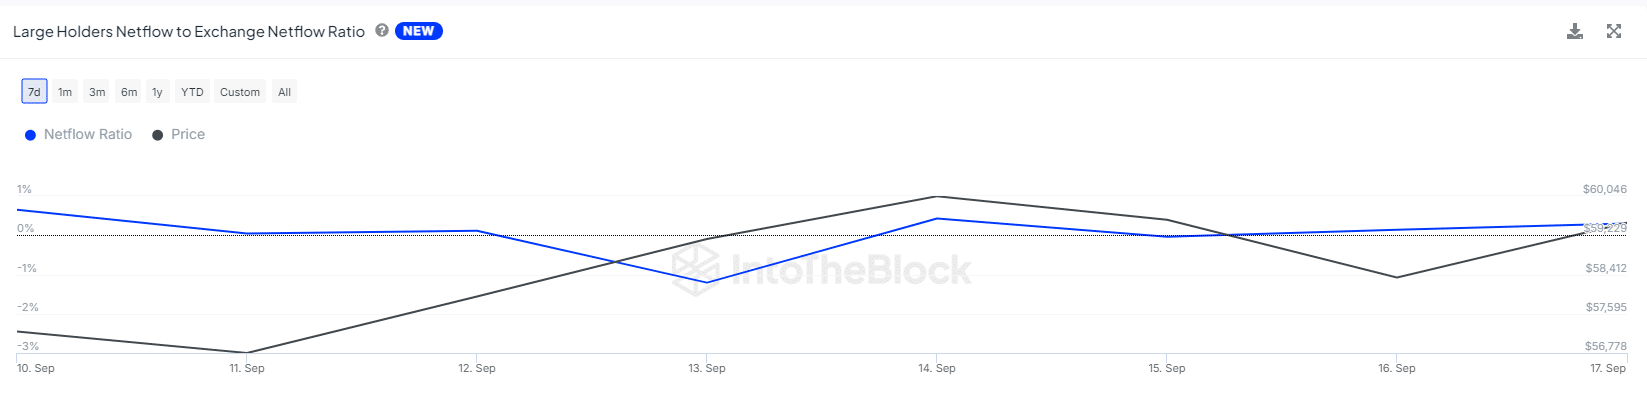
Large cohorts hold the key to the top
While short-term holders adjust their positions as BTC hits crucial resistance, long-term holders have been actively divesting to maintain the $60K level as the next support zone.
The netflow ratio, now at 0.30%, has doubled from the previous day, indicating increasing support from large hodlers, as evidenced by this post.
Read Bitcoin’s [BTC] Price Prediction 2024-25
$60K represents a key battle zone, with short-term holders viewing it as a potential market bottom, reinforced by growing fear.
The reversal of $60K into solid support hinges on long-term holders, whose actions could challenge the price bottom thesis.


