
‘Risks to inflation are tilted to the upside’: Can Bitcoin ride this to $120K?
Bitcoin

Bitcoin Fear and Greed Index urges caution – What should investors do next?
Posted:
Journalist

- The Bitcoin Rainbow Chart showed that investors could scoop up more BTC on the cheap.
- A deeper look at the sentiment showed that investors might want to wait.
Bitcoin [BTC] has shed 6.5% since the 28th of March. Short-term BTC holders were selling at a loss, and the annualized Sharpe ratio showed that BTC risk-adjusted returns were decreasing.
Combined with the news of the U.S. tariffs starting on the 2nd of April, sentiment across the crypto markets was muted.
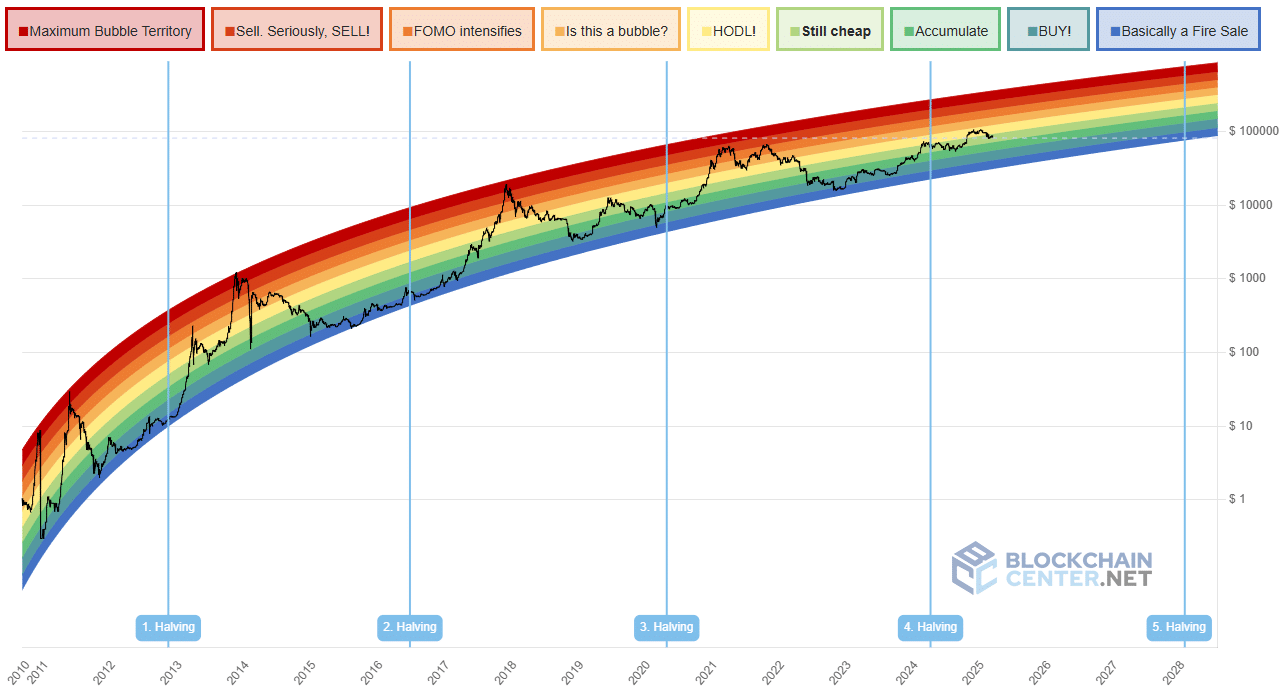
Source: Blockchain Center
The Bitcoin Rainbow Chart chart showed BTC was “still cheap”. This, by itself, should not guide long-term investors’ plans, for the leading crypto was still in a downtrend.
Perhaps the second half of 2025 might be kind to the bulls. Data showed that the coming weeks likely won’t be.
BTC: Fear dominates the markets once again

Source: Alternative.me
The Fear and Greed Index was in fearful territory from late February. It did not cross above the 50 mark in March but was making a series of higher lows.
While technical analysis on the fear index might not be as illuminating as it would be on the price charts, the recent dive below the 30 level suggested worrisome times for investors, as it marked a new low since mid-March.
The plunge in market sentiment came as the wider stock market also braced for a hit. The fearful sentiment would likely spur greater selling pressure, driving prices lower.
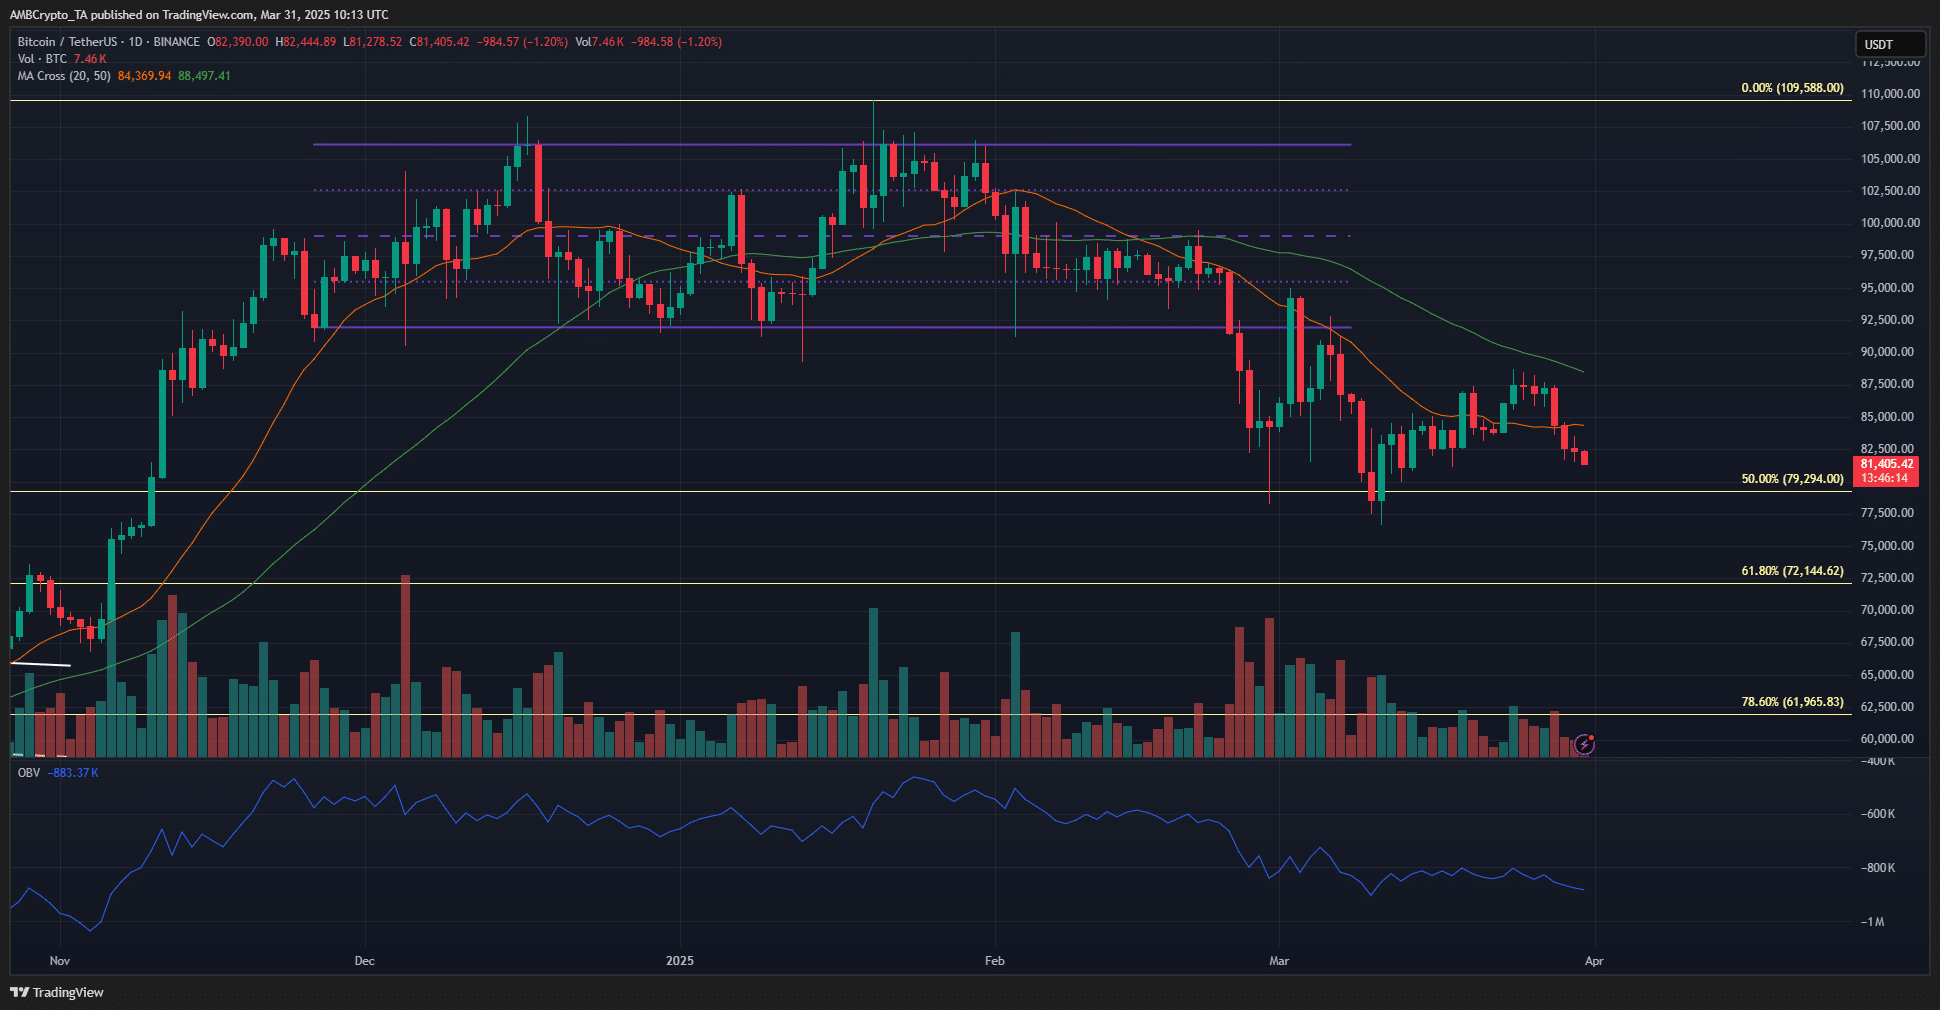
Source: BTC/USDT on TradingView
The 1-day BTC chart indicates a strongly bearish outlook in the short term. The 20DMA and 50DMA confirm the ongoing downtrend, as Bitcoin has yet to establish a new higher high above $90k, maintaining its bearish structure. Additionally, it has dropped below the $82.5k local support zone.
Since February, the OBV has been trending downward. Although it stabilized in the latter half of March, reflecting a balance of power between buyers and sellers, this only offered a slim chance of bullish recovery.
Recent selling pressure has erased that hope, and the OBV is likely to hit a new low in the coming days. If this happens, Bitcoin investors should prepare for a potential price drop below $78k.
While the Rainbow Chart recommends buying, current market sentiment and price trends suggest patience might yield better results. The downtrend persists, and until it reverses, bullish investors may need to wait for more favorable conditions.
Disclaimer: The information presented does not constitute financial, investment, trading, or other types of advice and is solely the writer’s opinion


