Bitcoin flashes 2024-like accumulation pattern – Analysts say $100K breakout could be next
Why Bitcoin’s path to $100K could be strengthened by accumulation and liquidity rebound

- BTC formed an interesting accumulation pattern seen before 2024 rallies.
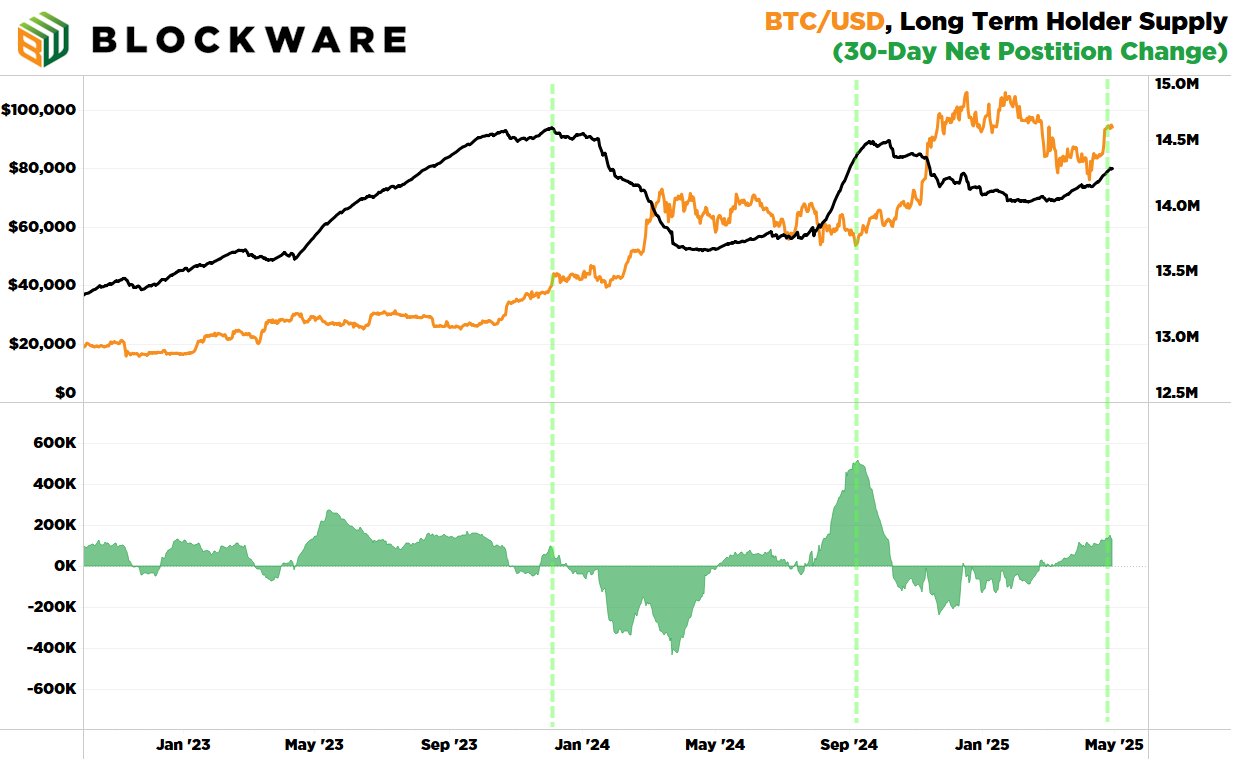
- Long-term holders scooped 150K BTC in April, while U.S. dollar liquidity recovered.
Bitcoin [BTC] has flirted with the $97K level for the first time since February, bringing it only 3.5% away from the $100K mark. Interestingly, more on-chain metrics suggested that $100K was within reach.
In particular, CryptoQuant highlighted that the short-term holders’ (1 day to 1 week) accumulation trend in Q2 2025 mirrored patterns that triggered price rallies in early and late 2024.

The chart showed that whenever short-term holder accumulation made a higher high, it was followed by a BTC price surge in Q1 and Q4 2024. Per CryptoQuant,
“If this trend continues in the short term, Bitcoin may be on track to break above $100K and enter a strong upward phase.”
Bitcoin’s bullish cues
Bitcoin mining system provider, Blockware, shared a similar bullish outlook. The firm noted that long-term holder supply was rising.
This meant the major selling pressure from profitable long-term holders (held BTC for over 6 months) was easing. In fact, BTC analyst Robert Breedlove said,
“Over the past 30 days long-term holders have acquired ~150,000 more BTC. Bitcoin is running out of sellers in the $80k to $100k range.”
But perhaps the most crucial demand factor was the rebound in U.S. dollar liquidity. The Blockware chart showed a positive correlation between BTC and U.S. liquidity.
For example, the massive spike in U.S. dollar liquidity in 2020-2021 led to the massive BTC rally to $69K from $3.5K.
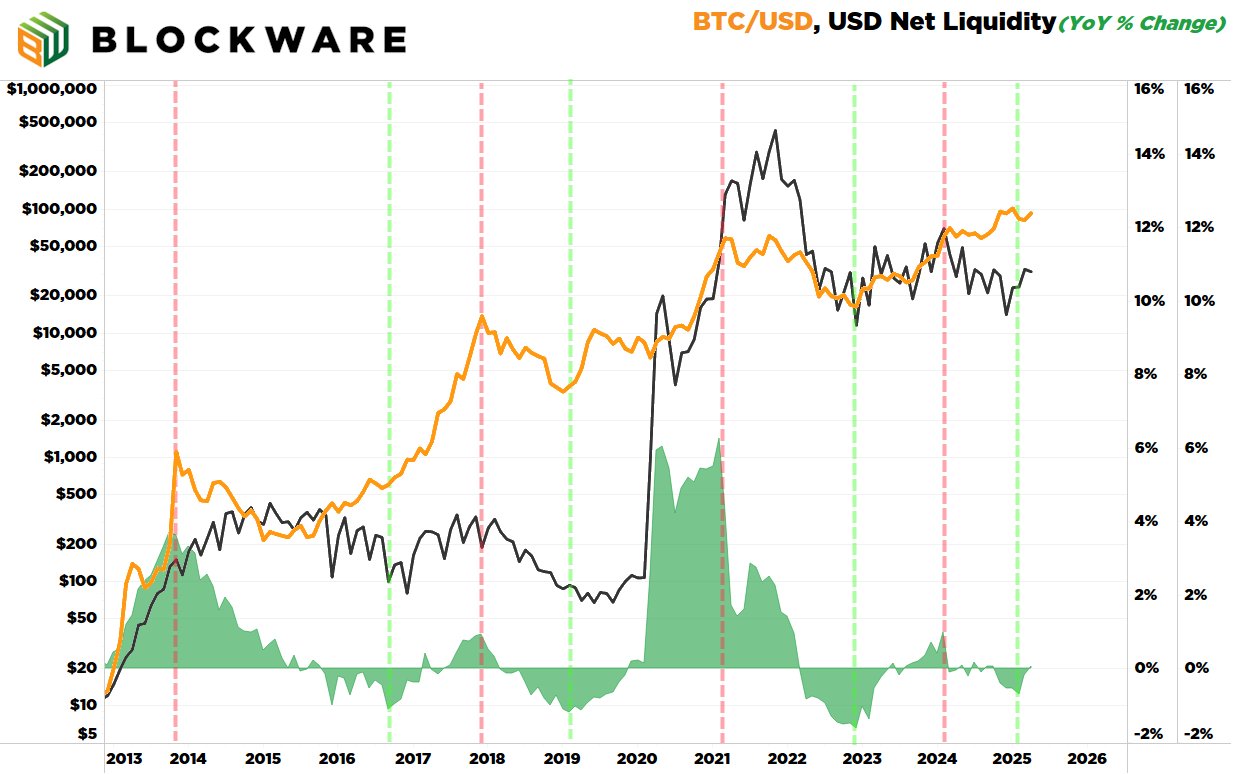
The liquidity contracted in late 2024 and early 2025, but appeared to rebound in Q2 2025. If the liquidity trend continues, it could increase BTC bids and fuel further upward momentum.
On the price chart, the 4-hour Super Trend indicator was in ‘buy’ mode at the time of writing. Besides, price action was above key moving averages, suggesting that bulls had the market edge.

Taken together, on-chain and technical indicators leaned on the bulls’ side, and an extra rally to $100K could be likely in the short term.