Bitcoin: Here’s how long you should wait for BTC’s rally to $71K

- BTC’s price moved marginally in the last 24 hours.
- Metrics and indicators suggested that BTC might turn volatile in the next seven days.
Several investors speculated a fresh bull rally for Bitcoin [BTC] as its price gained upward momentum on the 3rd of May.
However, the growth dropped as the king of cryptos’ price only moved marginally in the last 24 hours. Does this hint at yet another price correction?
Is Bitcoin actually bullish?
Moustache, a popular crypto analyst, recently posted a tweet highlighting a few developments that hinted towards a bull rally.
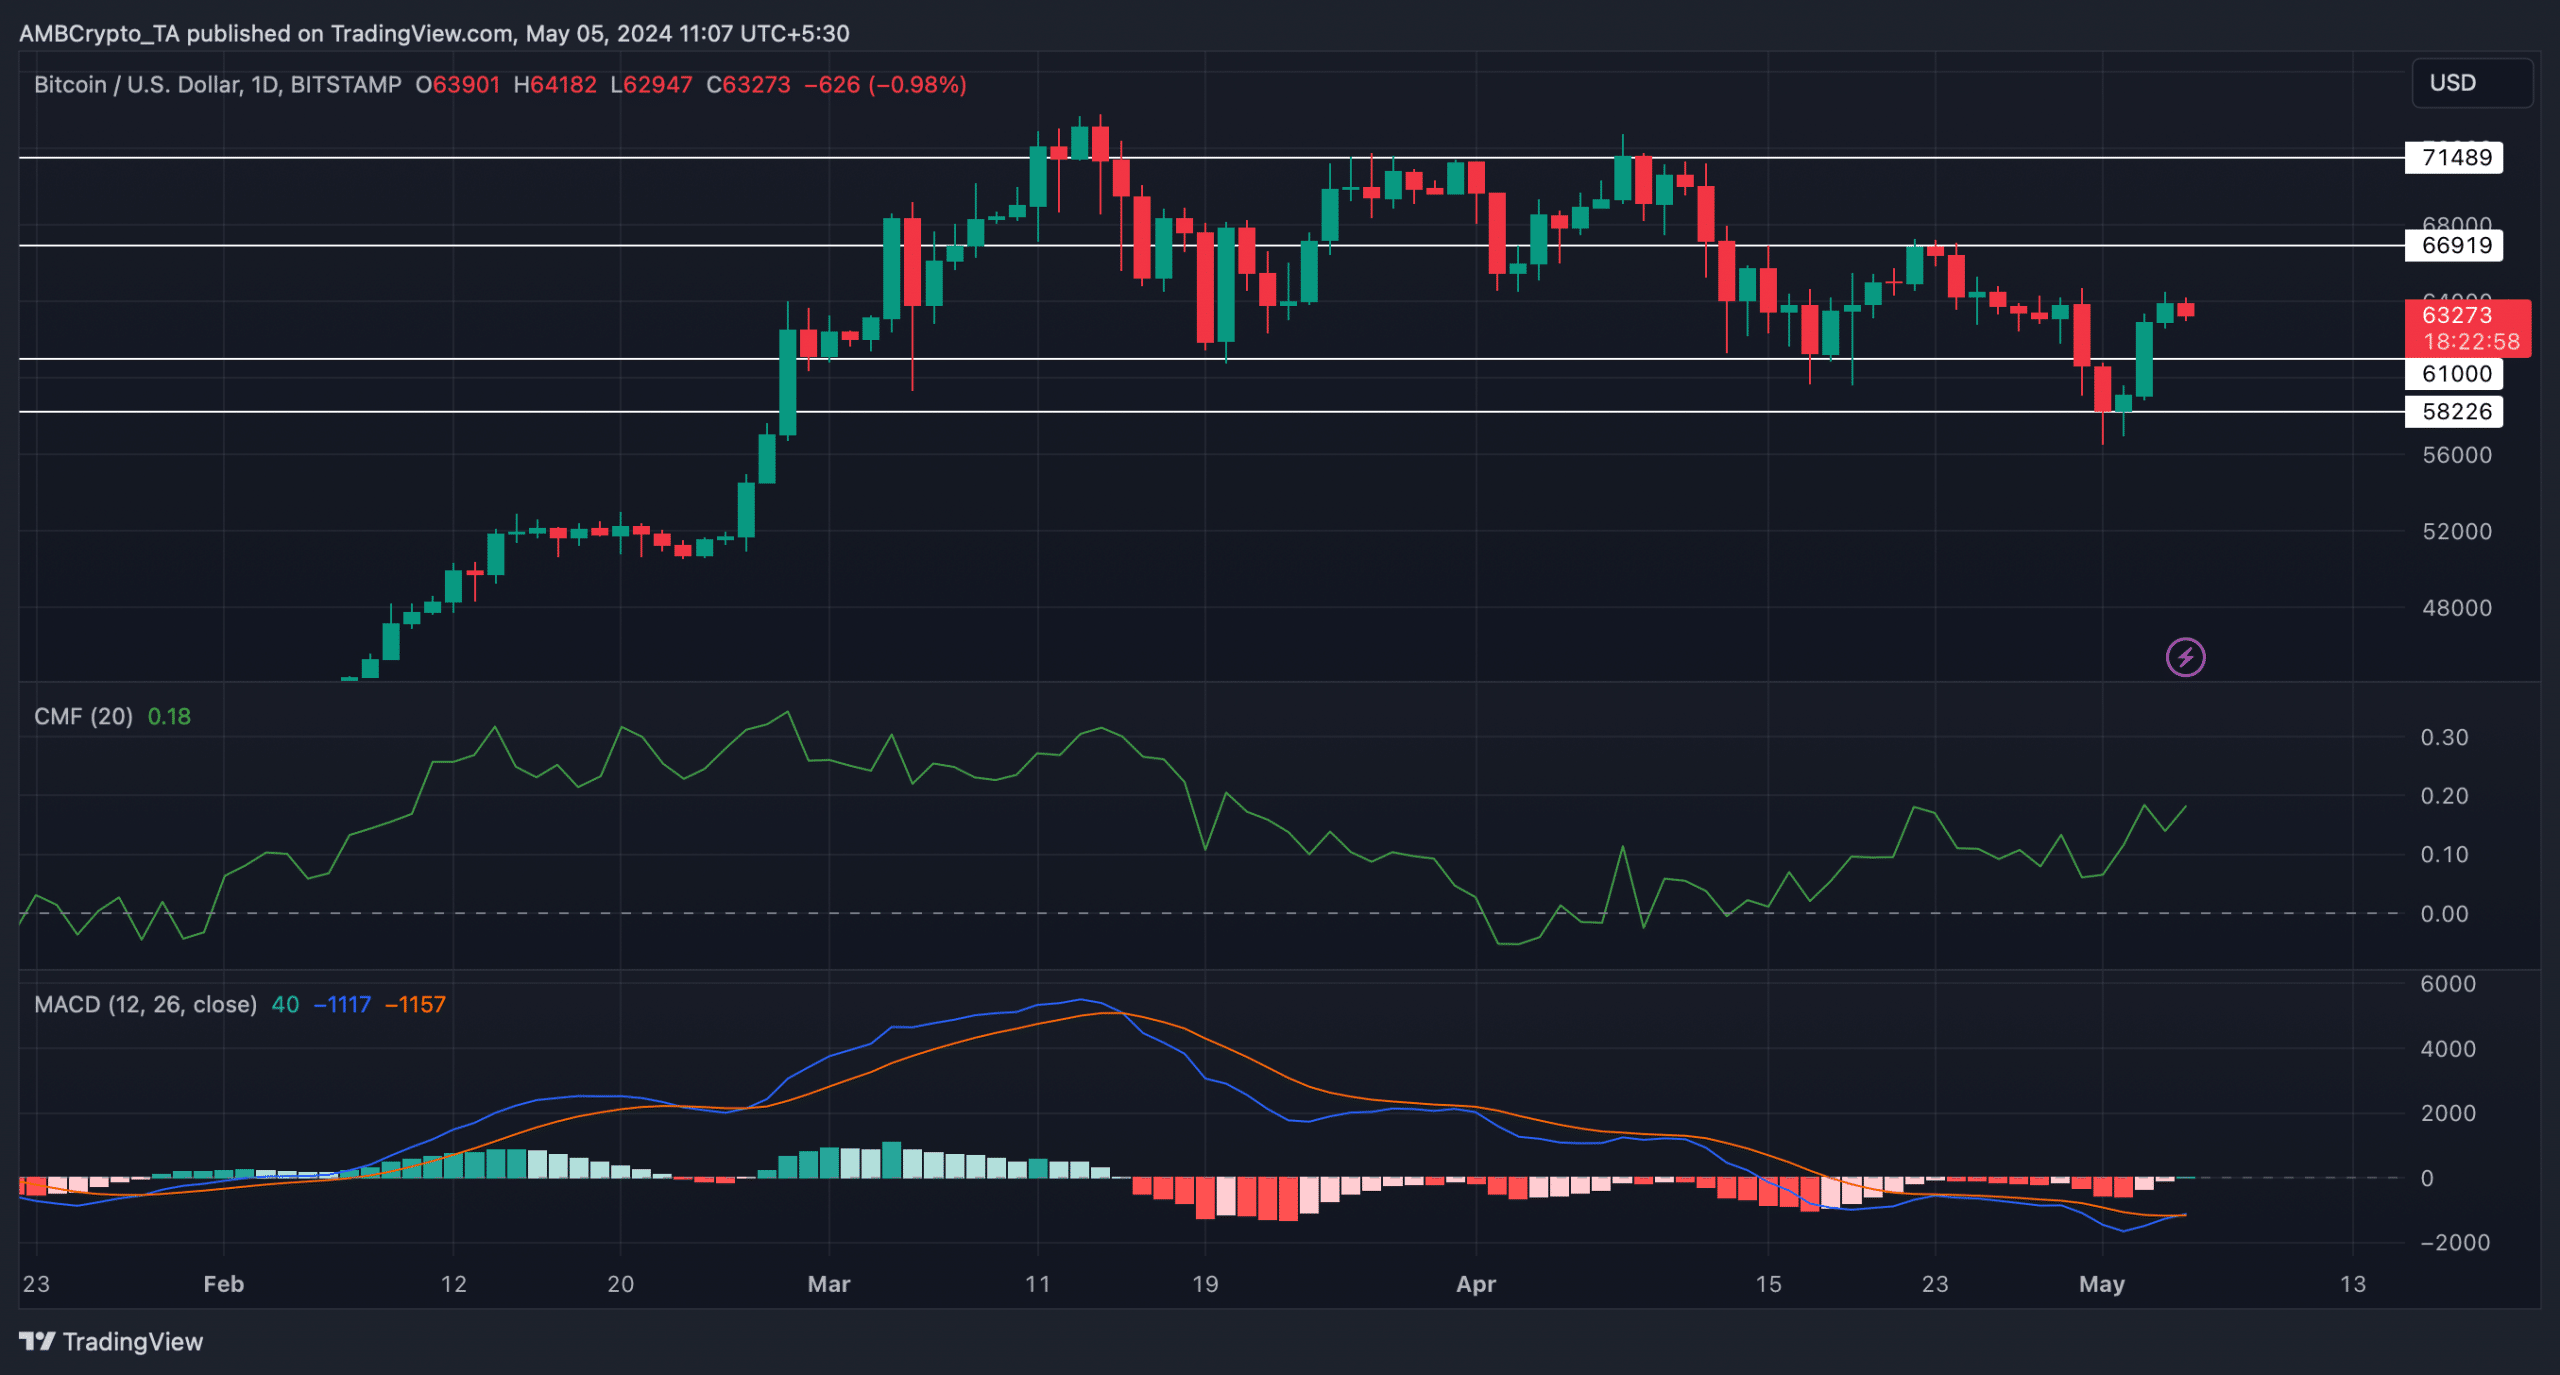
For the uninitiated, BTC’s price plummeted under $61k on the 30th of April. However, the king coin managed to come back above that mark, turning it into a support and hinting at a further price uptick.
The tweet highlighted that BTC bounded up after touching a key trendline. Historically, whenever BTC’s price rebounded after touching the trendline, its price has risen sharply.
Additionally, the Relative Strength Index (RSI) broke above a falling wedge pattern. This indicated that the RSI would increase, which supported the possibility of BTC’s bull run.
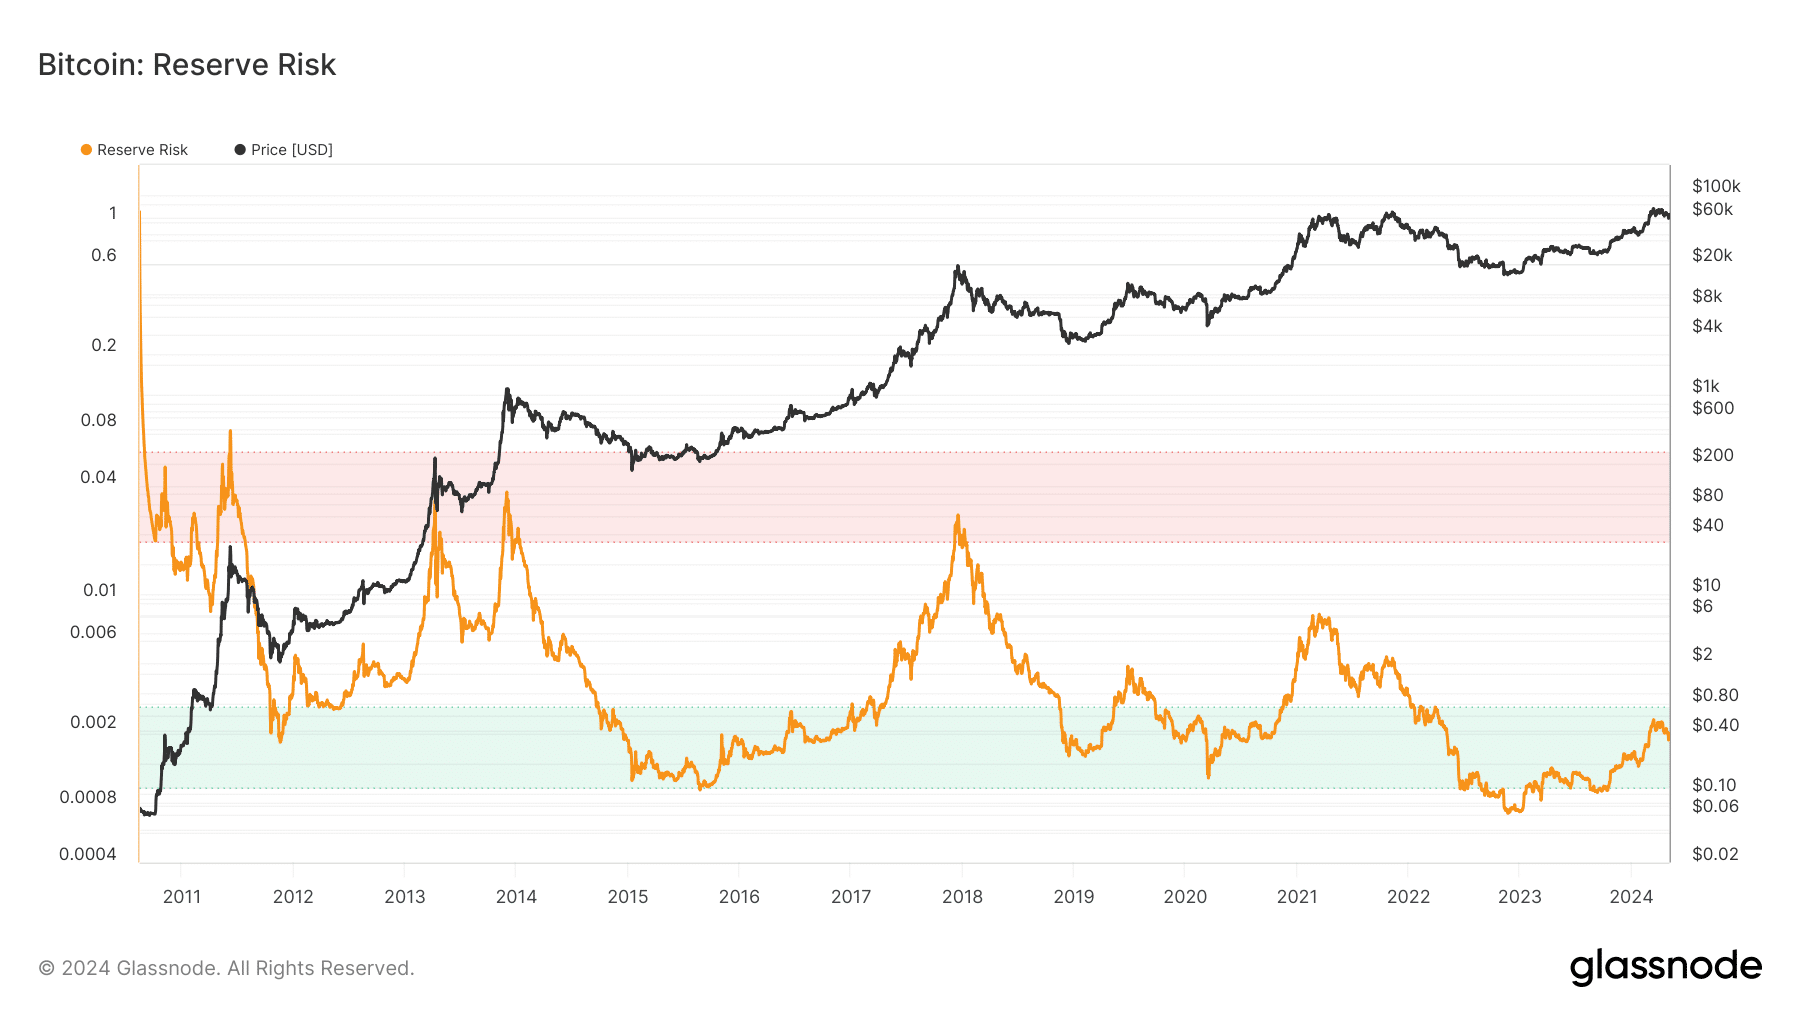
AMBCrypto’s look at Glassnode’s data revealed yet another bullish signal. We found that Bitcoin’s reserve risk gained upward momentum inside the green zone.
Each time this happened in the past, BTC’s price gained bullish momentum.
What to expect from BTC
Though these aforementioned metrics looked bullish, BTC’s price action didn’t correspond. As per CoinMarketCap, BTC’s price only moved marginally in the last 24 hours.
At the time of writing, the coin was trading at $63,368.70 with a market capitalization of over $1.25 trillion.
However, investors mustn’t lose hope yet, as a few metrics hint at an increase in BTC’s volatility.
AMBCrypto’s analysis of CryptoQuant’s data revealed that BTC’s net deposit on exchanges was low compared to the last seven days’ average, suggesting low selling pressure.
The coin’s Coinbase premium was also green, meaning that buying sentiment was dominant among U.S. investors.
A few of the market indicators also suggested that BTC could turn volatile in a northward direction in the next seven days.
Notably, the coin’s Chaikin Money Flow (CMF) registered a sharp uptick. Its MACD displayed the possibility of a bullish crossover.
Is your portfolio green? Check out the BTC Profit Calculator
If BTC manages to turn volatile next week, then it will be crucial for the coin to go above the $66.9k resistance level. A successful breakout above that level could allow BTC to touch $71k.
If everything remains bullish, then BTC can even cross its all-time high in coming days.


![Ethereum's [ETH] 11% rebound - Is greed fueling a bottom or is fear driving a trap?](https://ambcrypto.com/wp-content/uploads/2025/04/Ritika-8-400x240.webp)
![Will Chainlink's [LINK] retest flip support into resistance?](https://ambcrypto.com/wp-content/uploads/2025/04/Renuka-57-400x240.webp)
