Bitcoin hints at a “bull trap”, here’s what it means for traders
The higher timeframe charts of Bitcoin exhibited bearish momentum in recent weeks, and the failure to break above $28k last week meant the bears remained in control.

Disclaimer: The information presented does not constitute financial, investment, trading, or other types of advice and is solely the writer’s opinion.
- The short-term range presented important levels for traders to watch out for.
- The buyers were not yet in control of Bitcoin’s trend, and this might not change next week.
Bitcoin saw a false breakout past a short-term range following last weekend’s positive developments regarding the U.S. debt ceiling talks. The past week of trading saw Bitcoin fall back within said range.
Traditional markets have outperformed Bitcoin and Ethereum, especially over the past week. Meanwhile, the higher timeframes showed BTC in the grip of bearish momentum. Traders could look to profit from a drop in prices next week.
The bulls have already been trapped once- will this pattern repeat?
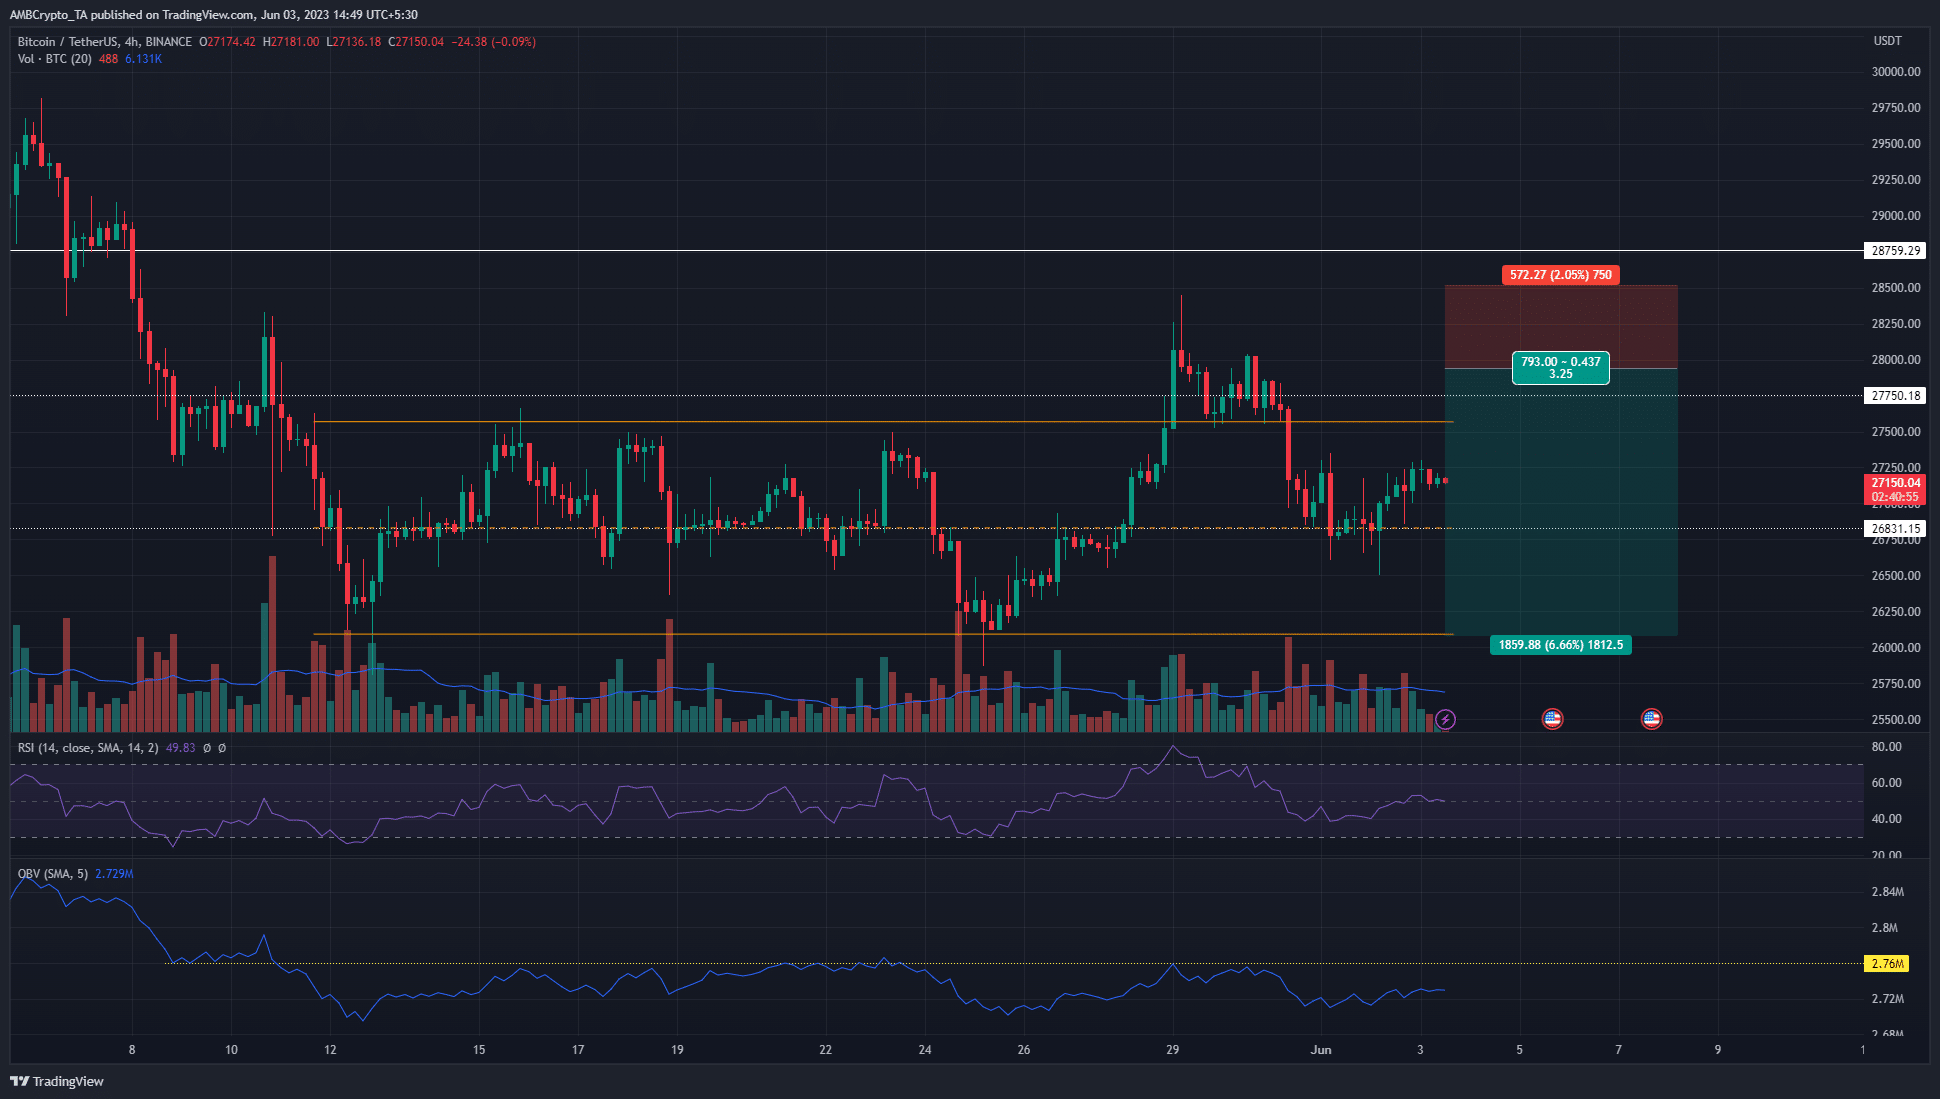
The range (orange) extended from $26.1k to $27.5k. Over the past few days, BTC managed to bounce from mid-point support at $26.8k. The 4-hour market structure was bearish, and the RSI showed momentum was neutral.
The findings from the OBV were more impactful. When Bitcoin surged above $28k, the OBV was unable to breach a resistance level from earlier in May. This suggested that demand was not sufficient to force a breakout.
Bitcoin was forced to reverse thereafter. With the daily timeframe showing momentum was downward, traders can be bearishly biased. Monday could see a liquidity hunt toward $28k or above for BTC.
This would likely be followed by a reversal if the lack of demand continued. Meanwhile, a true breakout was also possible, one that bears should be cautious of. Therefore, the stop-loss can be set near the $28.5k mark, above recent highs.
The rising volume of sellers supported the bearish case
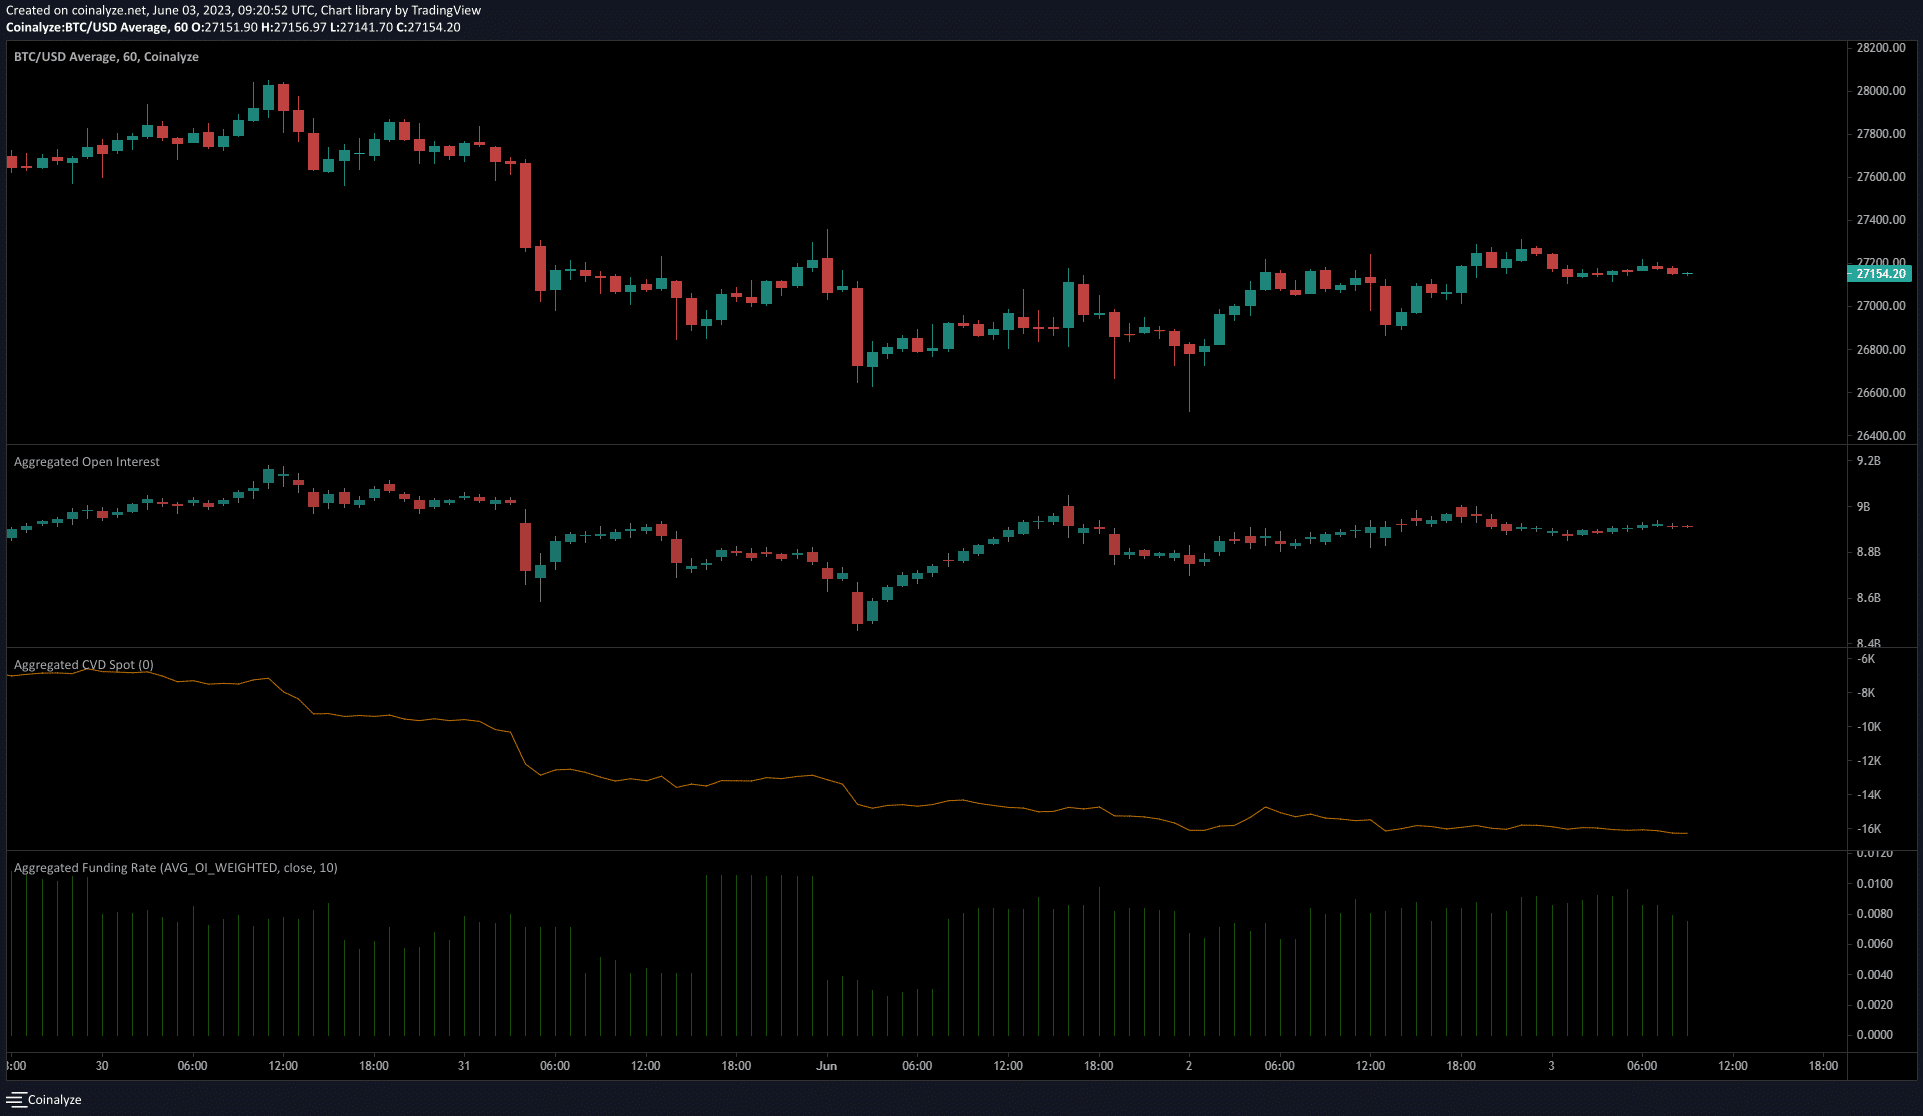
The spot CVD was in a sharp decline toward the end of May. This trend continued over the past few days as well, although its pace slowed down. Overall, it continued to show selling pressure was dominant.
Is your portfolio green? Check the Bitcoin Profit Calculator
The Open Interest was flat over the past two days, and hardly moved in recent hours. This was a sign of sidelined speculators.
They could be enticed into entering long positions on BTC if it breaks $28k. But, if the sellers prevailed thereafter, these late bulls would be a juicy target for the bears.