- Bitcoin remained above a crucial support level at press time.
- Indicators revealed that BTC was trading under its possible market bottom.
Bitcoin [BTC] bulls have taken a backseat over the past few days as the king of cryptos’ volatility dropped. It was interesting to note that while BTC consolidated, it managed to remain above a crucial support level.
This suggested that if things fall in place, then the coin might begin an upward rally in the coming days.
Bitcoin’s crucial support level
As per CoinMarketCap, Bitcoin’s weekly chart remained red, and its price only moved up marginally in the last 24 hours.
At the time of writing, the king of cryptos was trading at $59,443.16 with a market capitalization of over $1.17 trillion.
Meanwhile, Titan of Crypto, a popular crypto analyst, posted a tweet pointing out an interesting development — BTC’s price has been trading just above a critical trendline (red).

Source: X
Notably, BTC hasn’t closed a candle below the red line. Similar episodes happened back in 2021 and 2022. During those events, Bitcoin registered promising bounce backs after touching the same red line.
If history repeats itself, then investors might soon witness BTC gaining bullish momentum.
Will history repeat itself?
AMBCrypto then assessed the coin’s on-chain data to see what they suggested regarding a bounce back.
As per our analysis of CryptoQuant’s data, BTC’s exchange reserve was dropping, indicating a rise in buying pressure.
The king coin’s Miners’ Position Index (MPI) suggested that miners were selling fewer holdings compared to its one-year average.
This meant that miners were confident in BTC and were expecting its price to rise in the coming top.

Source: CryptoQuant
On top of that, BTC’s Binary CDD was also green, meaning that long-term holders’ movement in the last seven days was lower than the average. They have a motive to hold their coins.
Our look at Glassnode’s data revealed yet another bullish indicator. BTC’s Pi Cycle Top indicator pointed out that BTC’s price was resting under its possible market bottom of $63.7k.
This indicated that the chances of BTC reaching that mark were high.
AMBCrypto reported earlier that BTC was also following another historical trend, which might result in a massive bull rally in Q4 2024.

Source: Glassnode
AMBCrypto then took a look at Bitcoin’s daily chart to better understand what to expect in the short-term. Our analysis revealed a bullish symmetrical triangle pattern on BTC’s chart.
The technical indicator MACD displayed a bullish crossover.
Is your portfolio green? Check out the BTC Profit Calculator
The Relative Strength Index (RSI) also registered an uptick, suggesting a successful breakout above the pattern.
However, if BTC fails to close above the aforementioned red line support, then it might plummet to $52k.
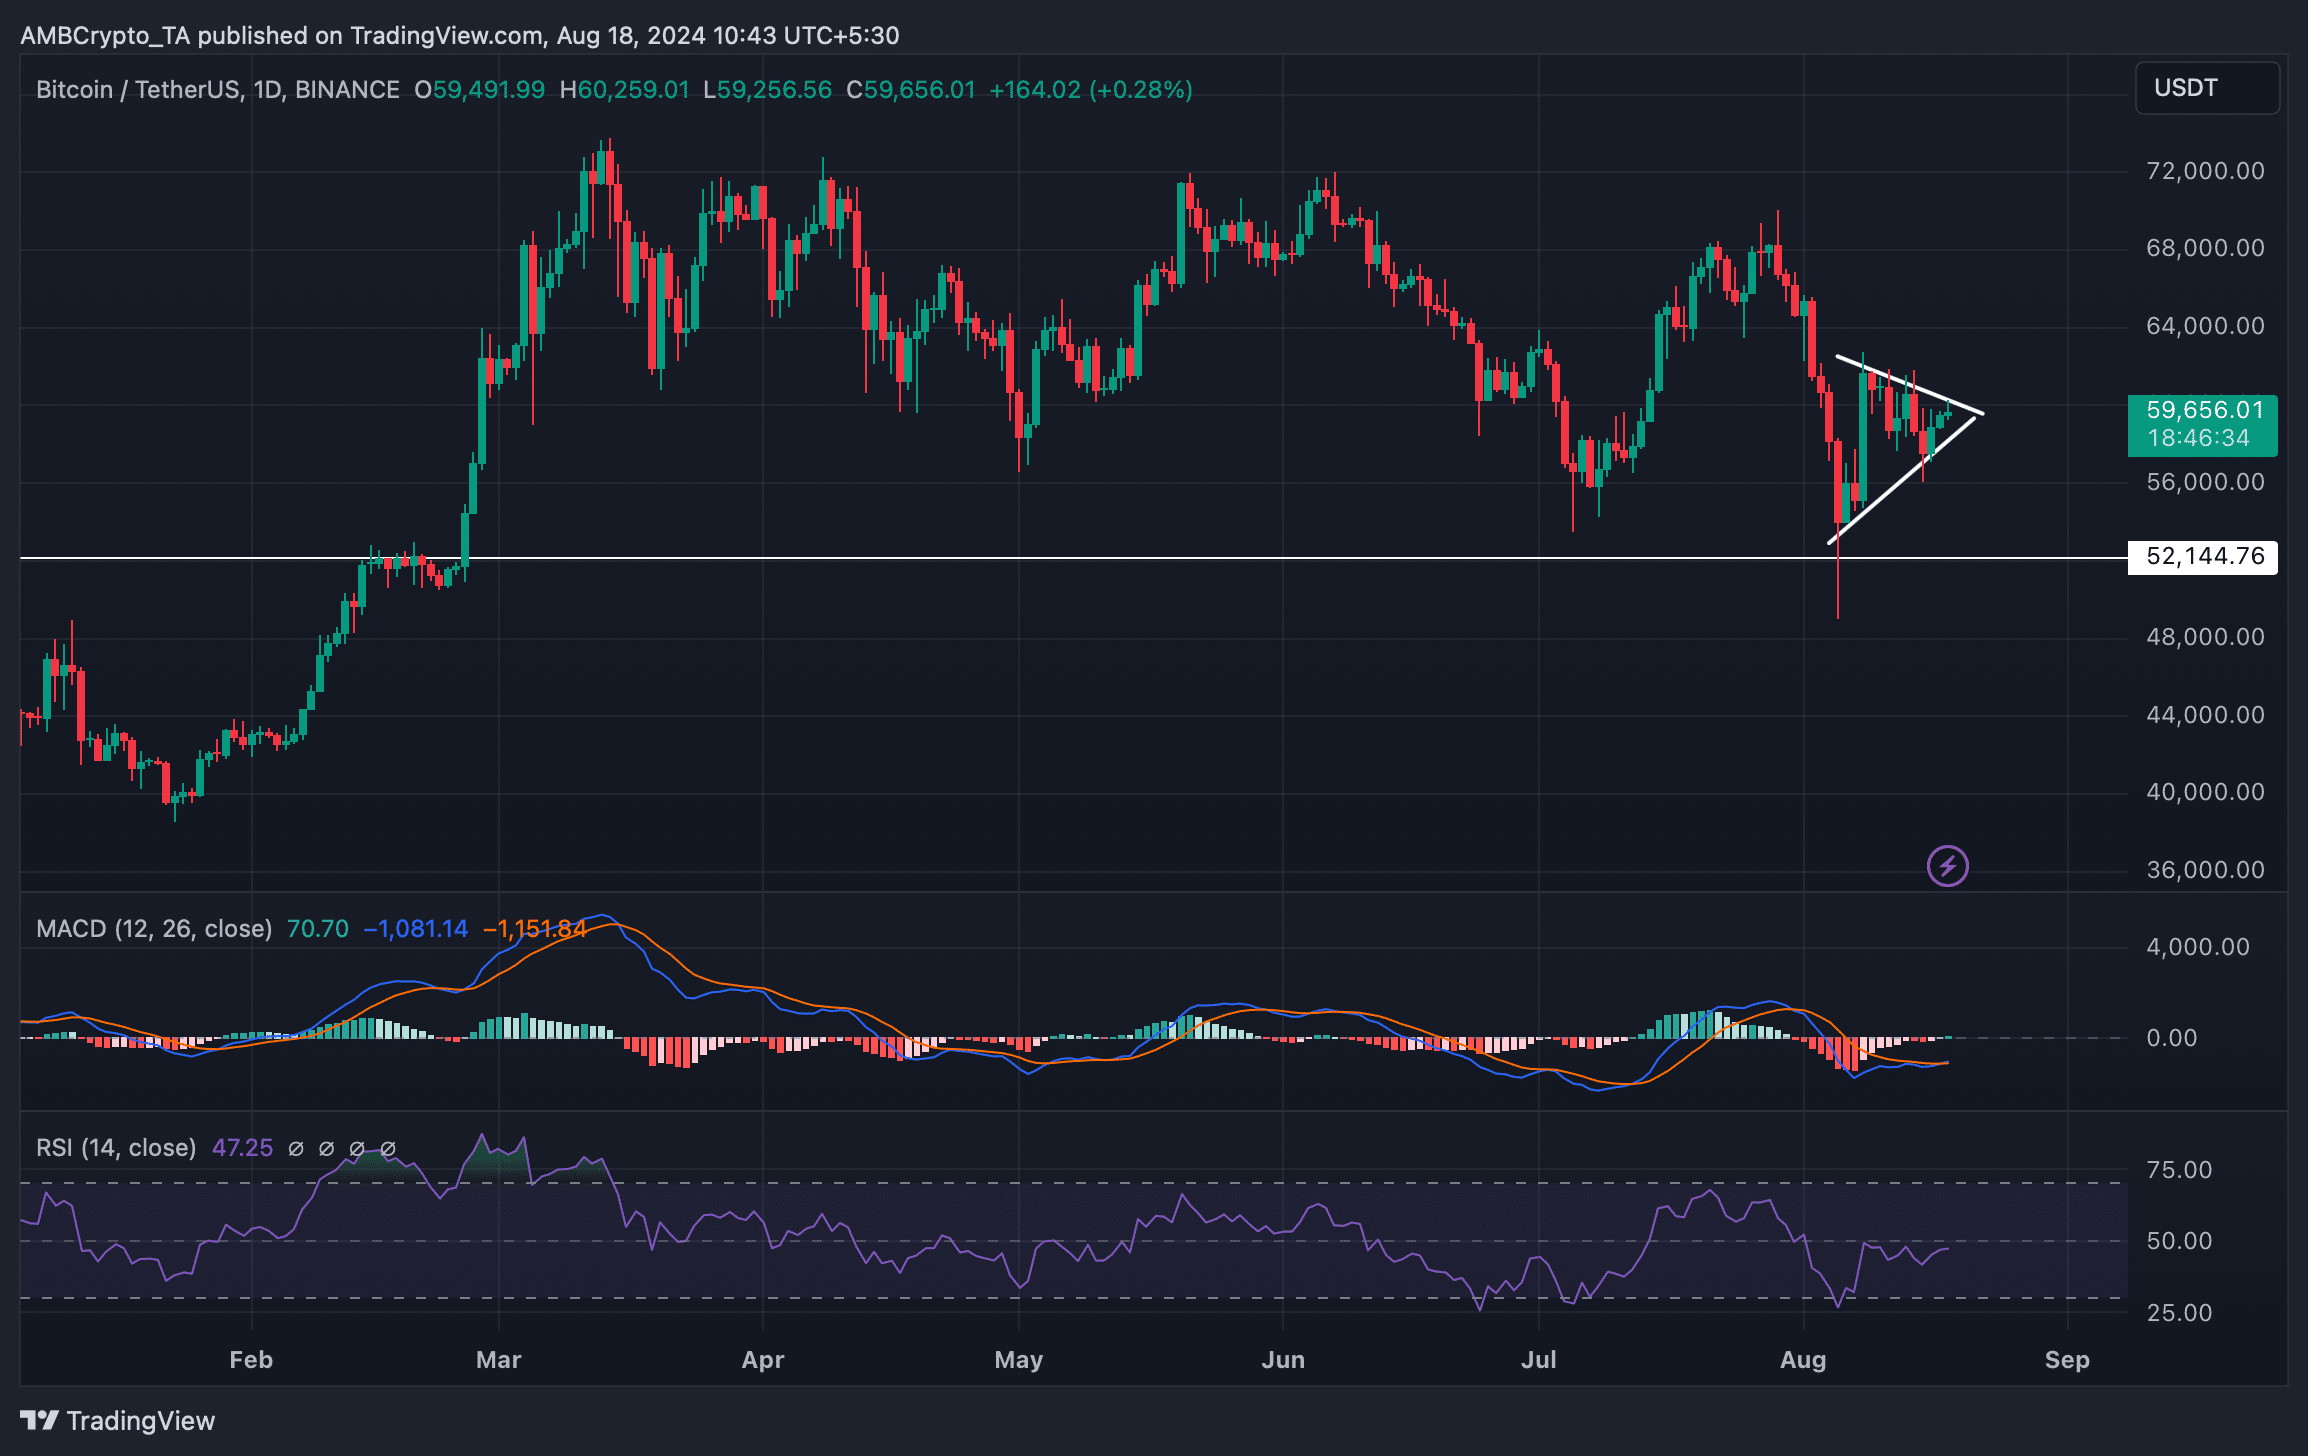
Source: TradingView