Bitcoin: How BTC’s recent crash has aggravated its chances of touching $20k
Bitcoin price has continued its descent after breaching an extremely bearish continuation pattern. The recent sell-off seems to be happening after the FOMC meeting and suggests that is mainly driven by long-term holders that purchased BTC in 2021 and 2022.
Bitcoin price in search of stable footing
Bitcoin price has created a bearish continuation pattern referred to as a bear flag. The pattern contains a massive downswing followed by a consolidation phase. A breakout from this coiling-up often results in the price continuing its descent.
For Bitcoin, the 52% crash from its all-time high at $69,000 to $32,837 created the flag pole. The stagnation period where BTC formed a series of higher highs and higher lows in the form of an ascending parallel channel set up a flag.
The target for this technical formation is determined by adding the flagpole’s height to the breakout point. On 22 April, BTC breached the flag’s lower trend line at $40,032, forecasting a target of $21,584.
The post-FOMC crash has also breached below a significant support level at $36,271, suggesting that the bears are in control. This level has also been invalidated on a weekly time frame as well, adding credence to the incoming downswing.
Therefore, investors need to be prepared for a crash to the $30,000 psychological level. Due to the triple top setup formed during May and July 2021, there is a chance for market makers to dip below $29,000 to collect the sell-stops.
If the sellers continue to dominate, BTC could easily reach its target of $21,584 from $29,000.

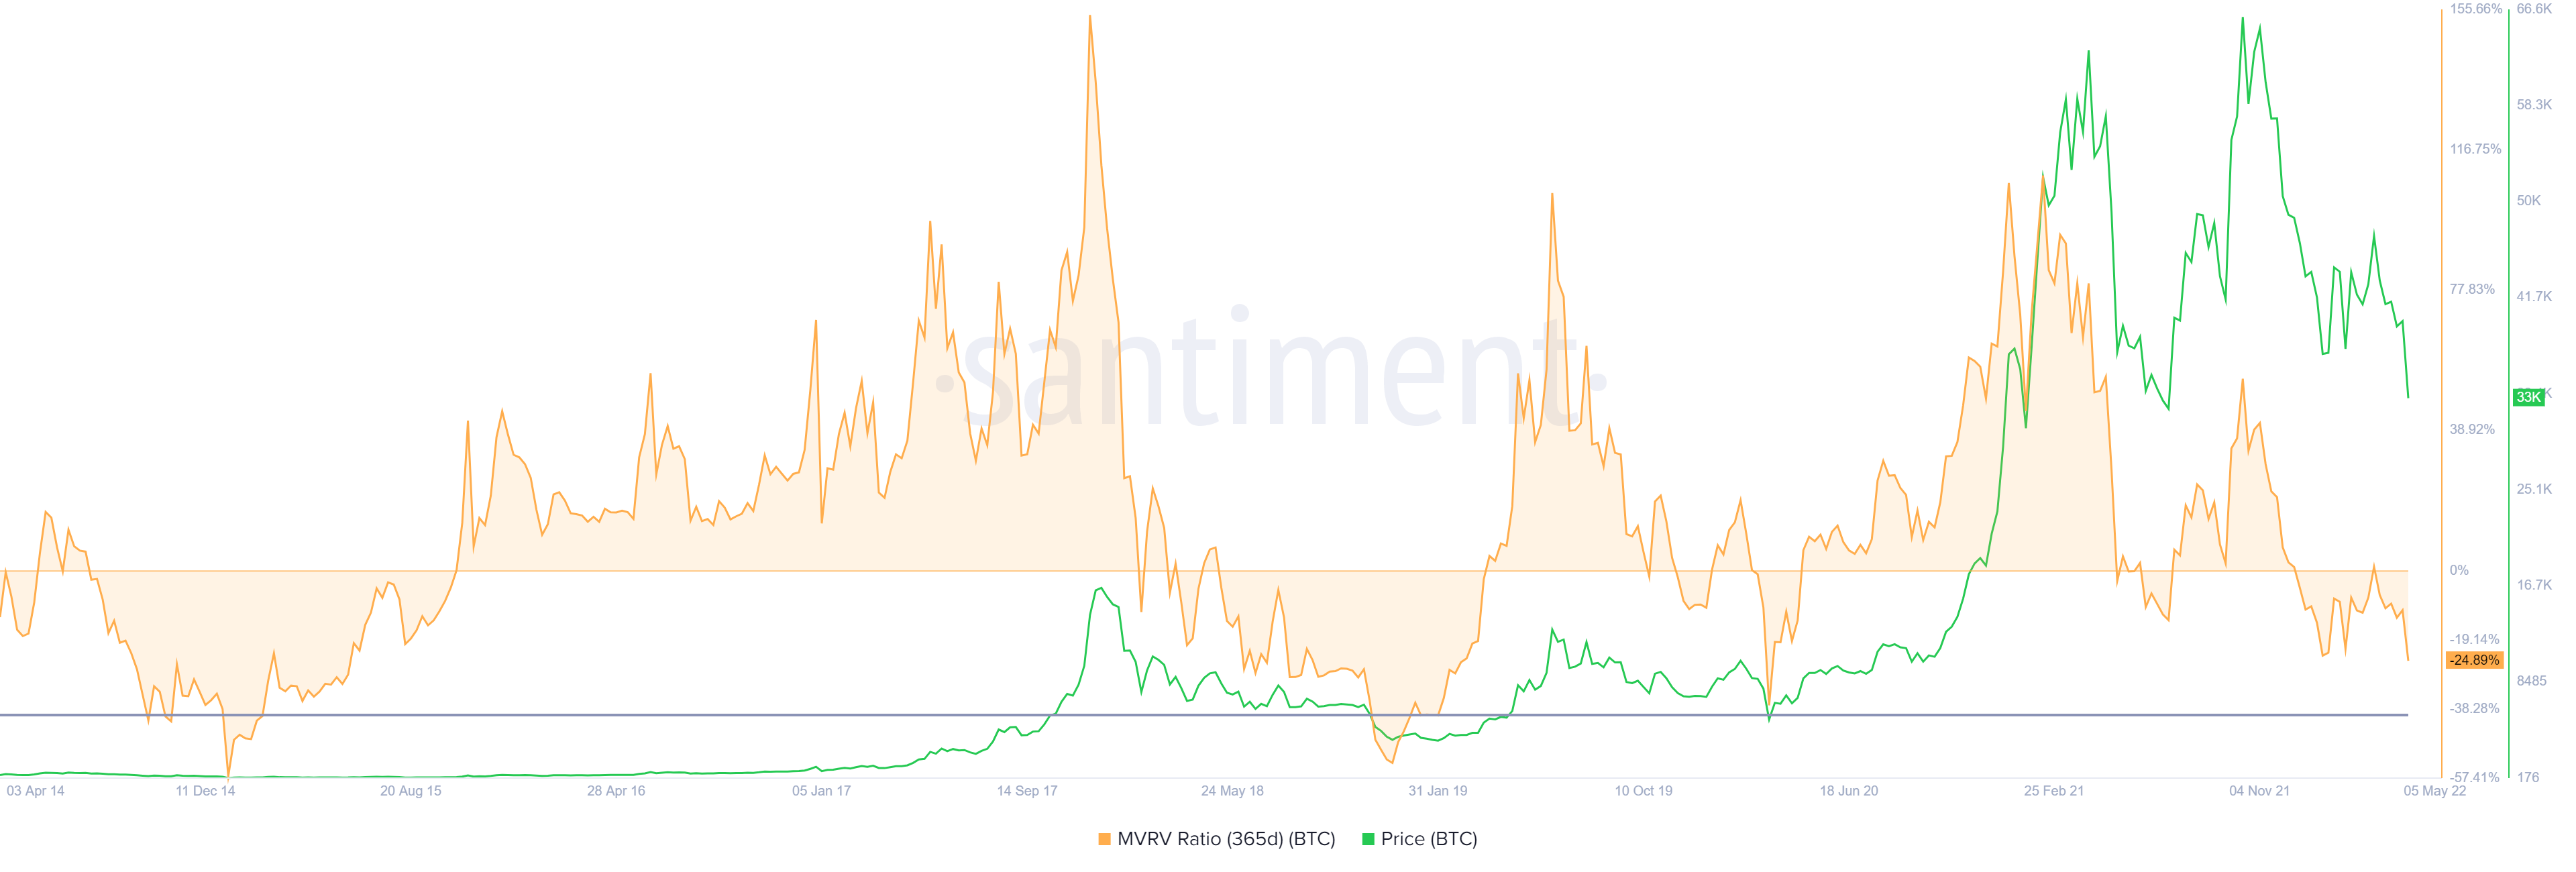
Making sense of this bearish outlook for Bitcoin price is the 365-day Market Value to Realized Value (MVRV) model. As mentioned previously, this indicator is used to track the average profit/loss of investors that purchased BTC over the past year.
Generally, a negative value reveals that these holders are underwater and a positive value indicates that holders are in profit. The probability of a sell-off is high in the latter condition, so ideally, investors do not buy or accumulate when MVRV is positive.
Based on Santiment’s backtests, a value between -10% to -15% is the best place to accumulate since it indicates that short-term holders are at a loss and are less likely to sell at a loss. However, for long-term holders, it is a great place to accumulate which is why the aforementioned range is termed an “opportunity zone.”
Currently, the 365-day MVRV is hovering around a local support level of -25%. Historically, the data shows that this number could drop up to -40%, which is where March 2020 crash bottom was formed.
Therefore, investors need to be aware of the chances of a steep correction, which alights with the bearish technical perspective.