Bitcoin
Bitcoin – Is a double spike pushing BTC towards a local top?
When and where will BTC’s next move take it?

- BTC saw positive moves from some of its key indicators
- Crypto’s price dropped slightly after rising to over $58,000 on the charts
During its latest trading session, Bitcoin (BTC) saw several of its key indicators flash positive signals. This was the case, particularly with its social volume and taker buy/sell ratio.
In fact, data showed that its social volume and taker buy/sell ratio registered spikes. Historically, when these indicators show similar spikes, it can sometimes suggest that Bitcoin may be approaching a local top.
Bitcoin’s social commentary spikes
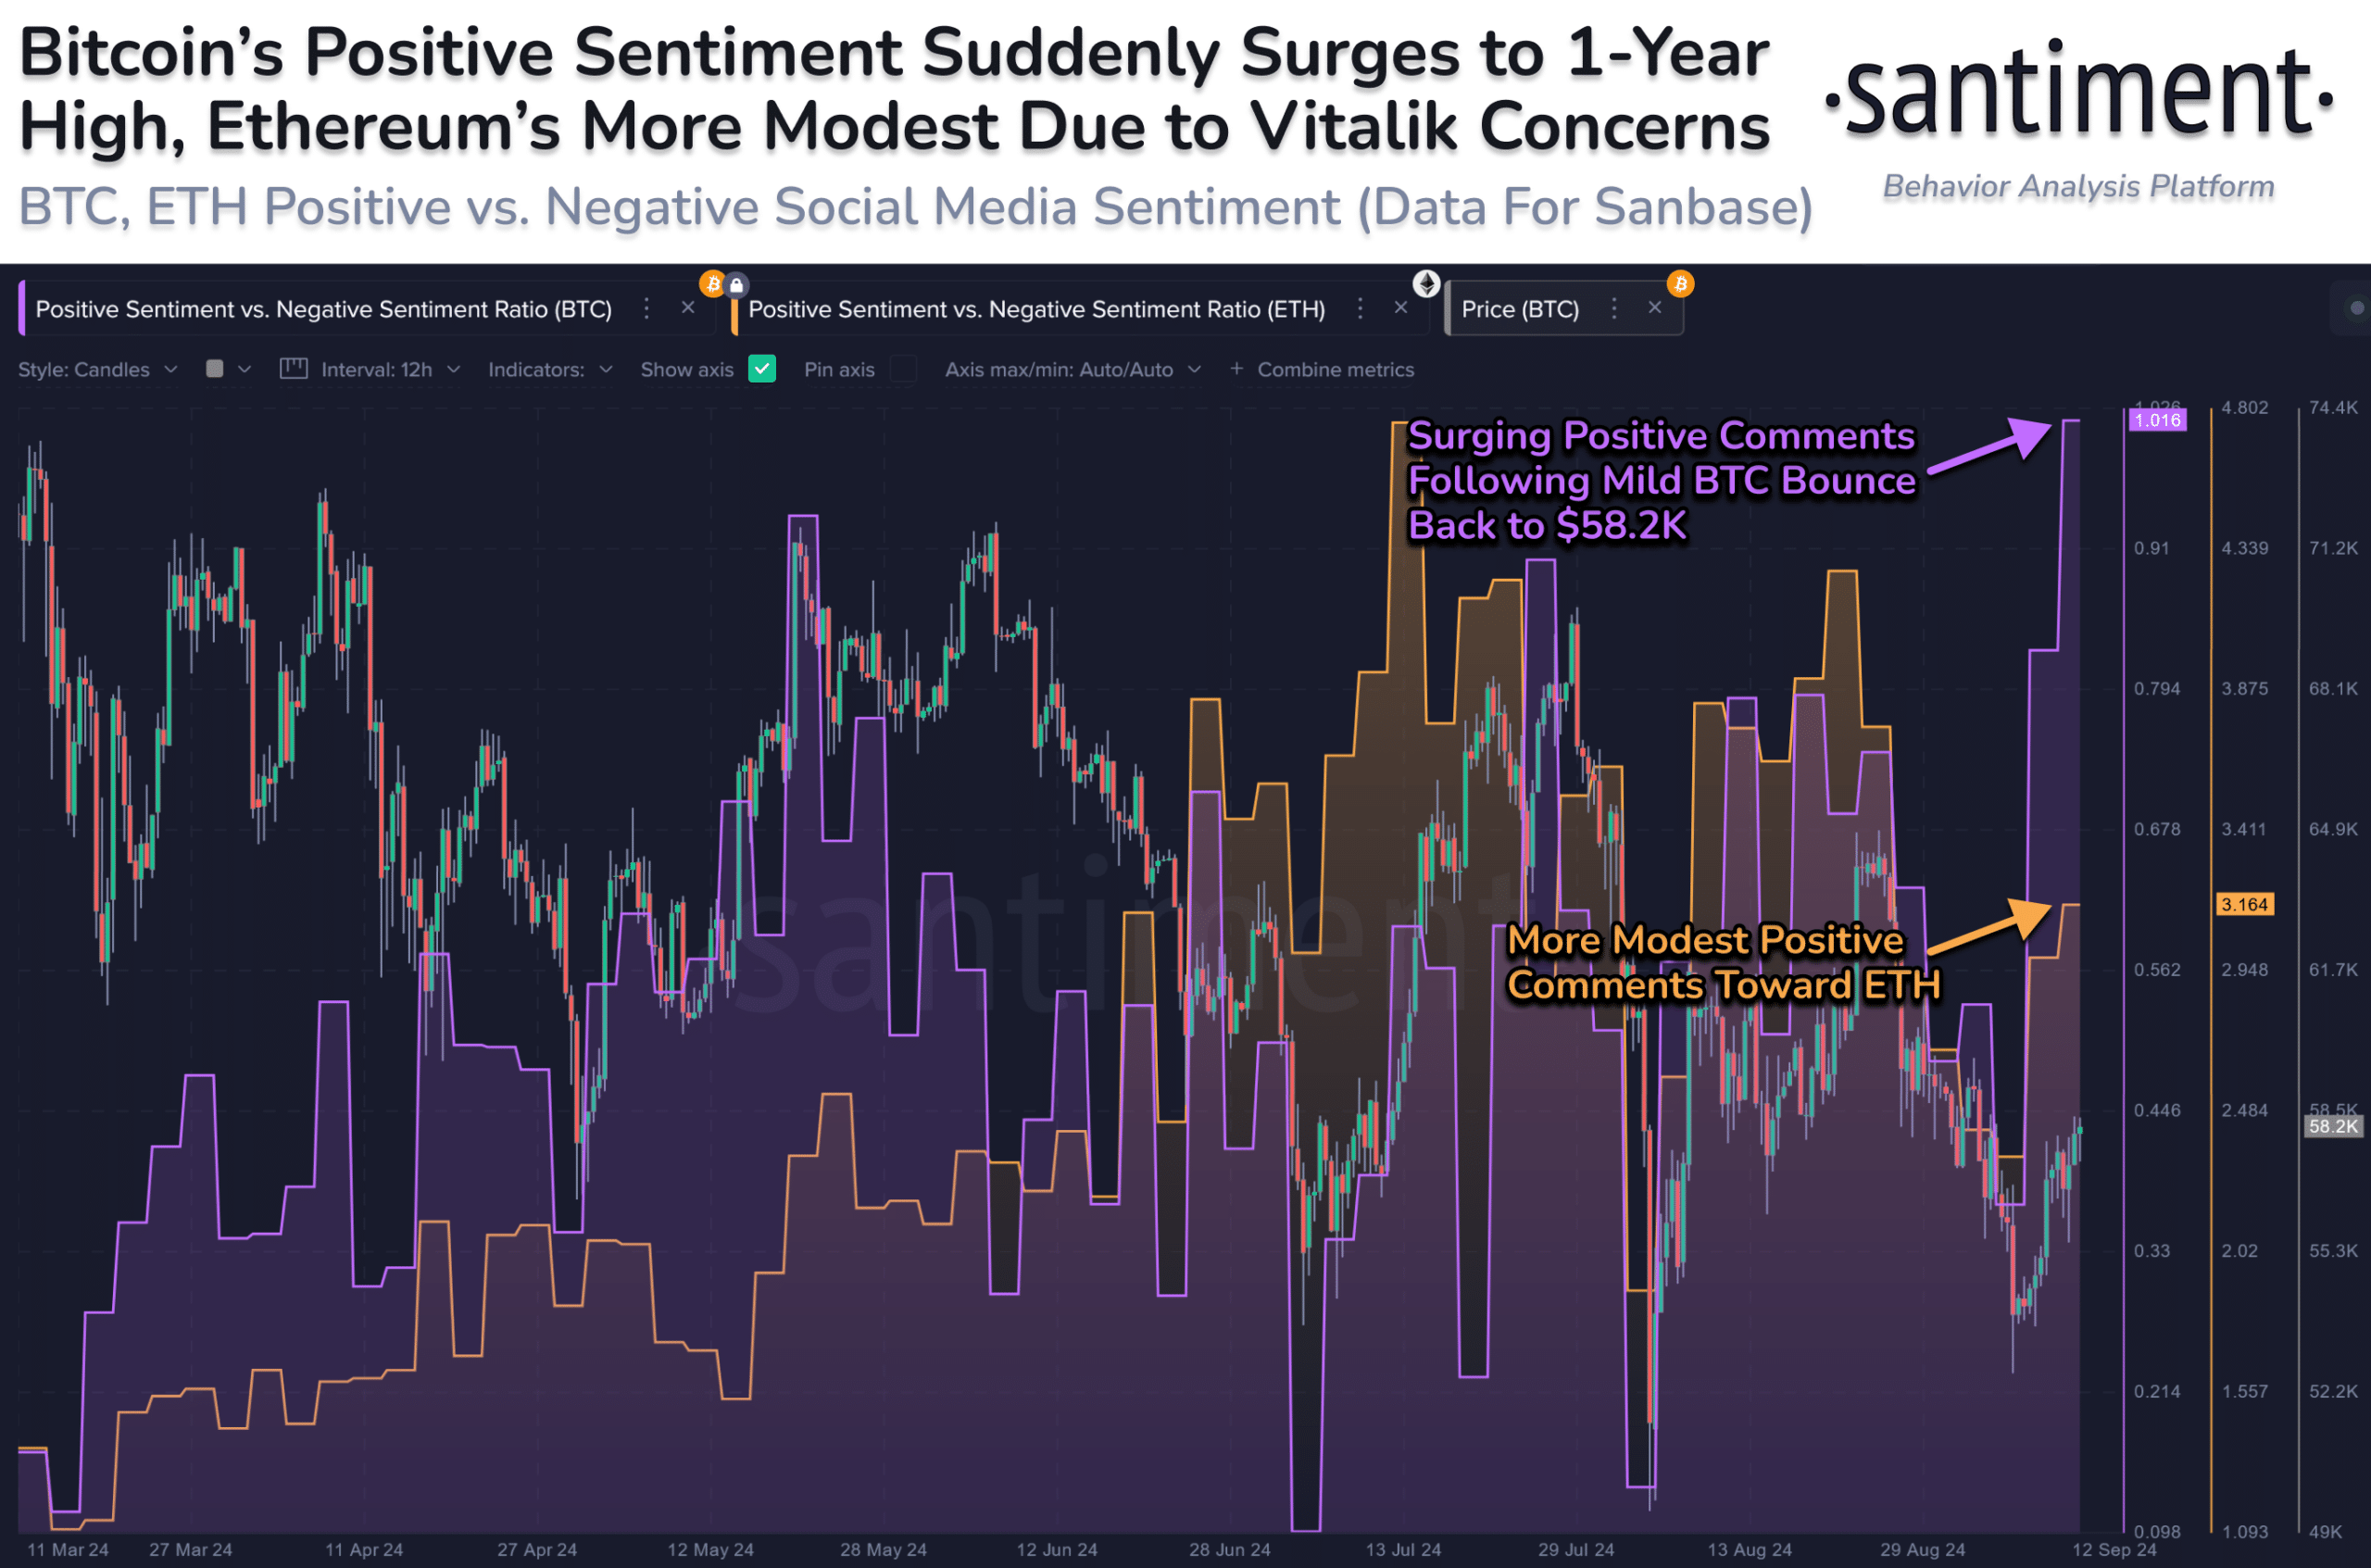
According to Santiment, Bitcoin’s social commentary spiked significantly during the last trading session. Both positive and negative sentiments increased, but positive sentiments registered a more pronounced spike. This surge in social commentary was the highest recorded spike so far this year, indicating heightened attention and optimism surrounding Bitcoin.
Historically, spikes in social sentiment, particularly optimism, have often signaled the formation of local tops in Bitcoin’s price. Previous instances support this pattern too.
For instance, on 19 and 20 May, a spike in social commentary coincided with Bitcoin’s price rising by over 7% to a local top of more than $71,400. Similarly, around 29 and 30 June, Bitcoin’s price reacted to a spike in social sentiment, climbing to over $62,000.
Source: Santiment
Given these historical trends, the current spike in positive sentiment could mean that Bitcoin may be approaching another local top.
Bitcoin sees hike in taker buy/sell ratio
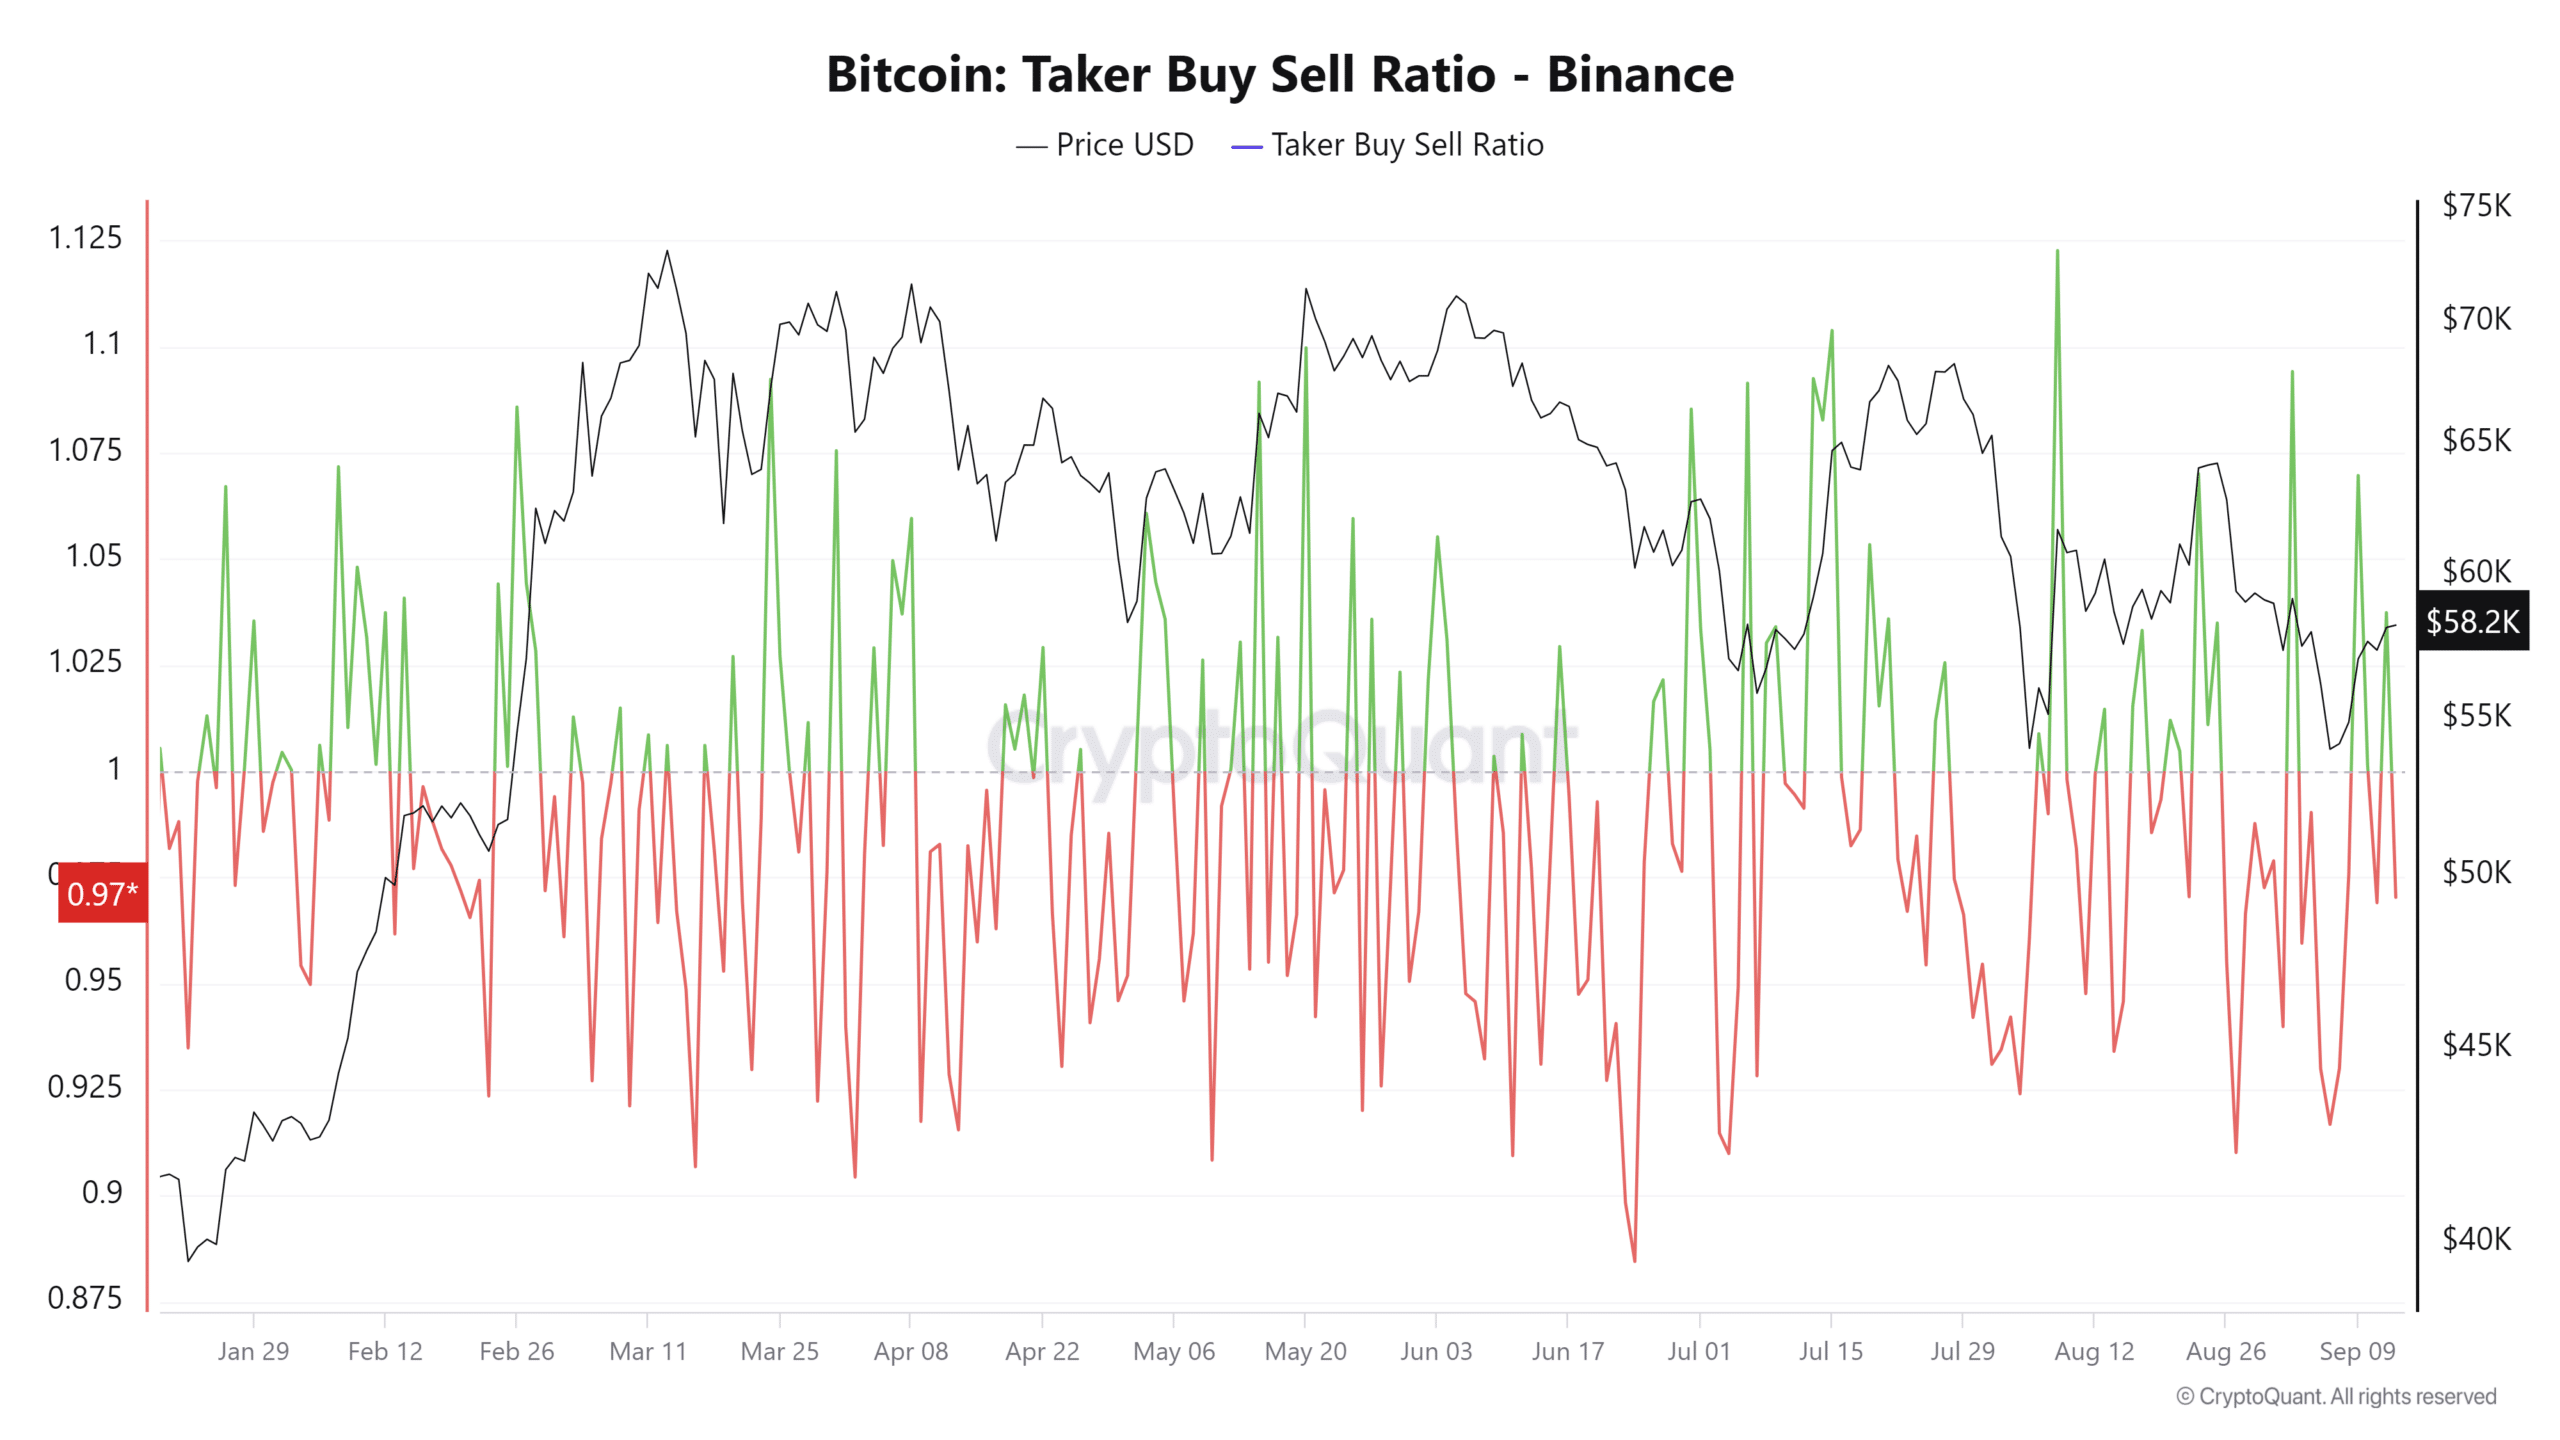
In addition to the aforementioned findings, the taker buy/sell ratio also saw a significant hike over the last trading session. According to AMBCrypto’s assessment of CryptoQuant data, the taker buy/sell ratio, especially on Binance, spiked to over 2%. Typically, a spike above 1% signals dominant bullish sentiment, reflecting aggressive buying behavior among traders.
Historically, spikes in this ratio have been followed by price hikes for Bitcoin (BTC). The last notable spike occurred on 8 August, when BTC’s price surged to around $61,697 after having previously declined to around $54,000. This hike in buying activity led to significant price appreciation on the charts.
Source: CryptoQuant
The latest spike in the taker buy/sell ratio also coincided with a small price rise, with BTC rising from around $57,000 to approximately $58,000. If the historical pattern holds, this finding could indicate more upside in the short term.
What this means for BTC
A combination of increasing social commentary and taker buy/sell ratio alludes to heightened optimism – A sign that further gains may be possible.
Here, it’s worth pointing out that when spikes in key indicators like the taker buy/sell ratio and social commentary occur, it often triggers FOMO (Fear of Missing Out) among traders. This sentiment typically drives more buying activity as traders rush to enter the market, hoping to capitalize on further price gains.
– Read Bitcoin (BTC) Price Prediction 2024-25
However, as the market rises, FOMO is gradually replaced by FUD (Fear, Uncertainty, and Doubt). Traders may start to question whether the rally can be sustained, leading to a shift in sentiment and potential profit-taking.