Bitcoin: Is a local top forming? Why BTC’s pullback looks close
Will an overbought RSI lead to another corrective move?

- Bitcoin is showing signs of a potential local top, with key momentum indicators suggesting overextension.
- Is another pullback imminent?
On the 2nd of March, Bitcoin [BTC] surged 9.44% in a single day – the highest one-day gain in three months.
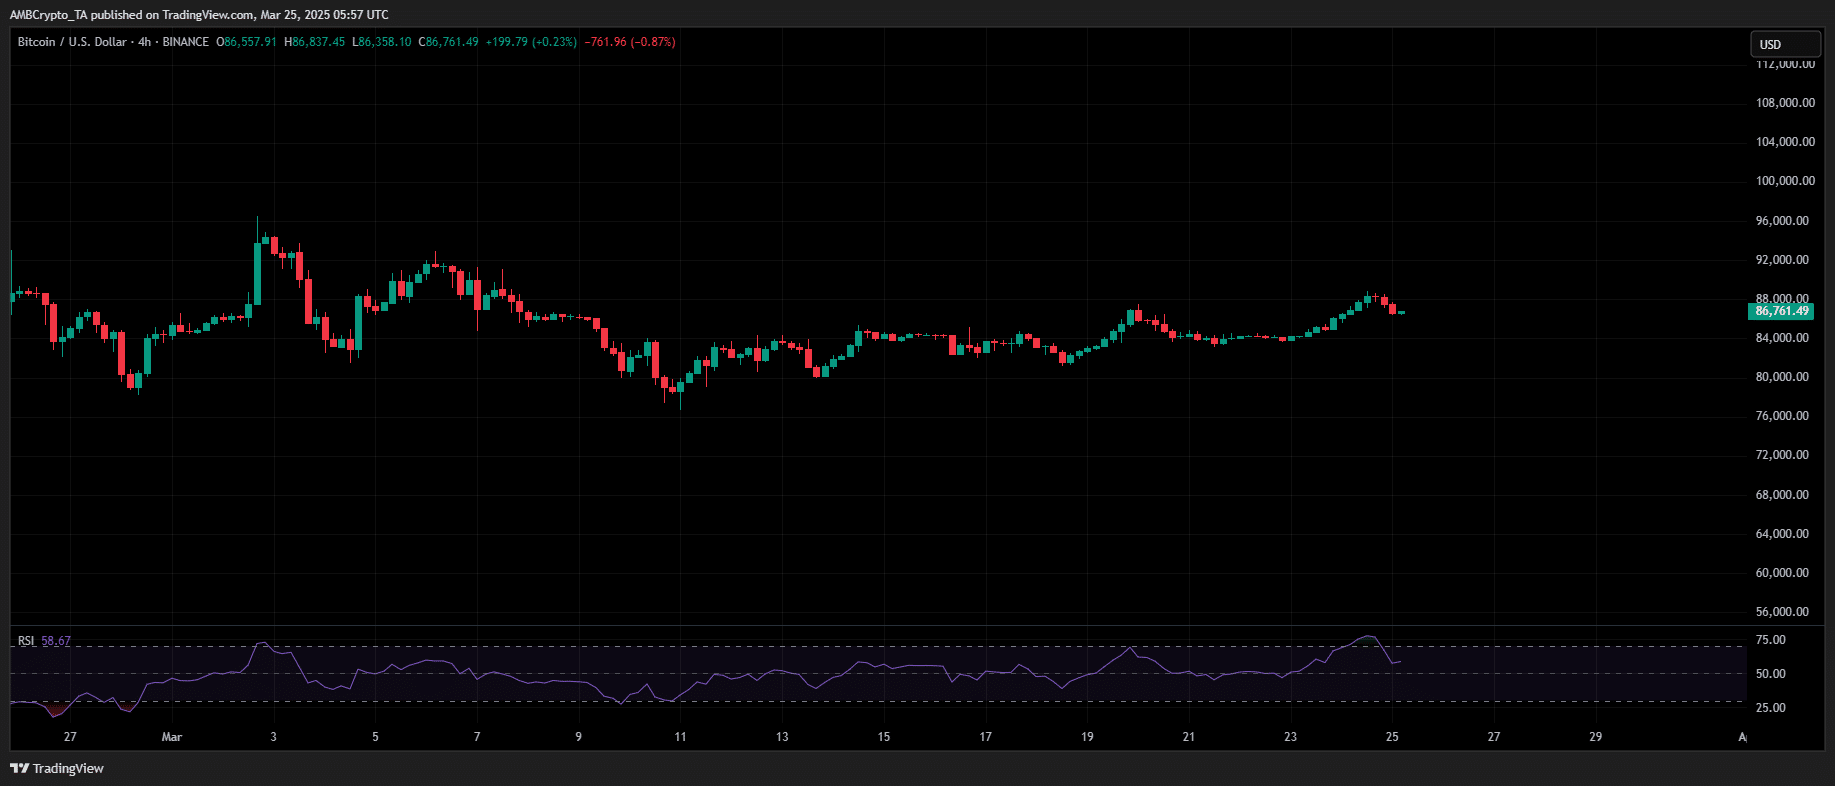
As the 4-hour RSI peaked at 70, price action reversed, leading to a 14.13% decline to $81,500 within 10 trading sessions.
The last time Bitcoin saw a similar capital influx was during the election run, when BTC reached its then-all-time high of $88,400 on the 11th of March, pushing the 4-hour RSI into overbought territory.
Despite the overbought reading, bulls absorbed sell-side liquidity, flushed out weak hands, and pushed BTC to a $92,647 peak two days later.
Moving forward, the Relative Strength Index (RSI) is a momentum oscillator that measures the speed and change of price movements on a scale from 0 to 100.
Traditionally, an RSI above 70 indicates that an asset may be overbought, suggesting potential for a price pullback, while an RSI below 30 suggests it may be oversold, indicating potential for a price rebound.
Historically, when Bitcoin’s 4-hour RSI enters overbought territory, it indicates strong bullish momentum but has frequently preceded sharp price corrections.
Now, three months later, Bitcoin has reclaimed $88k for the first time in 17 days. However, on the 4-hour chart, RSI has again surged near 80.
With profit-taking likely, can bulls absorb the sell-side pressure, or is another March-style correction imminent?
Bitcoin poised for a pullback
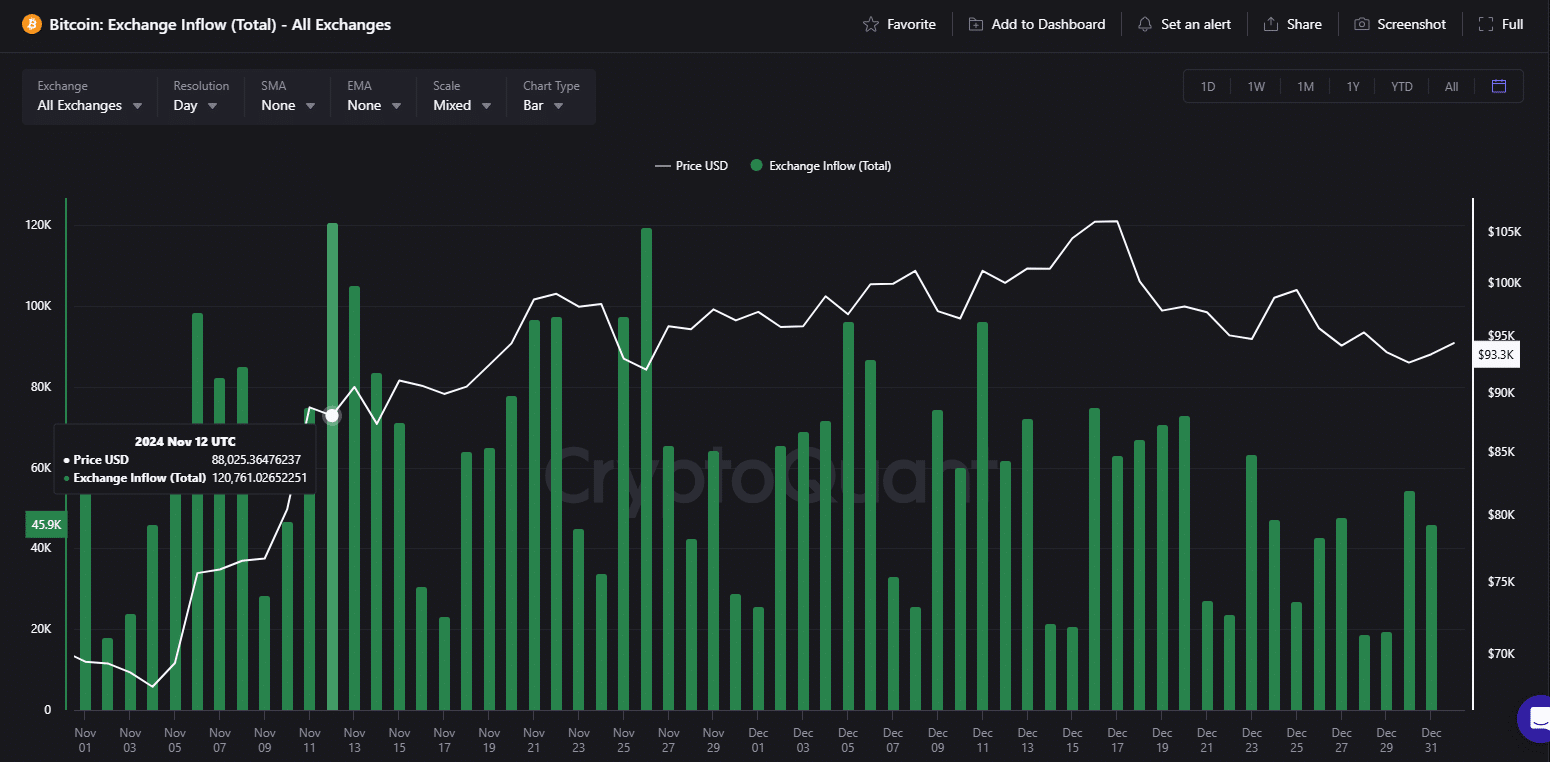
AMBCrypto uncovered a key pattern. On the 12th of March, as Bitcoin’s RSI signaled overextension, Bitcoin ETFs registered their second-highest inflow – a record $1.114 billion.
This suggested that sustained institutional demand played a crucial role in absorbing the impact of 120,761 BTC, worth $10.67 billion, that flooded exchanges in a single-day sell-off.
As of this writing, Binance spot demand remains strong, with net outflows suggesting continued Bitcoin accumulation. The derivatives market also reflected bullish positioning.
Meanwhile, both long- and short-term SOPR (Spent Output Profit Ratio) have flipped above 0, confirming that holders are now in profit.
However, with the Bitcoin’s 4-hour RSI in an overbought territory, profit-taking pressure could escalate, potentially triggering short-term volatility. For Bitcoin to push toward $90k, sustained buying momentum is crucial.
Yet, with “reciprocal” tariffs set to take effect on the 2nd of April, market uncertainty remains high. If resistance holds, a corrective move toward the $82k–$83k range appears likely in the near term.