


- Bitcoin sees massive outflows.
- BTC breaks into the $47,000 price range.
Bitcoin [BTC] has broken the trend of inflow in the past few days as the volume of outflow hit a high. How has the outflow impacted the supply on exchanges?
Bitcoin flow trend sees reversal
According to IntoTheBlock’s data, the longstanding trend of Bitcoin inflow into exchanges, which persisted for about eight weeks, has recently come to an end. At the time of this writing, there has been a reversal in the trend, with more Bitcoin outflows from exchanges.
The platform recorded an outflow amounting to around $300 million worth of BTC.
Furthermore, a detailed analysis of Netflow data from CryptoQuant showed an intensified outflow between 7th February and 9th February.
The analysis revealed that over 15,000 BTCs left the exchanges during this period, totaling almost $740 million.
This shift in the direction of the flow indicates a transition for most holders from selling their holdings to accumulating. Such a move is a positive signal for the price of BTC.

Bitcoin supply on exchanges react
An examination of Bitcoin supply on exchanges showed a notable impact resulting from the increased outflow. The data analysis indicated that starting from 7th February, the supply on exchanges decreased from about 1.05 million to around 1.04 million.
Additionally, an analysis of the trend in supply on exchanges showed that this volume was the lowest observed in the past three months.

This observation aligns with the insights from the Netflow metric, confirming a decline in the supply on exchanges. A decrease in the supply on exchanges can be attributed to various factors, but it creates a sense of scarcity that may contribute to influencing the price trend positively.
How BTC has trended with the latest outflow
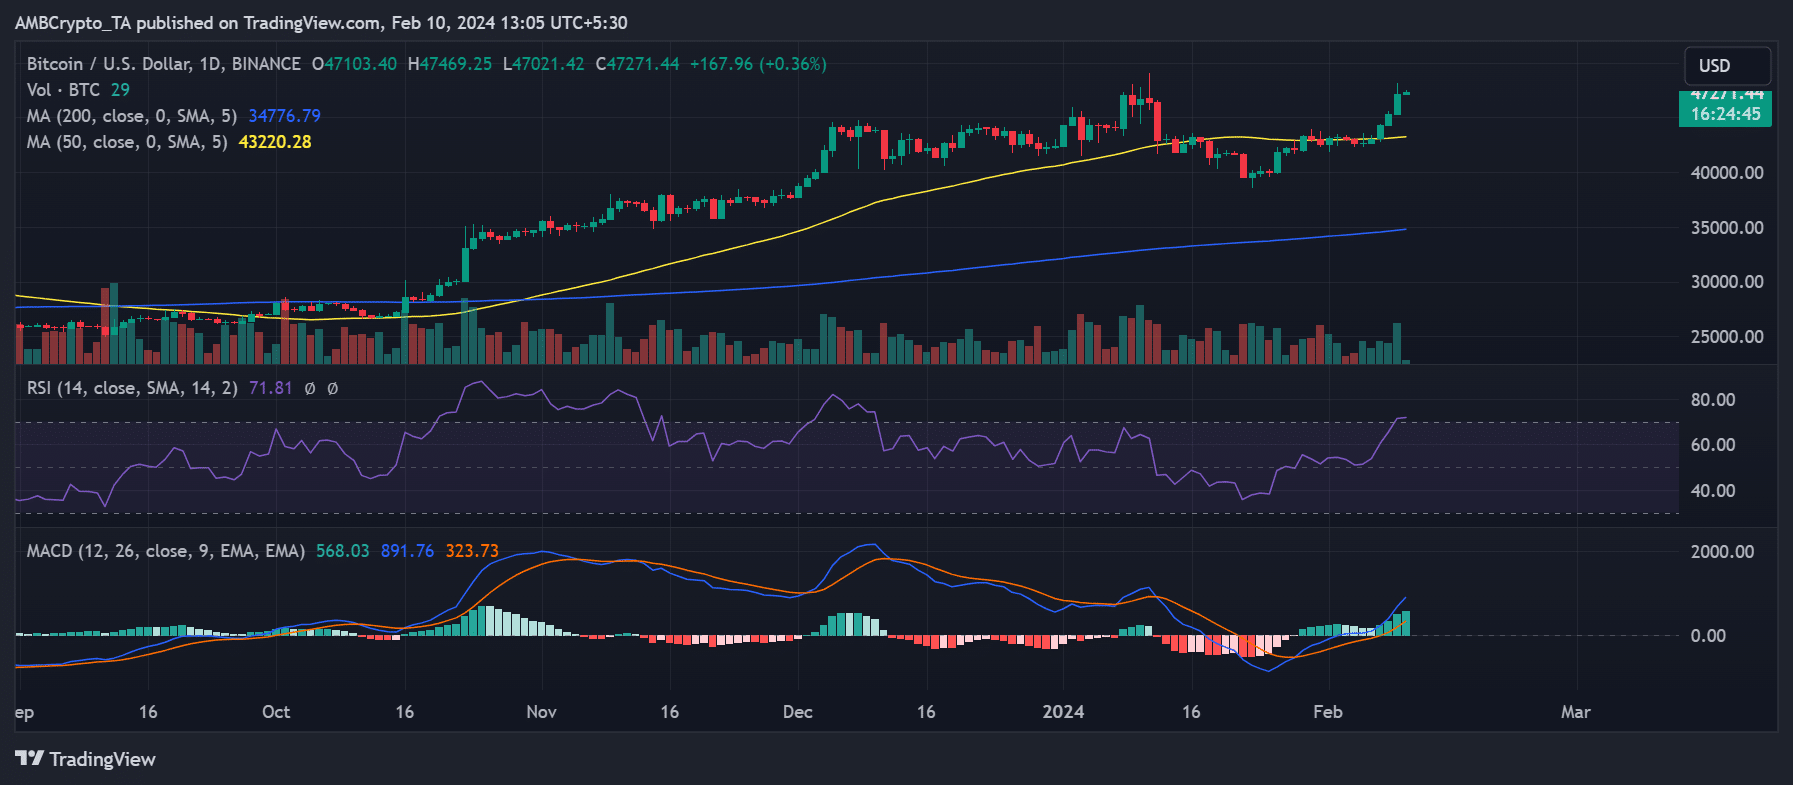
Analysis of Bitcoin on a daily timeframe chart showed a consistent uptrend spanning the past six days. The chart demonstrated that the price had breached the $47,000 price range for the second time in over a year.
The initial entry into this price range was in January when the price reached $47,018.
How much are 1,10,100 BTCs worth today
At the time of this writing, BTC was trading at about $47,271, showing a modest increase of less than 1%.
Notably, this recent uptrend has moved Bitcoin into the overbought zone on its Relative Strength Index (RSI). This development suggests the possibility of a forthcoming price reversal.