
Following a minor crash last week, Bitcoin, the top cryptocurrency is currently undergoing a major correction in its price trajectory. BTC was bearish on the one-day chart, 12-hour chart, and even on a four-hour chart, red candles seemed to be taking over its trend. At the time of writing, Bitcoin was trading around the $31.5K-mark, having fallen by 0.65% in the last 24 hours. However, not all hope was lost for the king coin.
While the occasional mini pumps on July 16 on BTC’s four-hour chart didn’t do much for its price, some rather interesting takes were presented by experts. On one hand, recent Santiment data struck a bullish note on Bitcoin’s sentiment on Twitter declining. The more negative the sentiment gets, the higher is the degree of a potential price rally. Thus, predicting a rally for the top coin that might take the Bitcoin community by surprise. The post said:
“ Twitter’s sentiment toward Bitcoin remains negative in the amount of volume and tone that our algorithm is picking up. Generally, when there is negativity, there is a higher degree of price upswing to catch the crowd off guard.”

Source: Santiment Twitter
On the other hand, Founder and CEO of crypto exchange CoinCorner Danny Scott tweeted about a bizarre similarity between Bitcoin charts of today and 2013. He pointed out that both charts showed a Bitcoin peak in April followed by a decline that lasted for several months. However, in 2013 Bitcoin picked up in August and demonstrated a rally by the end of the year.
2013 vs 2021 #Bitcoin bull runs.
Both had a peak in April, then down and settled for a few months…. pic.twitter.com/Lo6nEvg9uF
— Danny Scott (@CoinCornerDanny) July 17, 2021
Not just that, a closer look at the stock to flow ratio for Bitcoin showed a steep drop in the metric. Technically this would be followed by a rise in price as seen in the previous cycles. However, in a recent Tweet, addressing skepticism around the stock-to-flow Bitcoin model, PlanB had Tweeted that the “Next 6 months will be make or break for S2F (again).” S2F model has failed to hold up in the case of Bitcoin, according to some critics.
June closing price $35,037 .. as far below S2F model as in Jan 2019. Next 6 months will be make or break for S2F (again). pic.twitter.com/W3TM5sOAwY
— PlanB (@100trillionUSD) July 1, 2021
The stock-to-flow model asses Bitcoin as a scarce digital resource with profoundly compelling characteristics to retain value over the long term, assuming that there’s a statistically significant relationship between Stock to Flow and market value. Generally, Bitcoin’s price should see a significant increase over time due to its continually reduced Stock to Flow ratio.
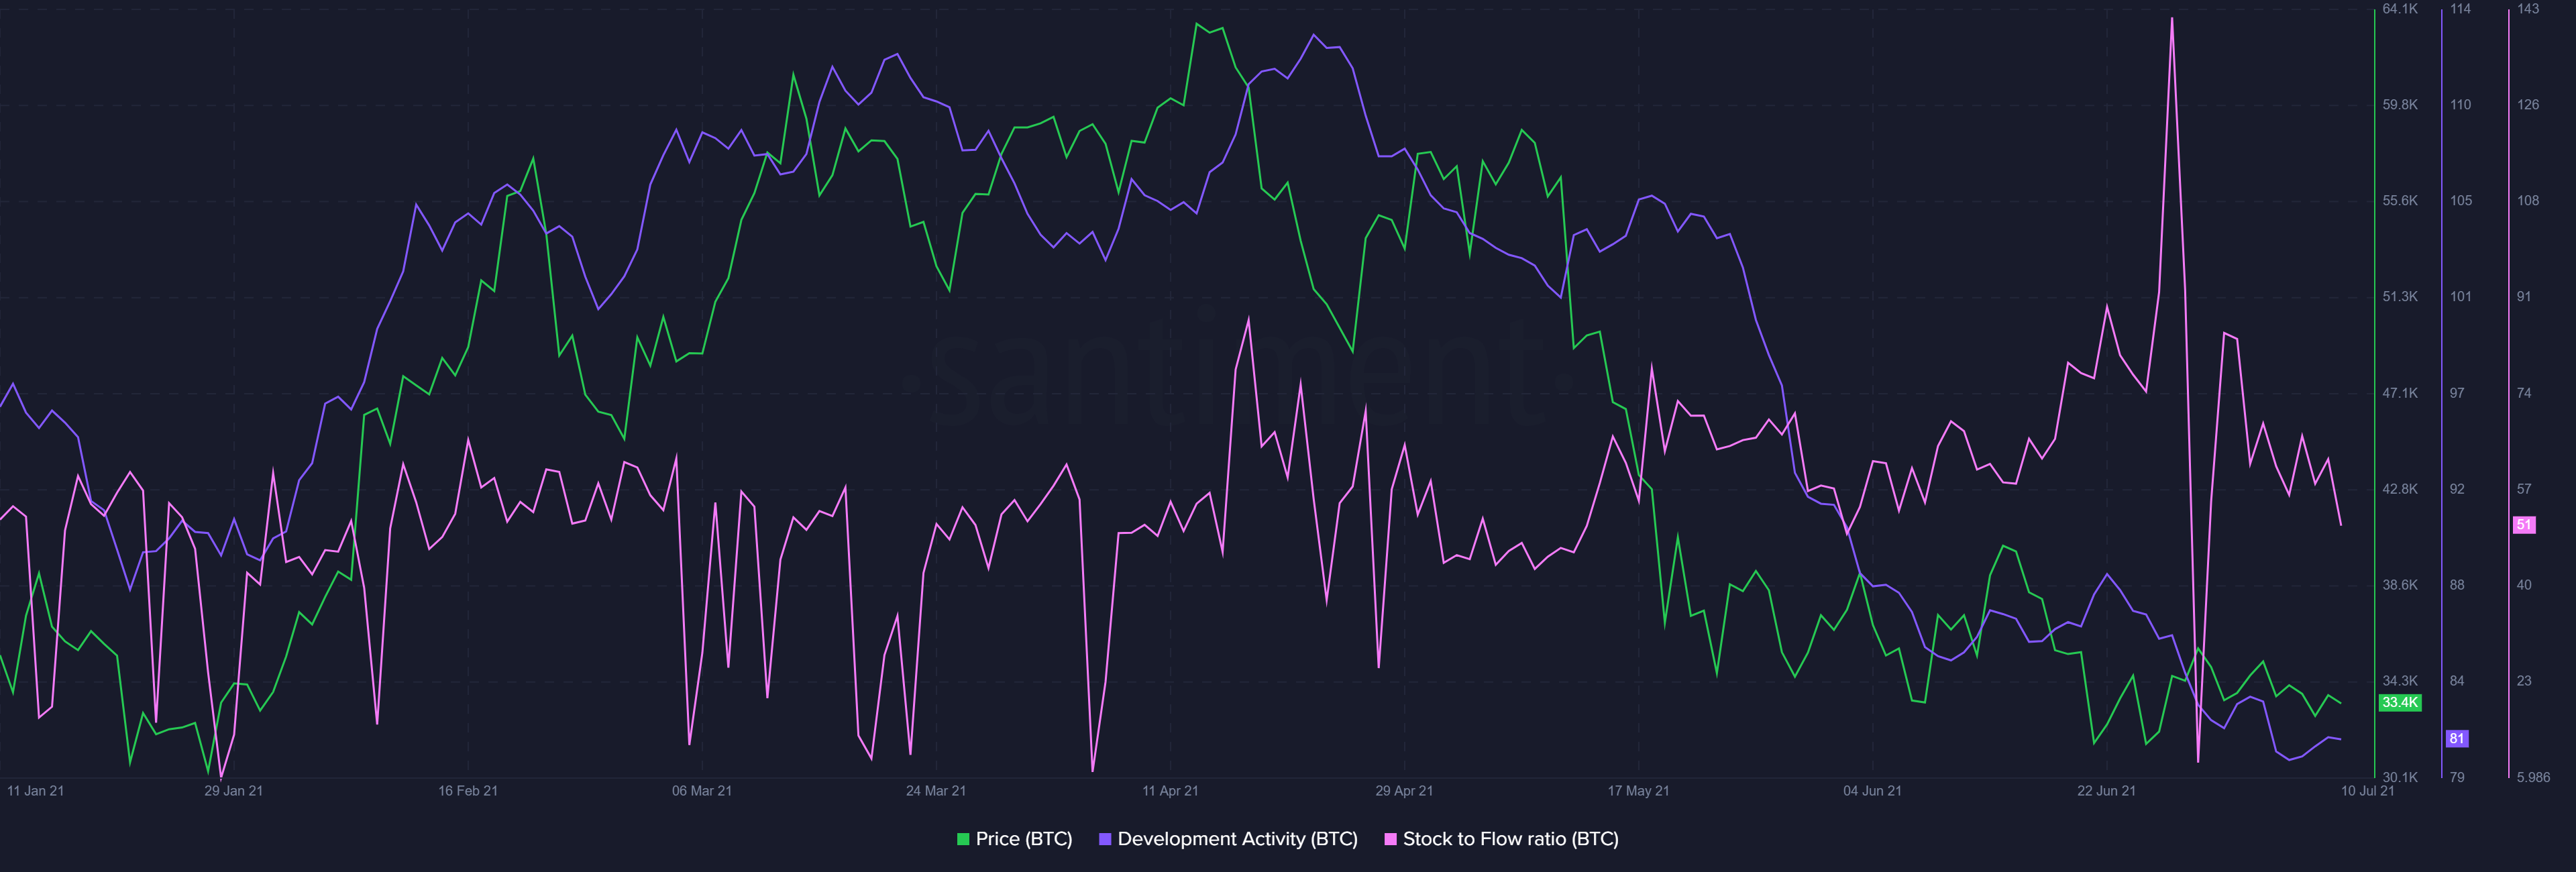
While these few metrics may point towards a bullish narrative, they should be taken with a grain of salt. As seen in the above charts, Bitcoin’s development activity also slumped to low levels highlighting a weakened network. Notably, Bitcoin’s Fear and Greed Index had recently hit 15, which means extreme fear. Similar levels were witnessed during March 2020, when the coin fell by almost 50% in a day.