Bitcoin

Bitcoin’s price: Is THIS the sign of a true bull run, or is it just a trap?
Posted:
contributor

- Bitcoin’s 200-day moving average reached an all-time high, suggesting a bullish outlook.
- Short-term challenges persisted, with some metrics showing potential bearish signals.
Bitcoin [BTC] has once again demonstrated its resilience, rebounding significantly from recent lows.
Despite shedding nearly 14% from its March peak of over $73,000, the king coin’s recent performance has hinted at a promising recovery.
Over the past week, Bitcoin briefly surged past the $64,000 threshold before settling at $63,635 at the time of writing.
This slight retreat, marking a 0.9% drop in the last 24 hours, has not dampened the long-term optimism surrounding the flagship cryptocurrency.
Bitcoin: Bullish signals amid price fluctuations
Amidst these fluctuations, the Bitcoin 200-day moving average—a vital indicator for assessing long-term market trends—has reached an unprecedented high of $50,178.
This milestone, which AMBCrypto analyzed using BuyBitcoinWorldwide’s data, underscores a potentially bullish outlook for Bitcoin over the long haul.
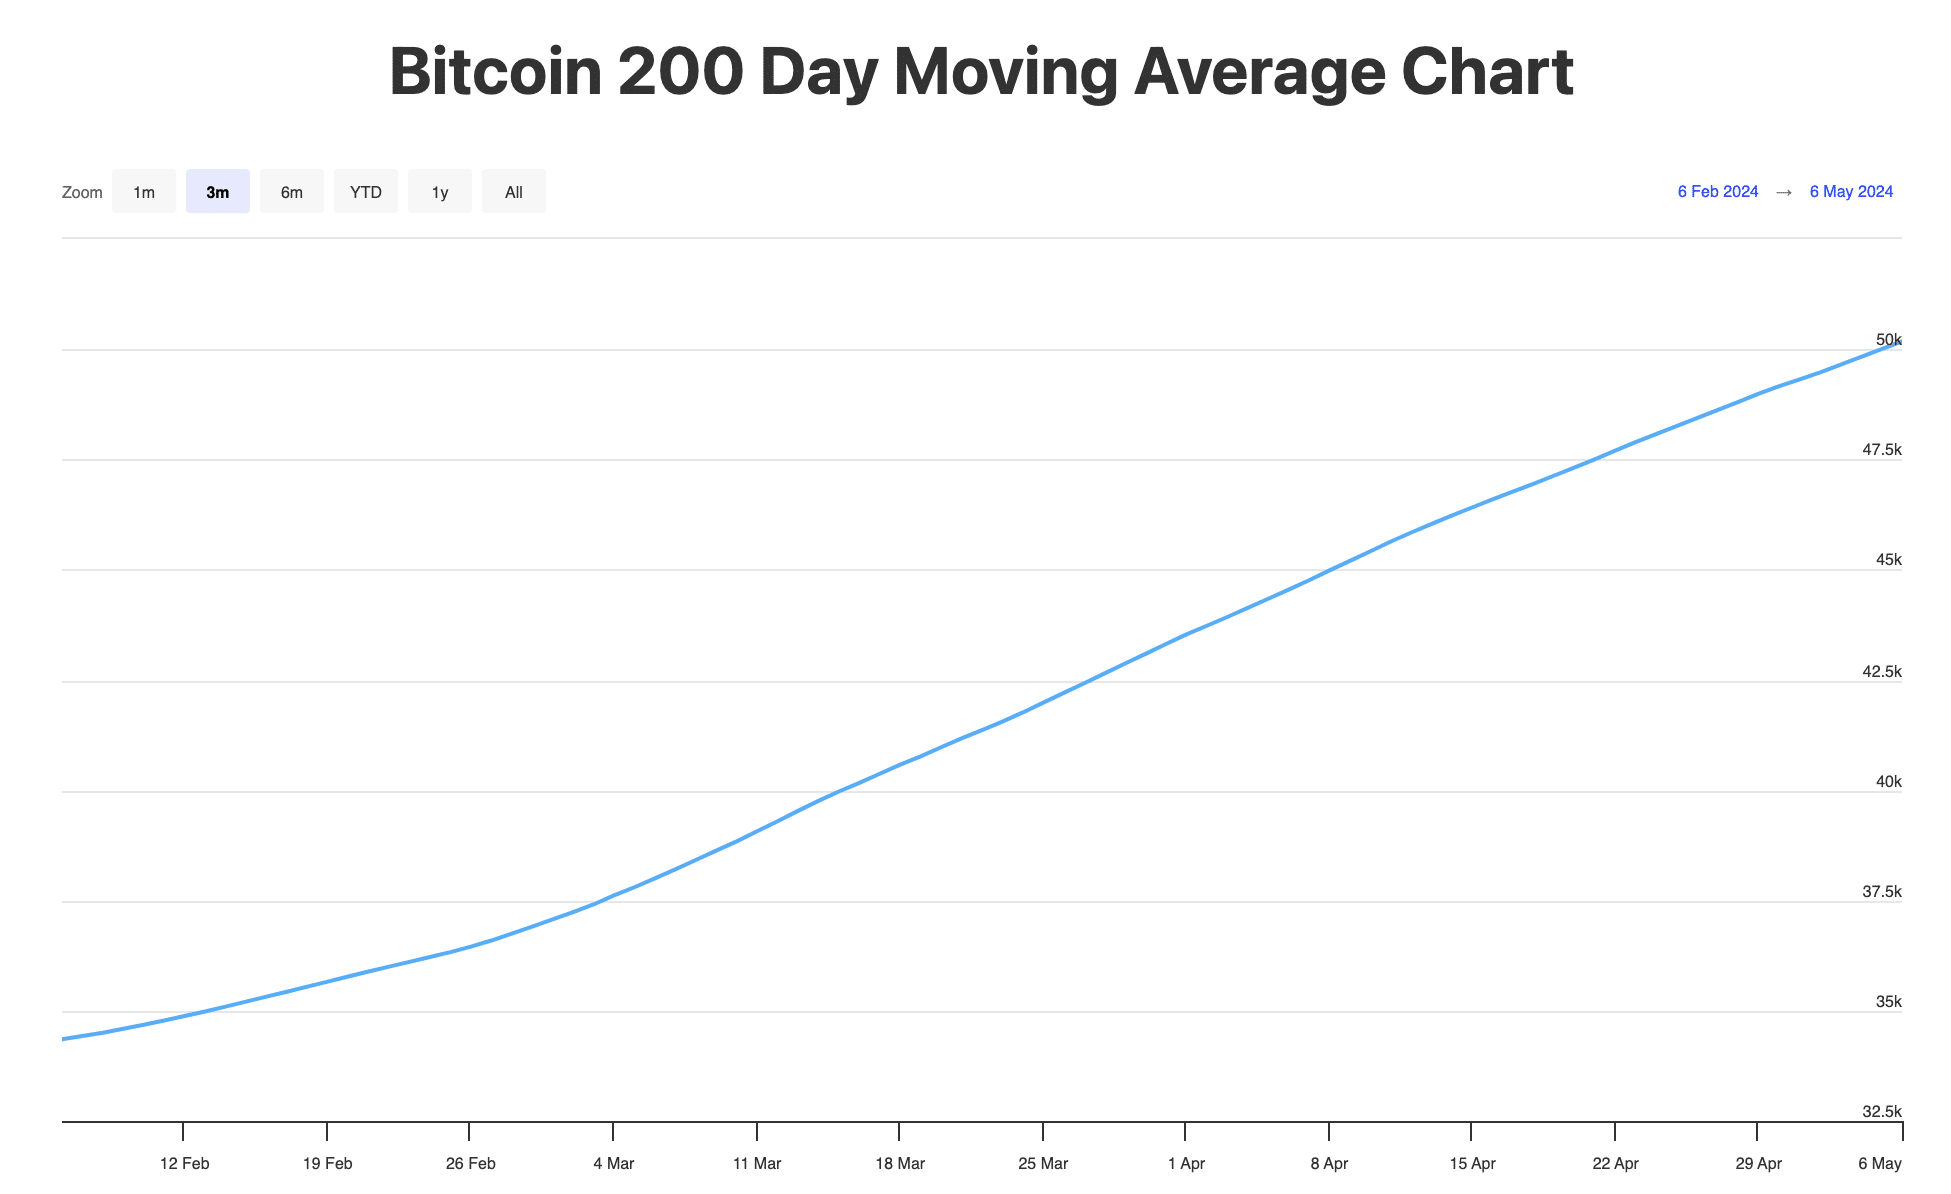
Source: BuyBitcoinWorldwide
The 200-day simple moving average (SMA), by smoothing out day-to-day price volatility, offers a clearer view of the underlying market trend.
At press time, Bitcoin’s price remained above this critical indicator, suggesting that the long-term momentum was bullish.
Further reinforcing this sentiment, the 200-day SMA’s robust performance aligned with insights from prominent Bitcoin enthusiast Anthony Pompliano.
Speaking on CNBC’s Squawk Box, Pompliano highlighted the significance of the indicator surpassing the $50,000 mark, emphasizing the continuous upward trajectory of Bitcoin despite its notorious day-to-day volatility.
He noted in a post on X,
“Don’t get lulled to sleep by bitcoin going sideways. The long-term thesis is as strong as ever.”
His remarks echoed a broader consensus among experts who believe in Bitcoin’s enduring value proposition, even as it experienced periodic price corrections.
Complex dynamics are revealed
Despite the optimistic long-term indicators, AMBCrypto’s look at Santiment’s data indicated a decrease in dormant Bitcoin circulation and active addresses in recent months.

Source: Santiment
This decline in dormant circulation particularly began in early March, just before Bitcoin reached new heights, hinting at a potential cooling off among long-term holders.
As for the dip in active address, it suggests a decrease in network activity. Such metrics introduce a note of caution amidst the generally positive landscape.
Read Bitcoin’s [BTC] Price Prediction 2024-25
Adding a layer of complexity, AMBCrypto recently reported that seasoned trader Josh Olszewicz has pointed out potential risks despite Bitcoin’s recent gains.
His analysis, using the Ichimoku Cloud, revealed that Bitcoin might still be navigating through potential market uncertainties, despite surpassing the $64,000 resistance level.