

Disclaimer: The findings of the following analysis are the sole opinions of the writer and should not be considered investment advice
Bitcoin sellers showed their presence at the $44k area, and in the past couple of months Bitcoin has been oscillating about the $40k level. The trend, which had been to the downside since October, might just have been broken. It was too early to be sure, and in the meantime, Bitcoin exhibited areas of interest for market participants. However, the most pertinent question here is- Could Bitcoin rebound higher in the months to come, despite the fear in the global markets?
BTC- 1D
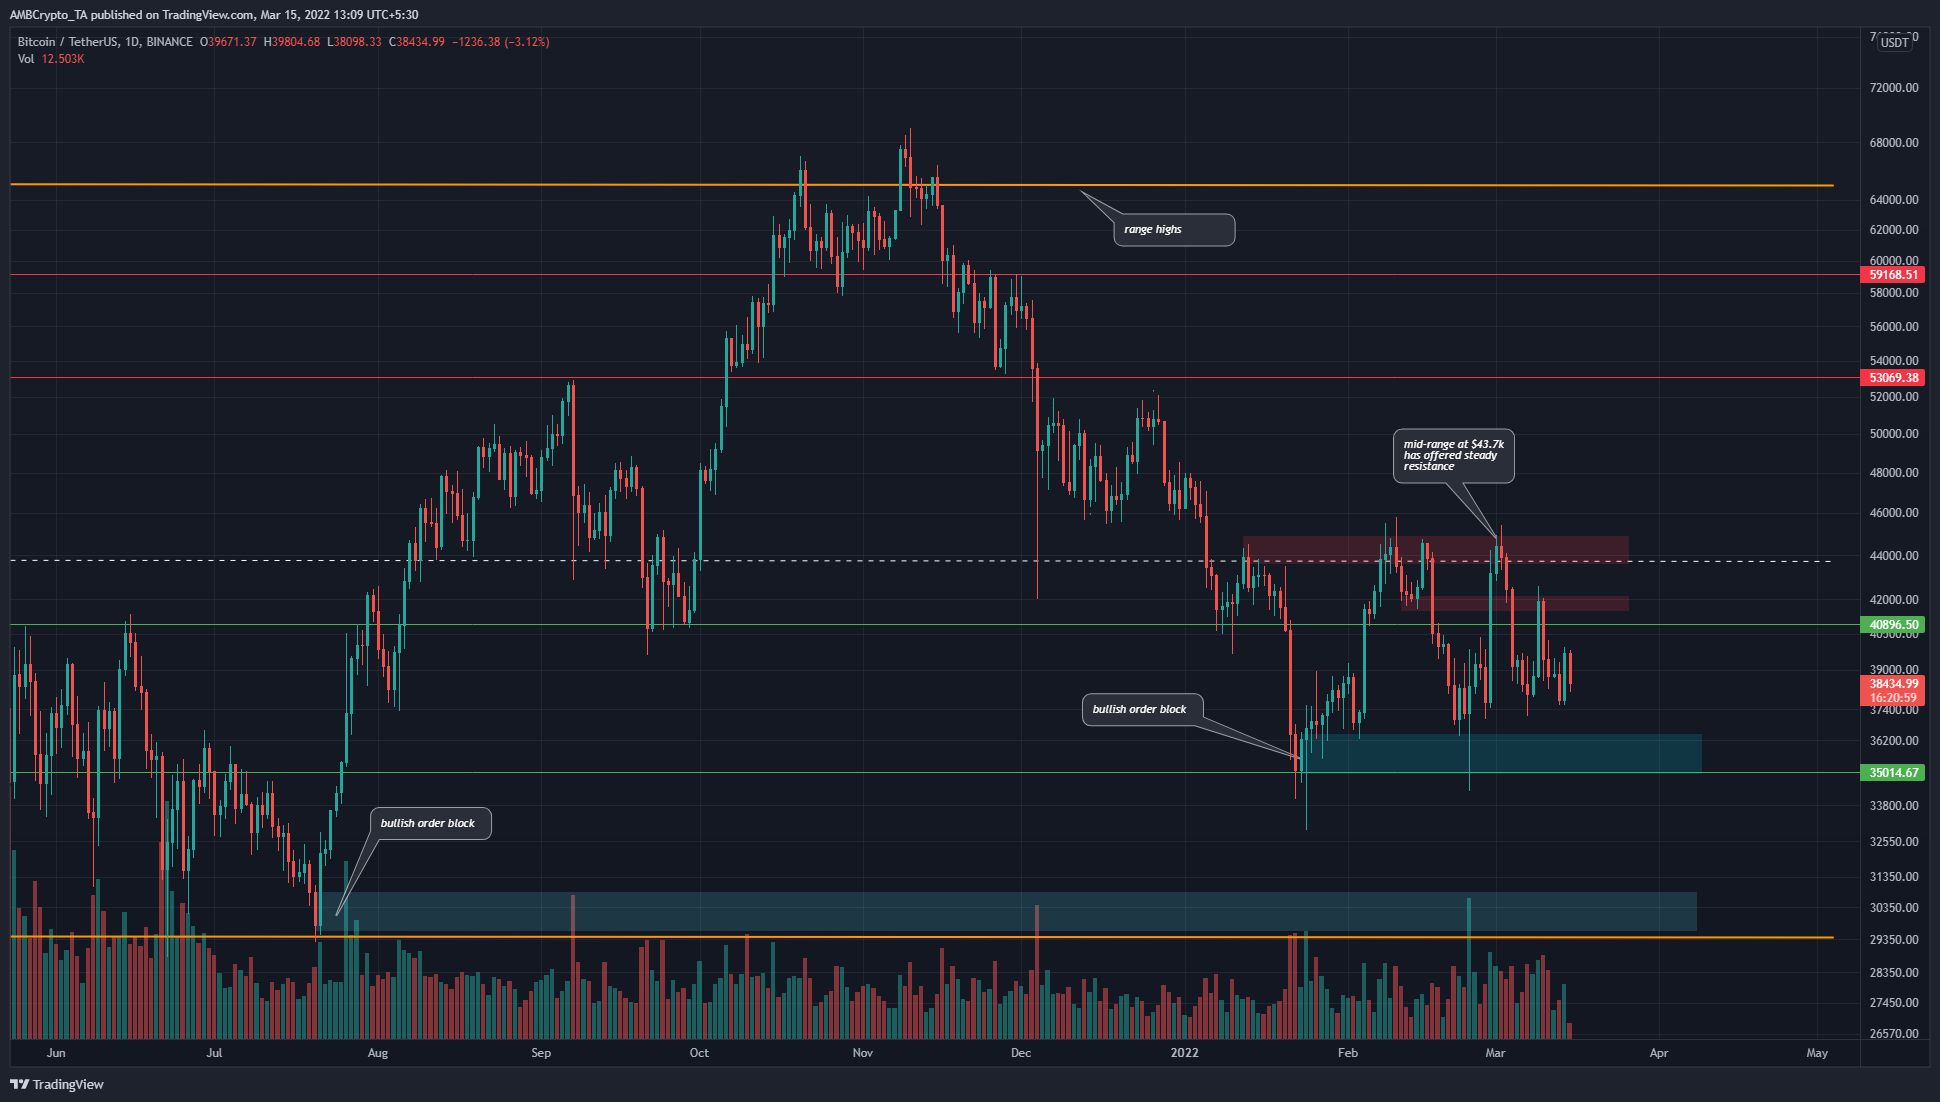
The cyan boxes highlight a couple of bullish order blocks for Bitcoin on the daily chart. These are areas where the price descended to, found buyers, and had a rapid, impulse bullish move away from.
The July one in the $30k area had already been tested in May and June multiple times. Moreover, this area represented the lows of a range (orange) that Bitcoin has been trading within for nearly 15 months.
In the next few days, the $35k-$37k area could see demand, and rise to the $41.5k-$42k area (red box). The $42k and $44k zones are likely to be full of sellers. Moreover, the $43.7k level represents the mid-point of the long-term range for BTC.
Bitcoin has been setting higher lows since late January. The November-January downtrend’s latest lower high at $44.5k has been broken in February. Despite the fearful market conditions, the longer-term market structure for Bitcoin could have flipped to bullish. Hence a revisit to $35k could be a buying opportunity.
Rationale
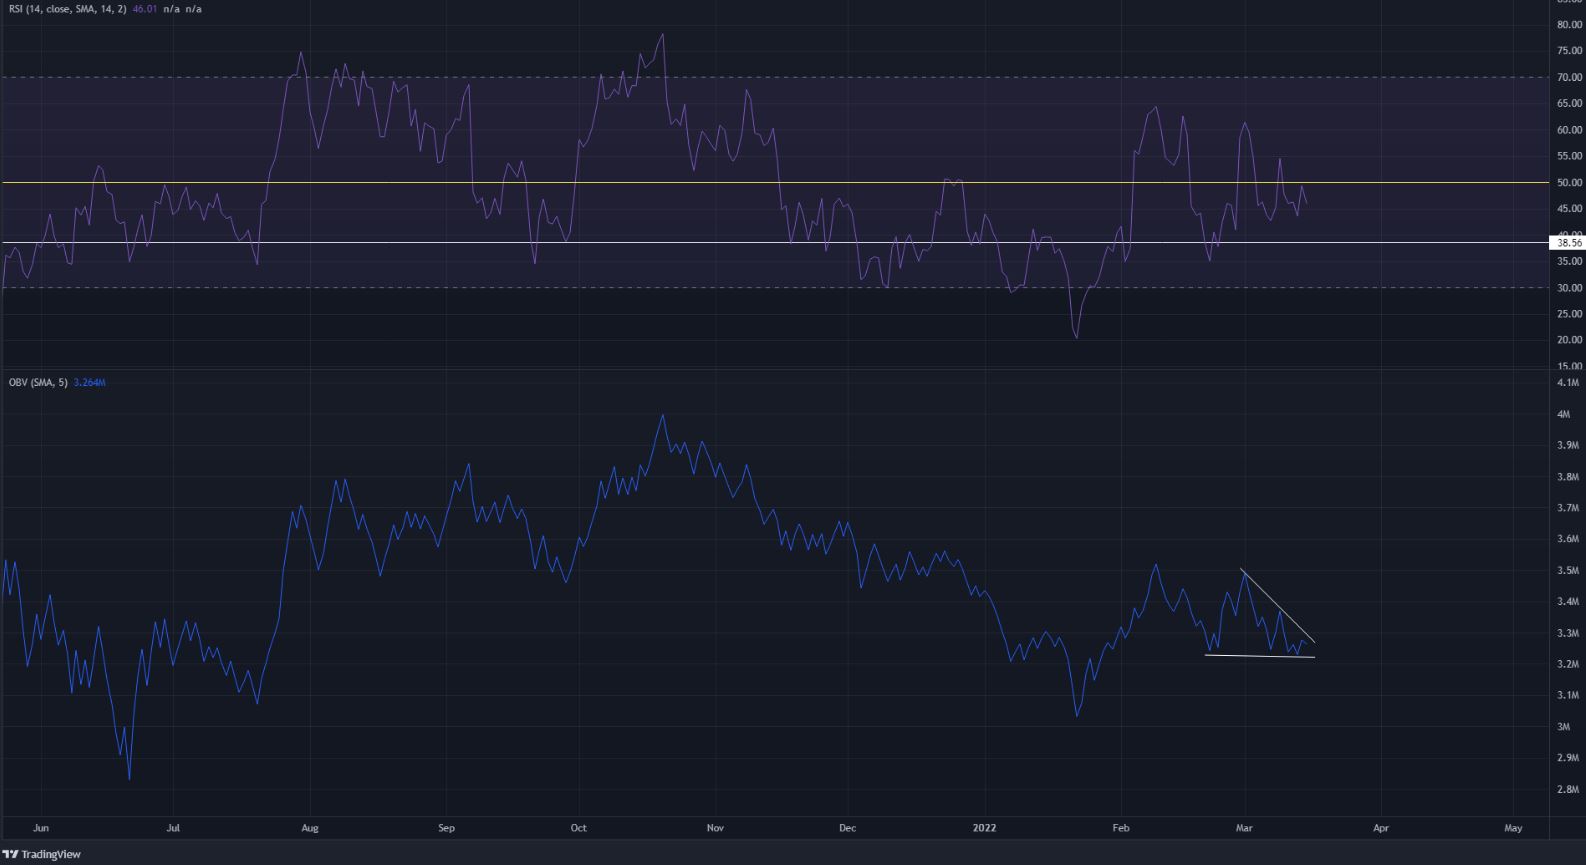
The RSI was at 45, and in the past two months, it has been between 40 and 60, which meant the momentum had not been strongly in favor of either side in 2022. A move past either level could see the next leg for BTC.
The OBV has seen some demand in early January but has been on a downtrend since October when BTC reached ATH. At press time it was once more descending lower.
Conclusion
The price action and the indicators showed that further downside was a possibility for BTC. A move below 40 on the RSI could be used to prepare for opportunities to buy Bitcoin at or just beneath the range lows. Conversely, the $44k area can be used to sell BTC. The mid-range at $43.7k and the local highs at $45.8k are levels to beat before the longer-term bias can be considered to have shifted.