
Bitcoin dipping down to $6500 had the whole cryptocurrency community in tears, with much of the market brimming with negative sentiment. And while the world’s largest crypto did climb over $7500, it wasn’t there for long. Valued at $7475 at the time of writing, Bitcoin maintained its dominance with a market capitalization of nearly $137 billion, with $18.5 billion worth of BTC traded over the last day, according to CoinMarketCap. It was traded most on the BKEX exchange, which accounted for over 3% of its trade volume over a 24 hour period.
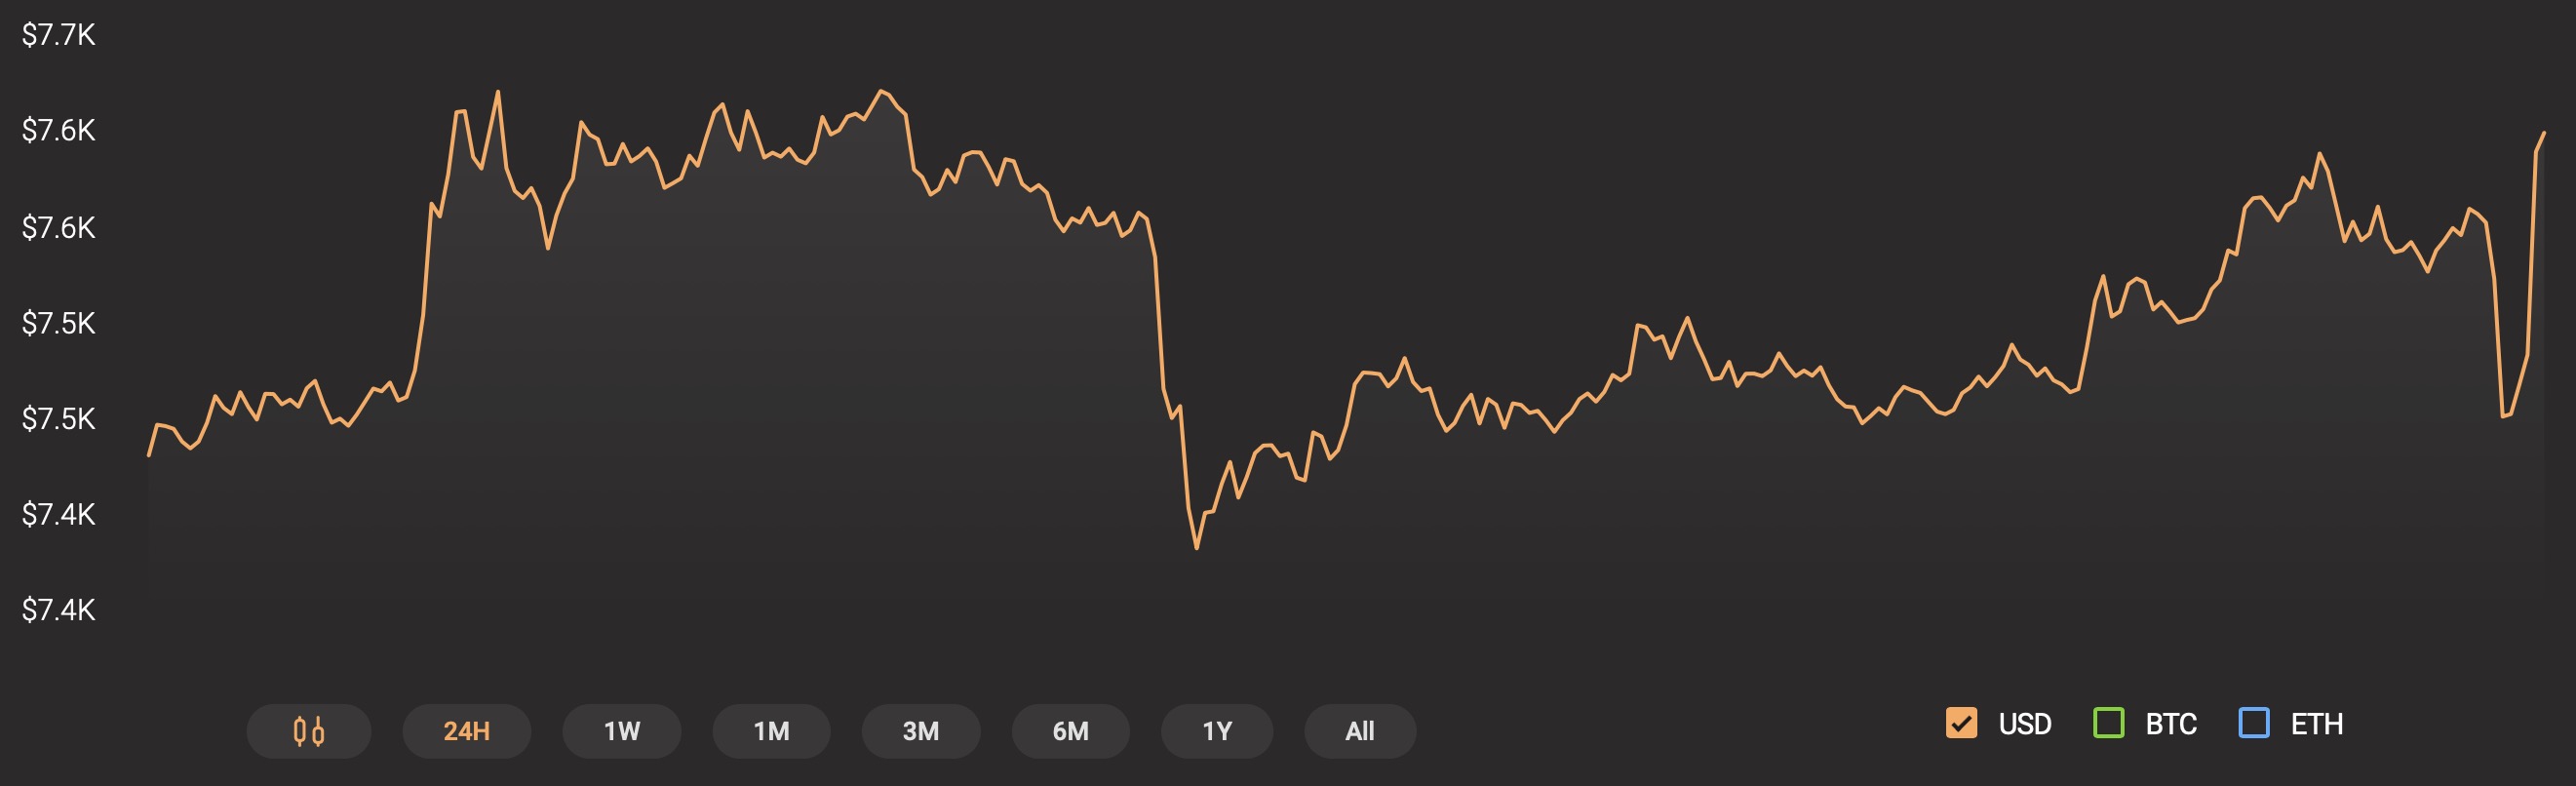
Source: CoinStats
Bitcoin 1-day chart
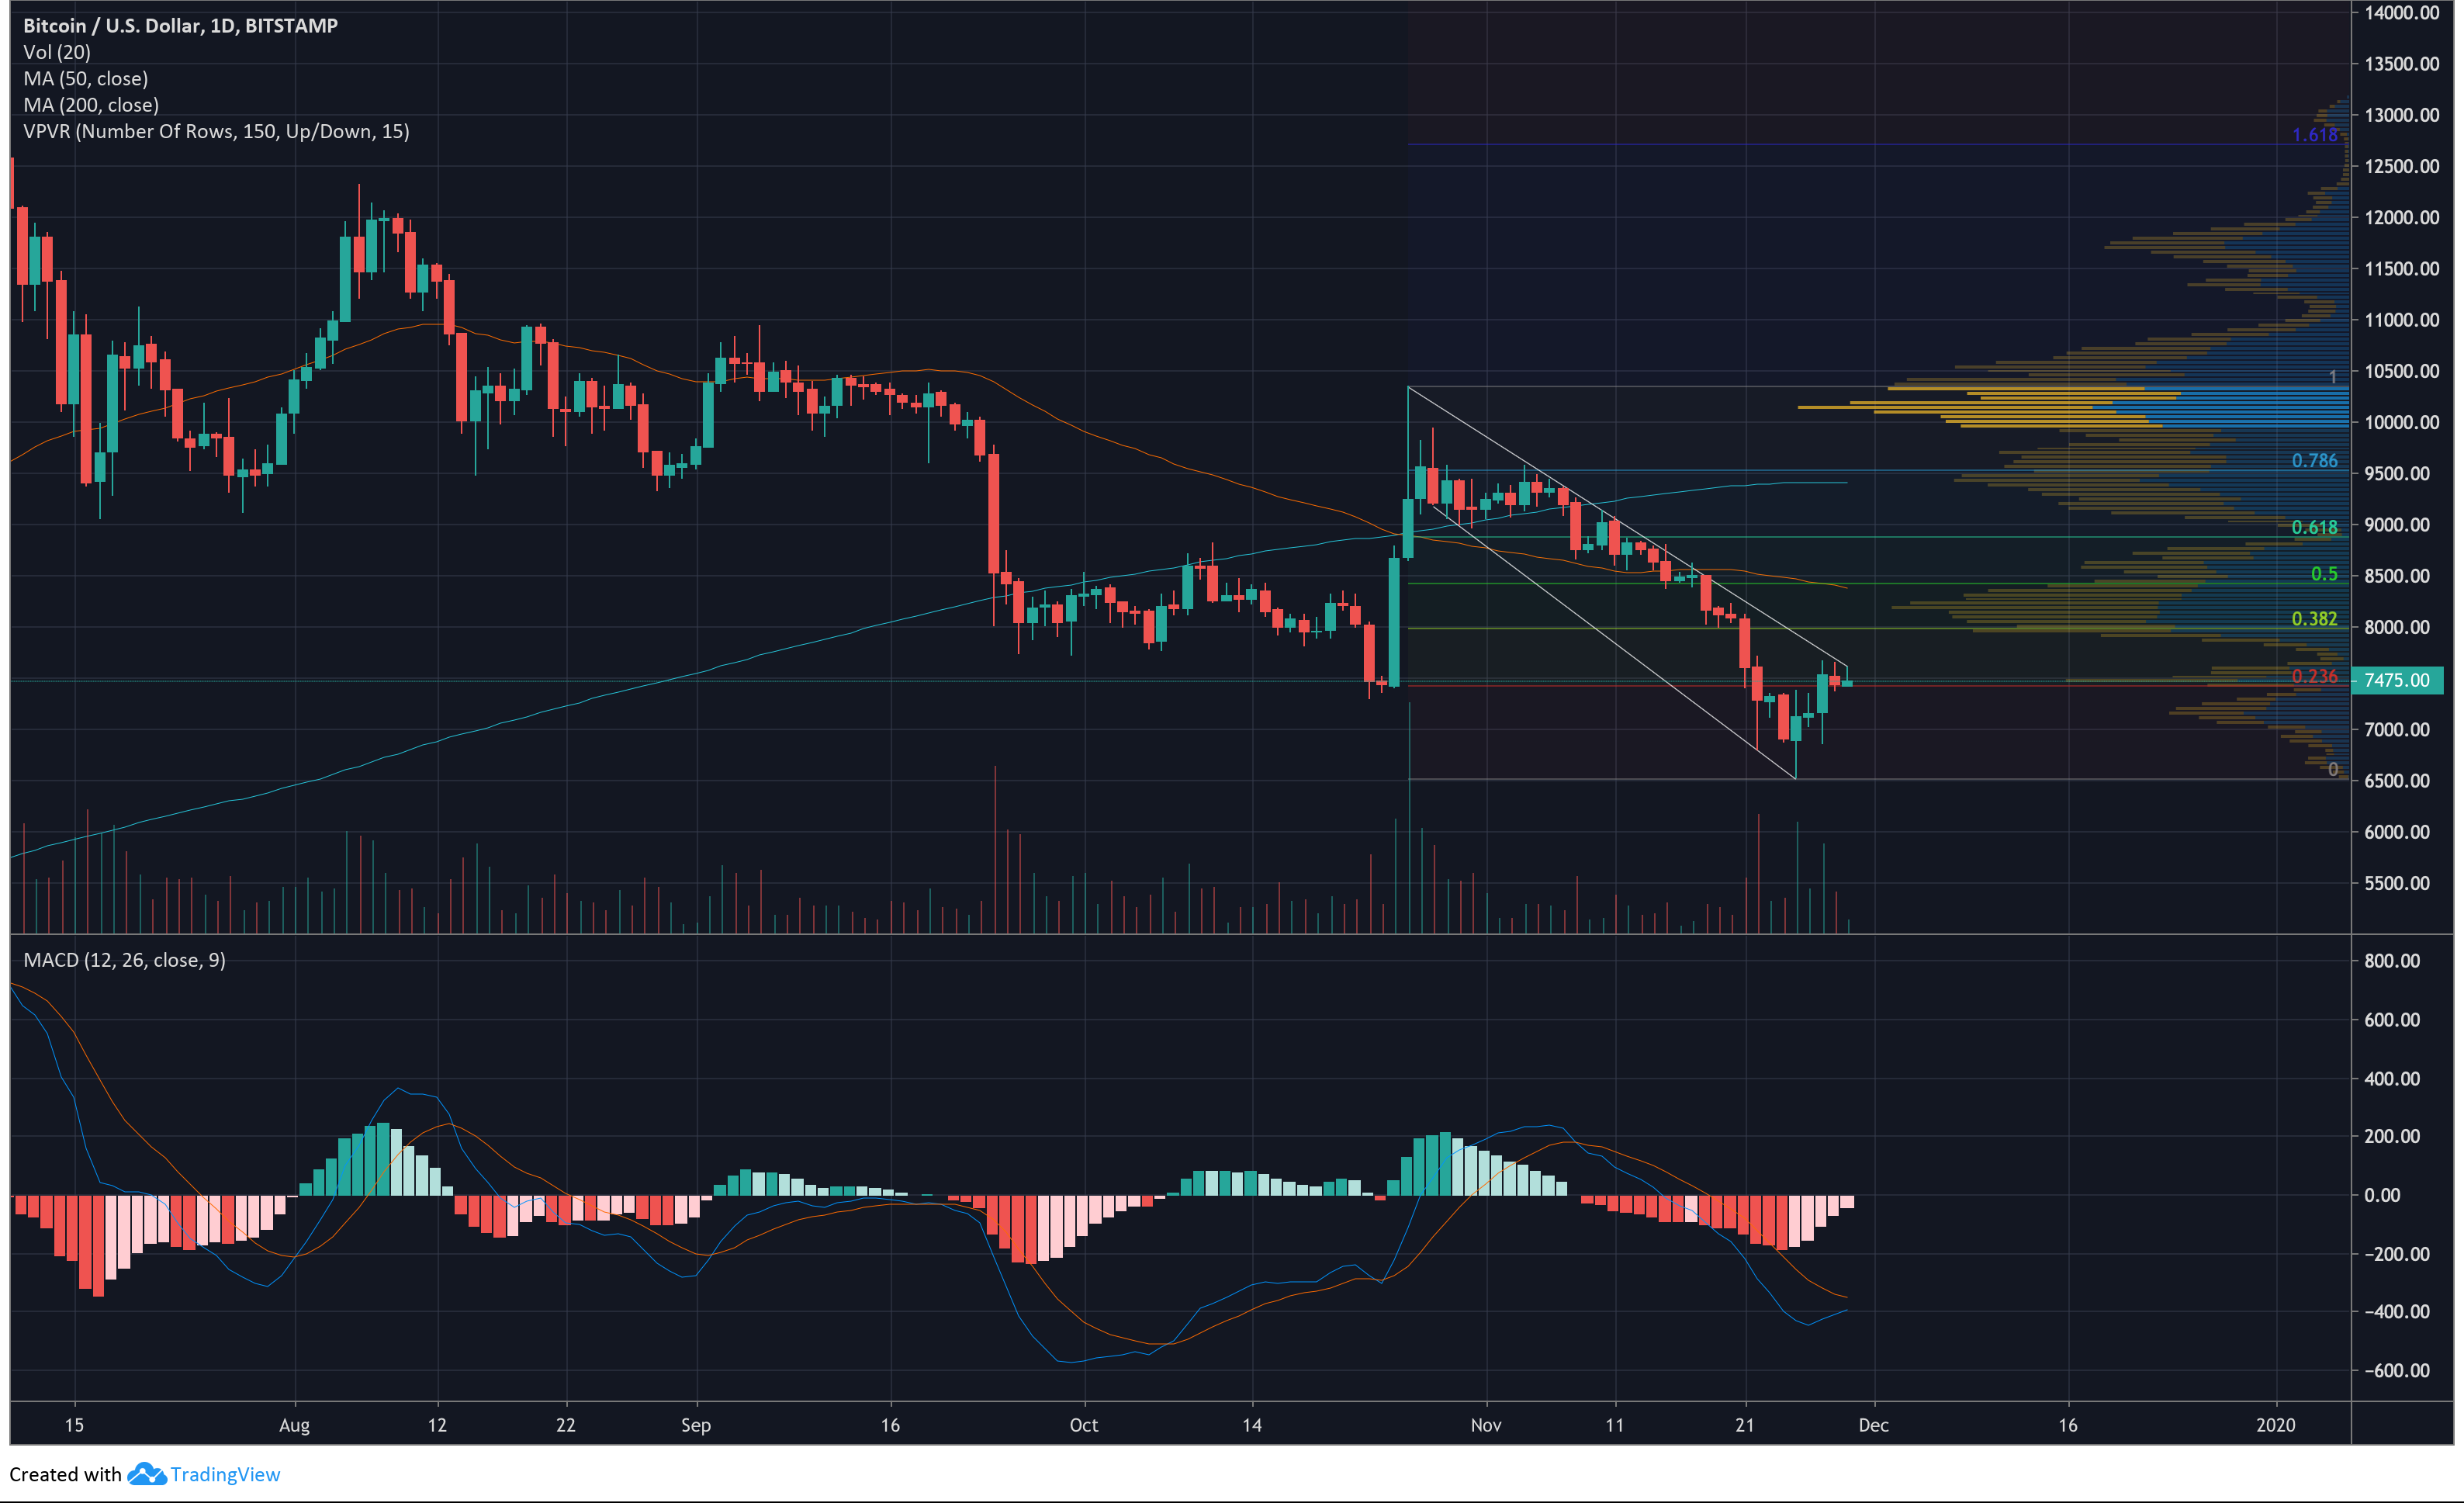
Source: BTCUSD on TradingView
A look at the 1-day chart showed a descending broadening wedge pattern encompassing the price movement of Bitcoin since late-October. These patterns are not usually accompanied by any discernible volume trend, though the above chart showed the trend decreasing. A spike in volume as the price touches the trend lines tends to signify a breakout, and since Bitcoin seemed to be close to the upper trend line, the low volumes likely signify a bounce back into the pattern.
Descending broadening wedges reverse the incoming trend in 75% of cases, making the bearish case for Bitcoin a little stronger this time around, as the price entered the pattern through a rise in value.
The 50 and 200-day moving averages could both be seen moving over the price line, having applied bearish pressure on BTC since the death cross which occurred toward the end of October. Both moving averages showed no signs of crossing down under the price, and since both are fairly reliable indicators of long-term performance, it is likely that Bitcoin will fall for the next few weeks.
The MACD indicated a bearish market as the signal line could be seen hovering just above the MACD line between the -300 and -400 marks. However, the MACD line looked poised for a crossover above the signal line, and with decreasing bearish momentum, this could be a possibility.
The Volume Profile Visible Range indicator showed that BTC is currently in a high-volume node region, an area of relative stability. However, the decreasing trend in trade volume could push it down to $7150. In the long term, if it fails to breach the 23.6% Fibonacci retracement line, it seems likely Bitcoin will bounce off the top trend line and continue down the pattern back under $6500 by mid-December as indicators seem to favor a bear market. If BTC manages to break out of the pattern, however unlikely, we could see a move to $8500 over the same period of time.