Bitcoin miners get rid of BTC worth over $430M – Why?
Bitcoin miner reserve has witnessed a decrease following a drop in miner netflow to a yearly low.

- Bitcoin miner netflow fell to its lowest level since the year began on 17th January.
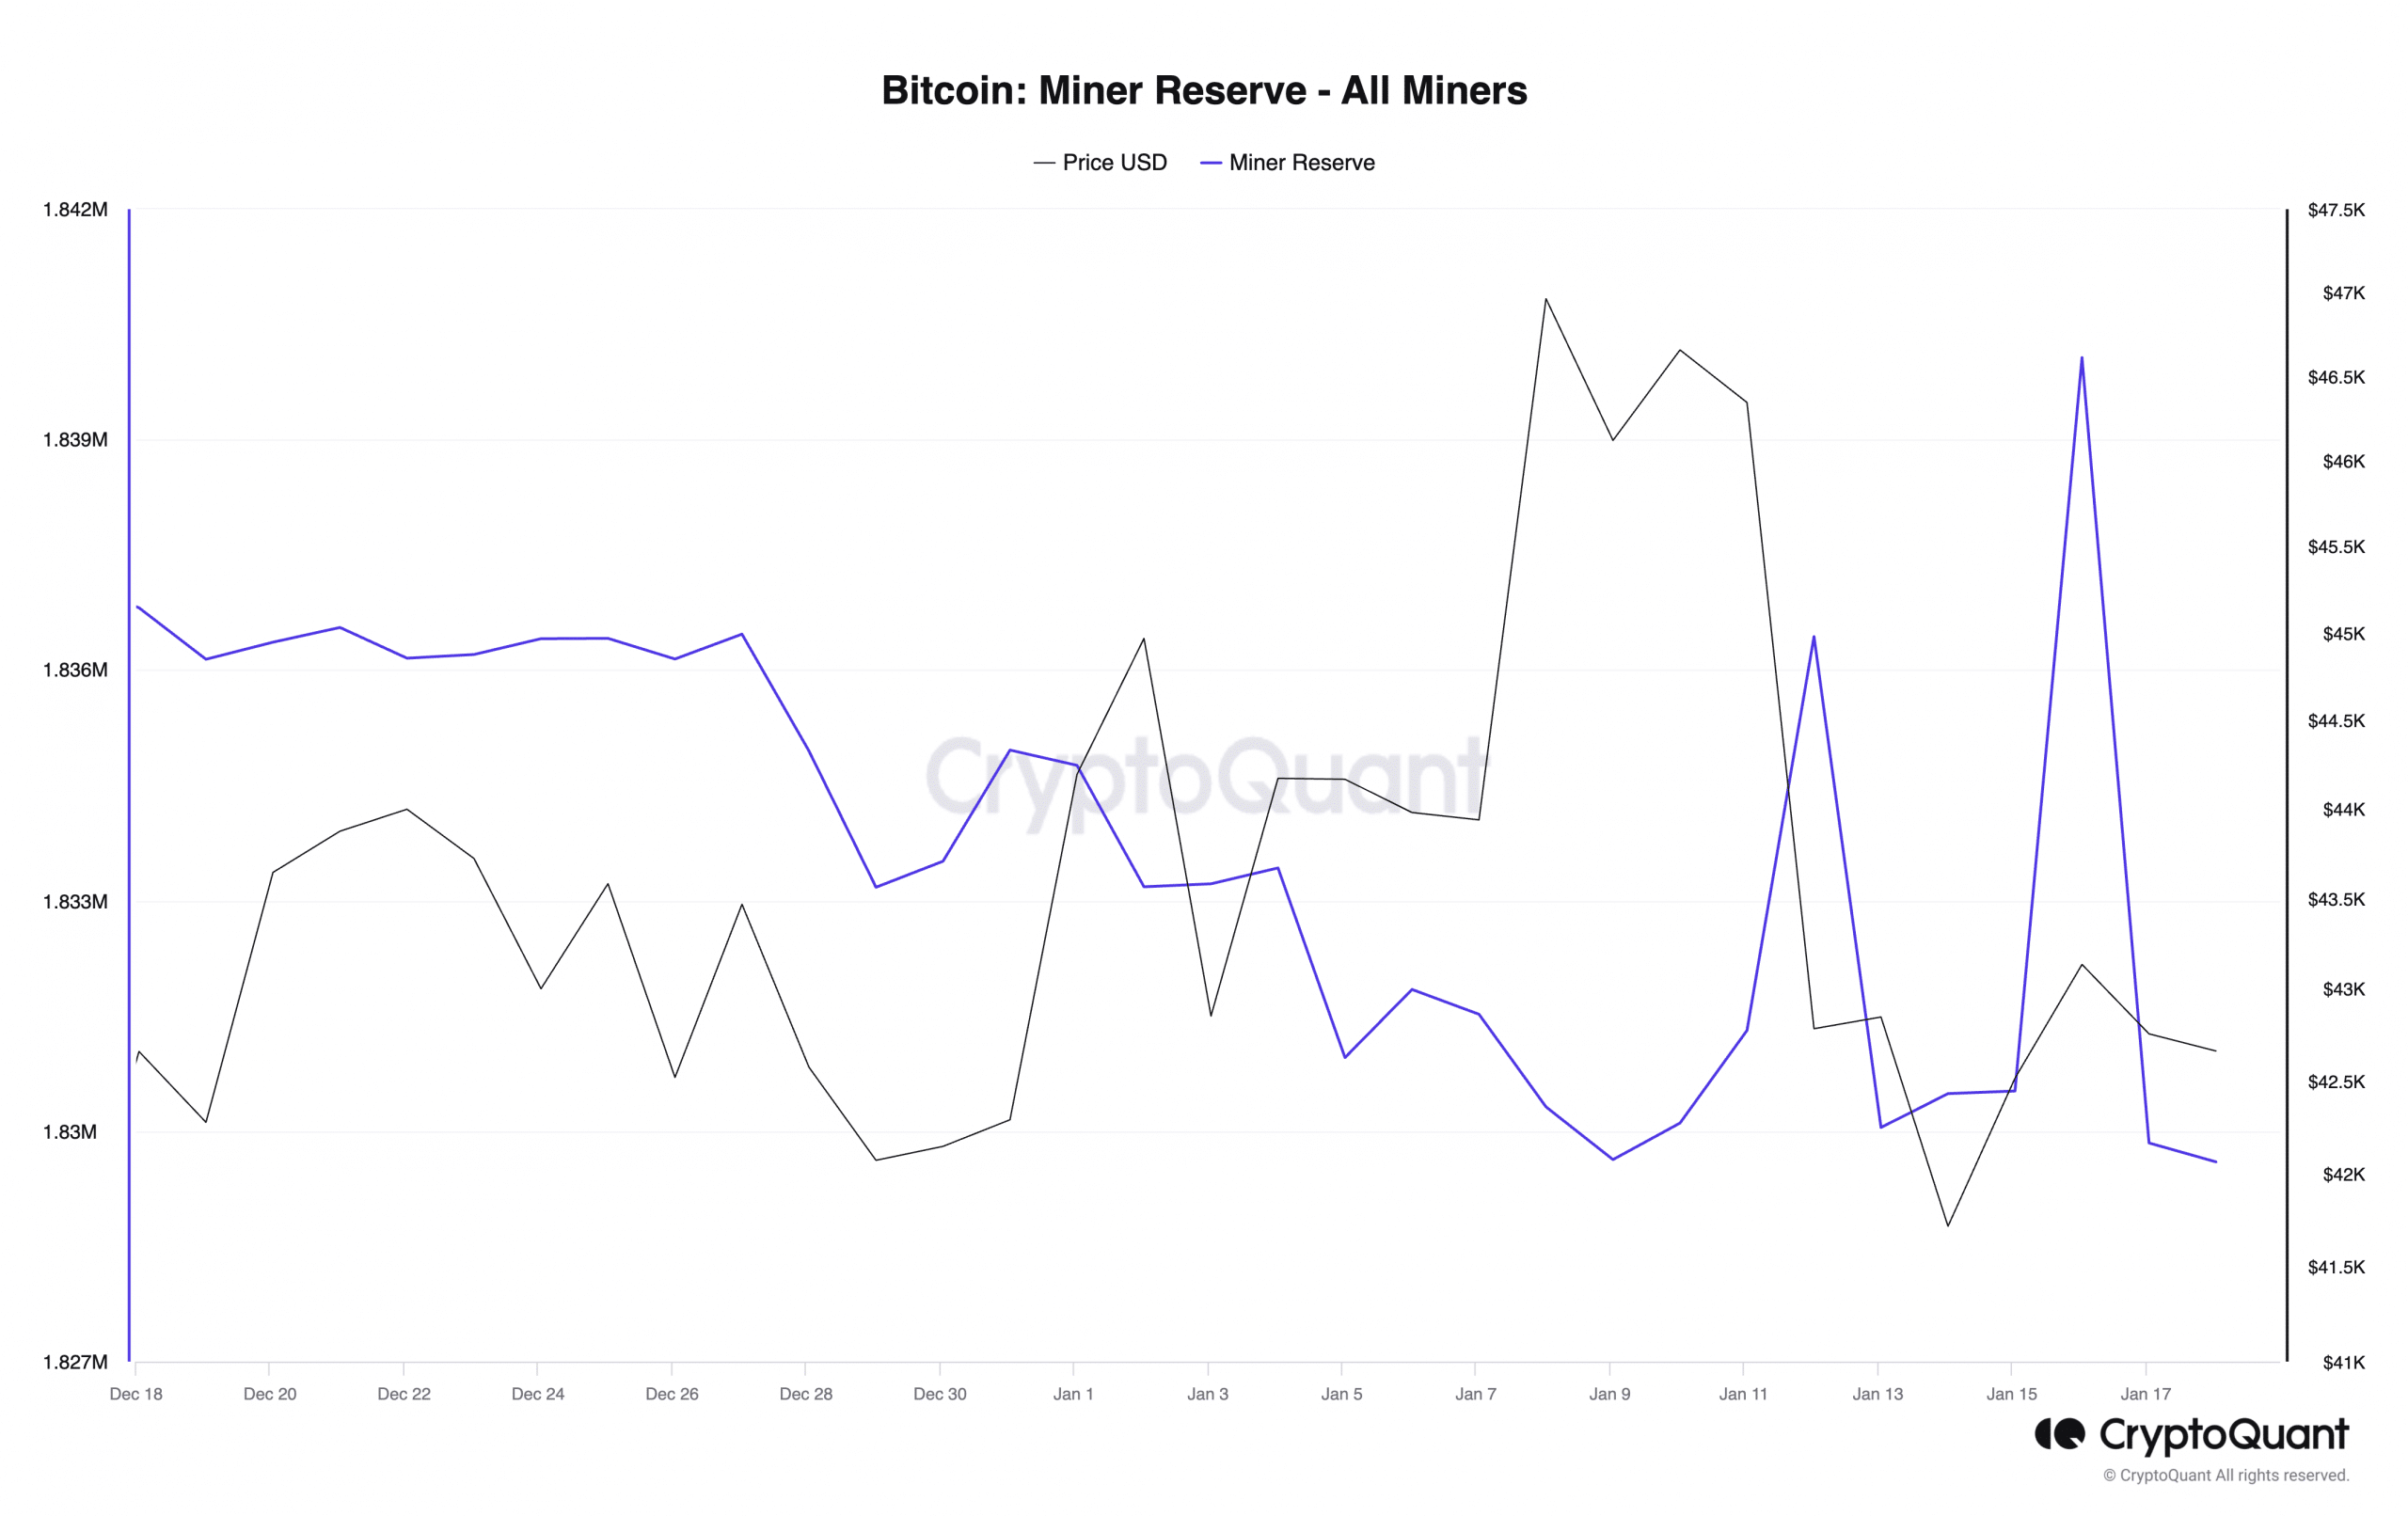
- This marked a significant decline in BTC miner reserve.
Bitcoin [BTC] Miner Netflow plunged to its lowest level of the year on 17th January, indicating a significant drop in miner reserves, data from CryptoQuant showed.
According to the on-chain data provider, on that day, over 10 thousand BTC worth around $436 million at the coin’s press time price were sent to exchanges for onward sales.
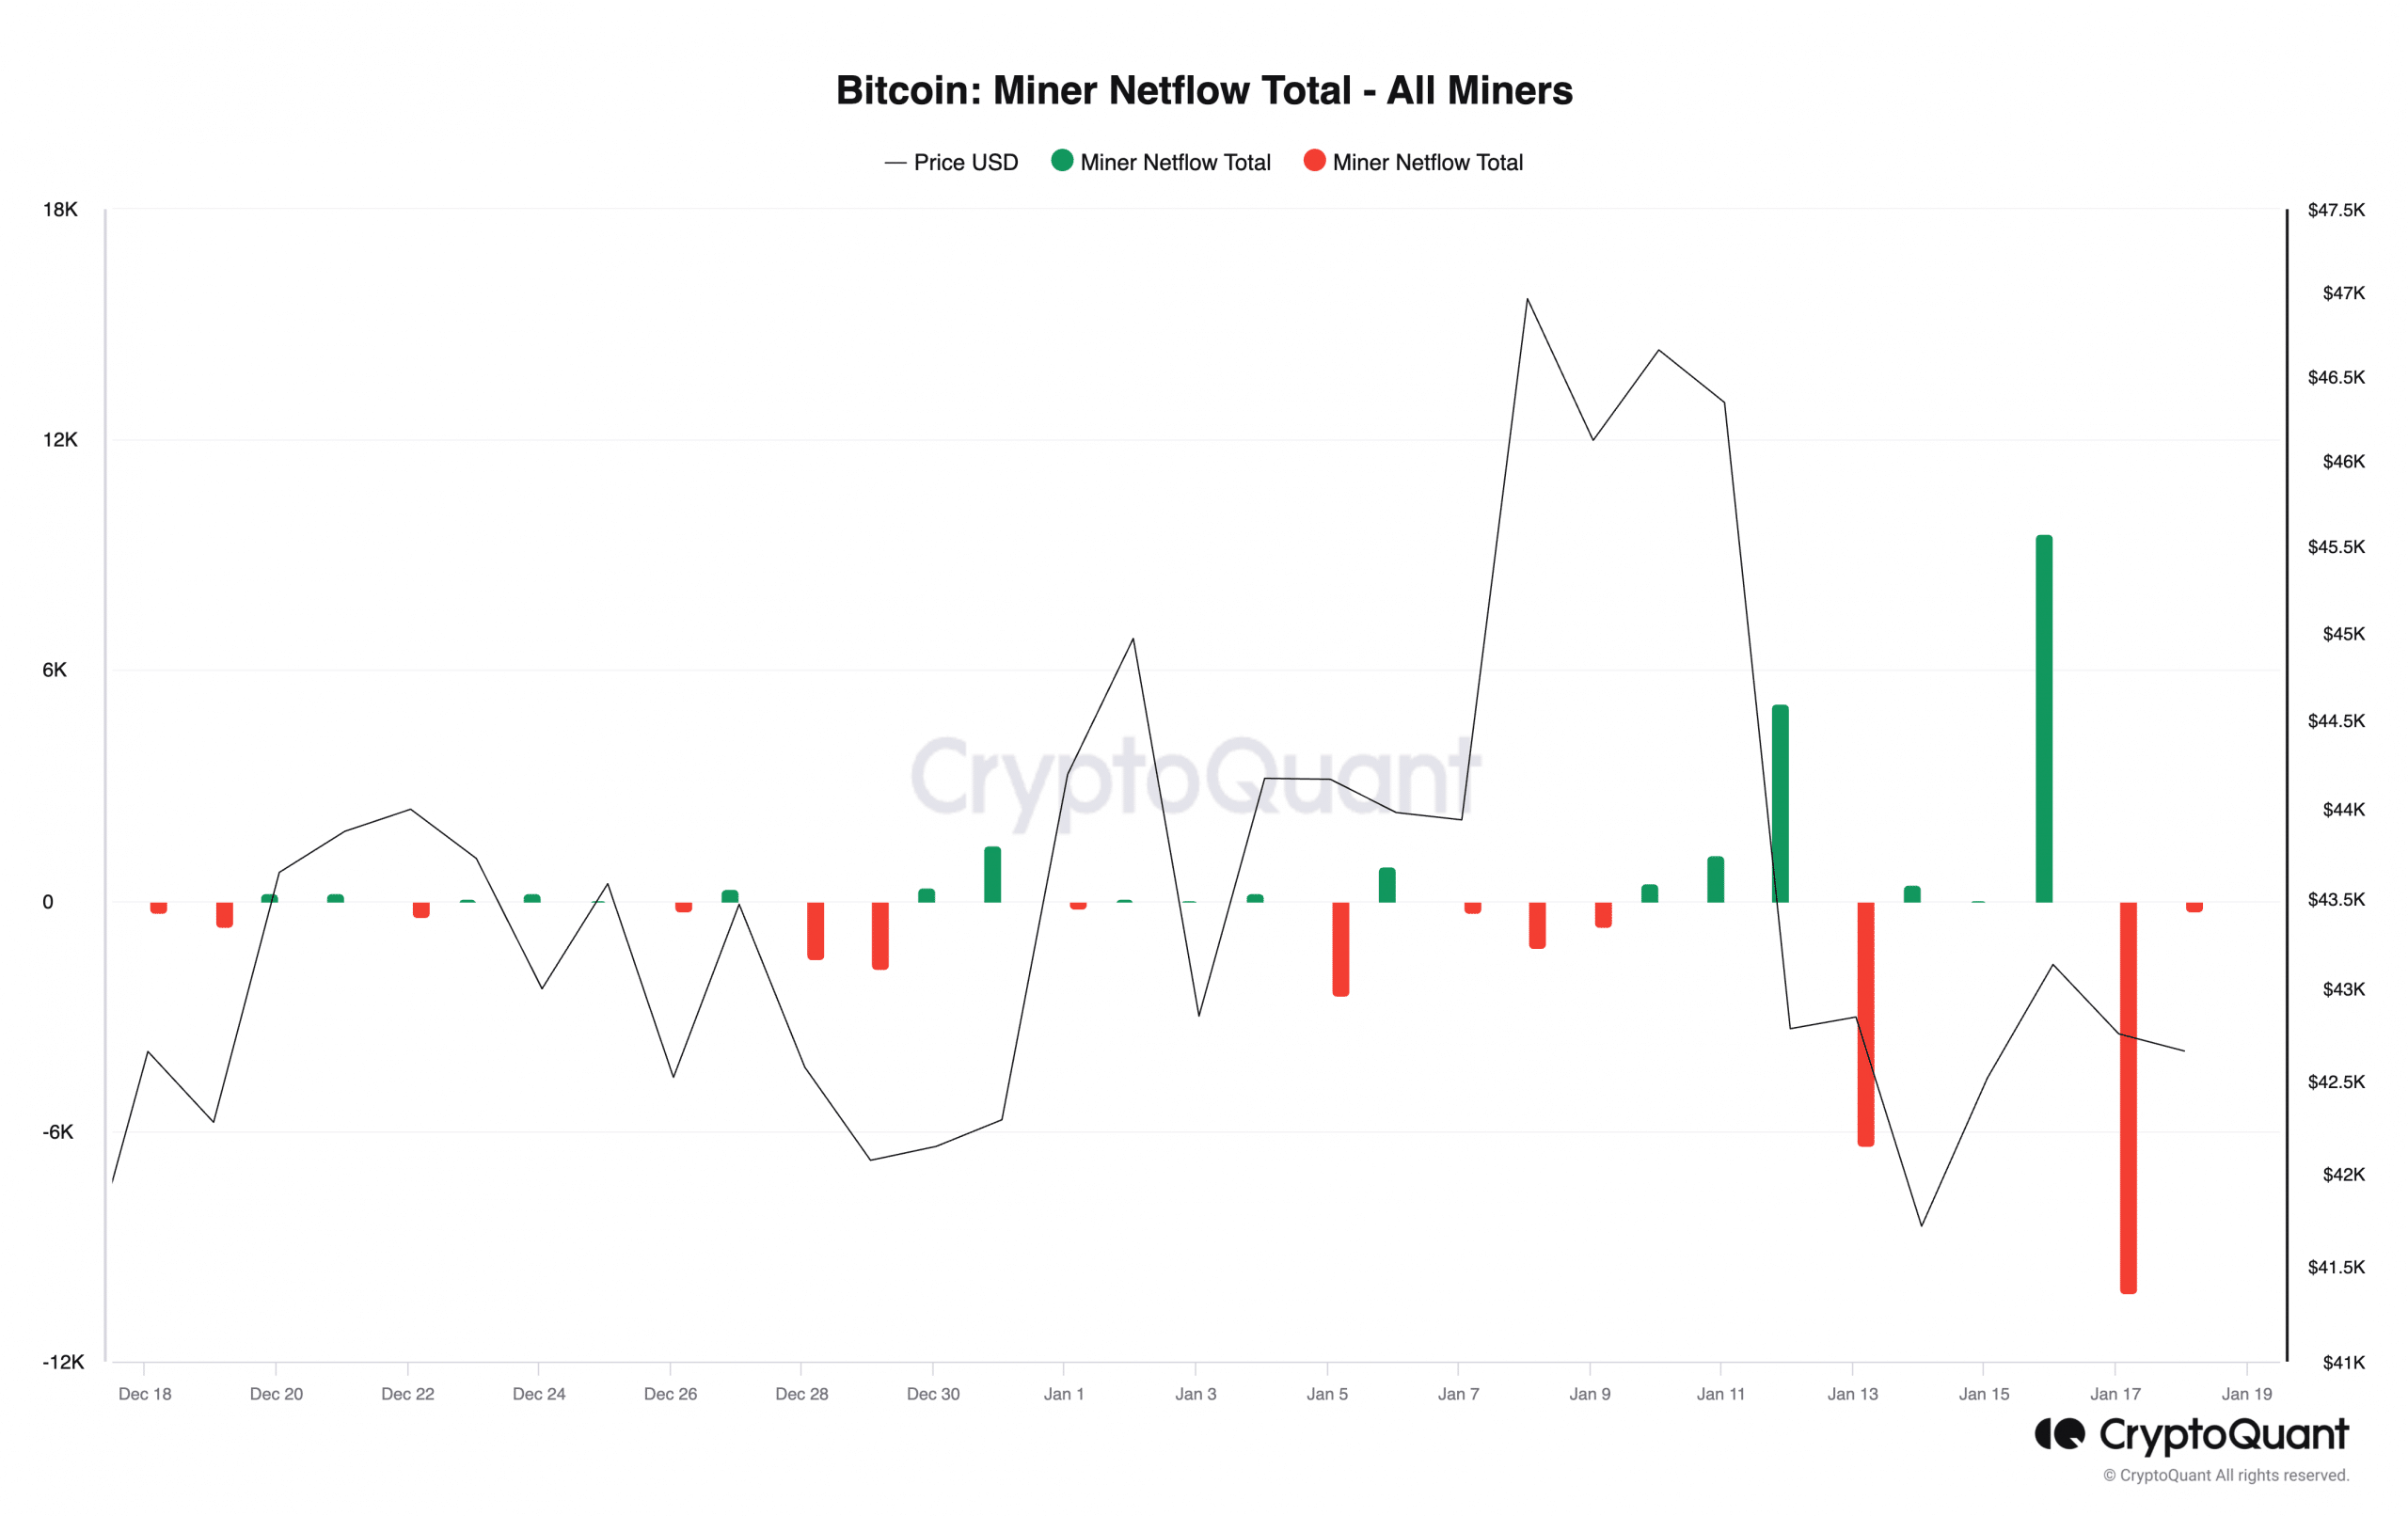
When BTC’s Miner Netflow declines in this manner, it results in a corresponding decrease in miner reserves which measures the amount of coins held in affiliated miners’ wallets within the period under review.
On 17th January, BTC’s miner reserve fell by 1%, plummeting to its lowest level since the year began. According to data from CryptoQuant, on that day, 1.82 million BTC were held across all existing miners’ wallets.
In a recent report, CryptoQuant analyst Woo Minkyu commented on the impact of the decline in BTC’s Miner Netflow and reserves.
“This trend could signify miners’ strategies for securing long-term operational funds. Selling Bitcoin on the market to offset mining and operational costs is a typical part of their business activities. To sum up, such significant sell-offs by miners can influence the market in various ways, potentially leading to short-term price fluctuations for Bitcoin.”
Bitcoin in the last week
At press time, BTC exchanged hands at $42,695, logging an 8% price decline in the last week, according to data from CoinMarketCap.
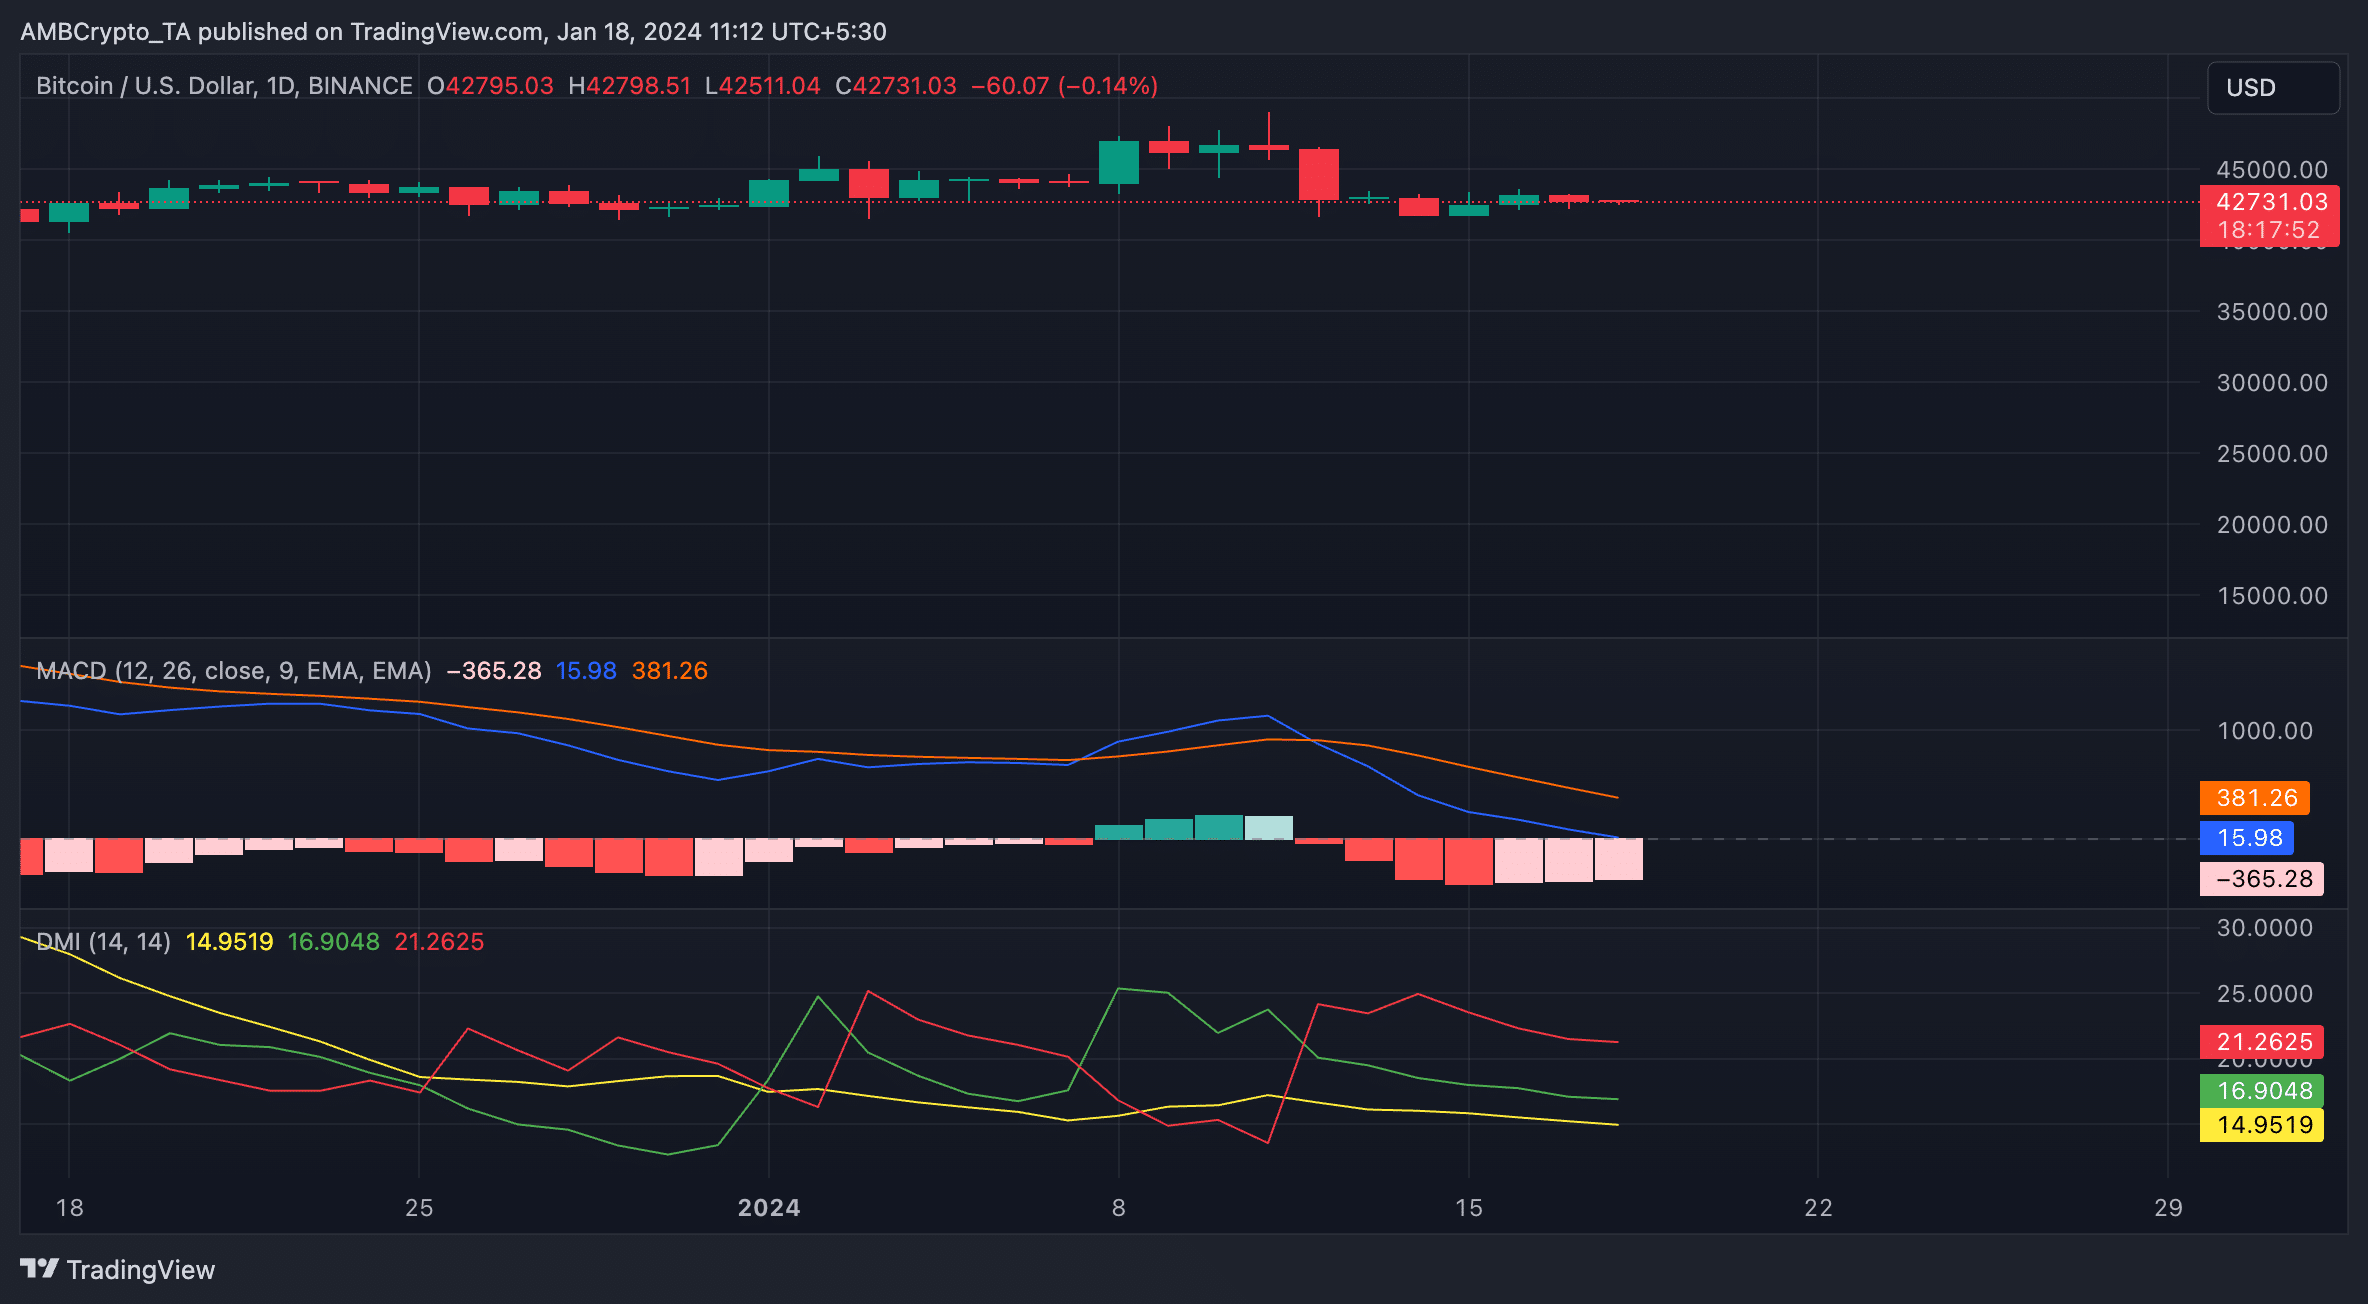
AMBCrypto’s assessment of the coin’s price movements on a daily chart revealed that the price fall in the last week represented a direct response to the bearish trend, which has dominated the market since 12th January.
According to readings from BTC’s Moving average convergence/divergence (MACD), BTC’s MACD line crossed below the trend line on that day and has since posted only red histogram bars.
The downward crossover of an asset’s MACD line with its trend line suggests that the upward momentum of the market is waning. It also suggests that a bearish trend might be developing.
Those accumulating the asset would see it as a warning sign as it suggests a bearish shift in market dynamics.
Confirming the bearish shift in sentiment, at press time, BTC’s positive directional index (green) at 16.90 was pegged below its negative directional index (red), which returned a value of 21.26.
Read Bitcoin’s [BTC] Price Prediction 2023-24
Similarly, the red line crossed above the green line on 12th January, lending further credence to the above position.
When a coin experiences this type of intersection, it connotes that the strength of the bears has exceeded that of the bulls, and a price drawdown is to be expected.