Bitcoin mining status – No more selling? Here’s what that means and doesn’t mean

- Bitcoin miners’ reserves have moved up after weeks of decline
- BTC’s price chart remained red, while a few indicators were bearish too
Bitcoin [BTC] miners have always played a crucial role in deciding the path BTC takes in terms of its price action. Hence, it’s worth looking at a particular trend recently seen on the mining front, one that can possibly spur a hike in the crypto’s price in the coming days.
Bitcoin miners are willing to HODL
Crypto Dan, an analyst and author at CryptoQuant, recently shared an analysis which underlined this very trend. After the fourth BTC halving, mining rewards declined. As a result, mining activity fell and miners began selling Bitcoin in OTC transactions to cover mining operation costs. However, according to the analysis, this trend soon changed,
“The current market can be seen as being in the process of digesting this sell-off, and fortunately, the quantity and number of bitcoins miners are sending out of their wallets have been rapidly decreasing recently.”
This meant that selling pressure from miners diminished, which might create a situation where BTC could regain bullish momentum.
An interesting, similar decline in selling pressure from miners was seen in 2023 and 2024. On both occasions, a drop in selling pressure was followed by massive bull rallies. Therefore, as the second quarter of this year is coming to an end, BTC might begin its bull rally in Q3.
Will miners initiate a rally?
Julio Moreno, a popular crypto-analyst, also shared a tweet highlighting another interesting development. As per the same, BTC’s miner capitulation has reached levels comparable to December 2022 – A 7.6% drawdown.
In 2022, this incident indicated a market bottom. If history repeats itself, then BTC might soon flip bullish.
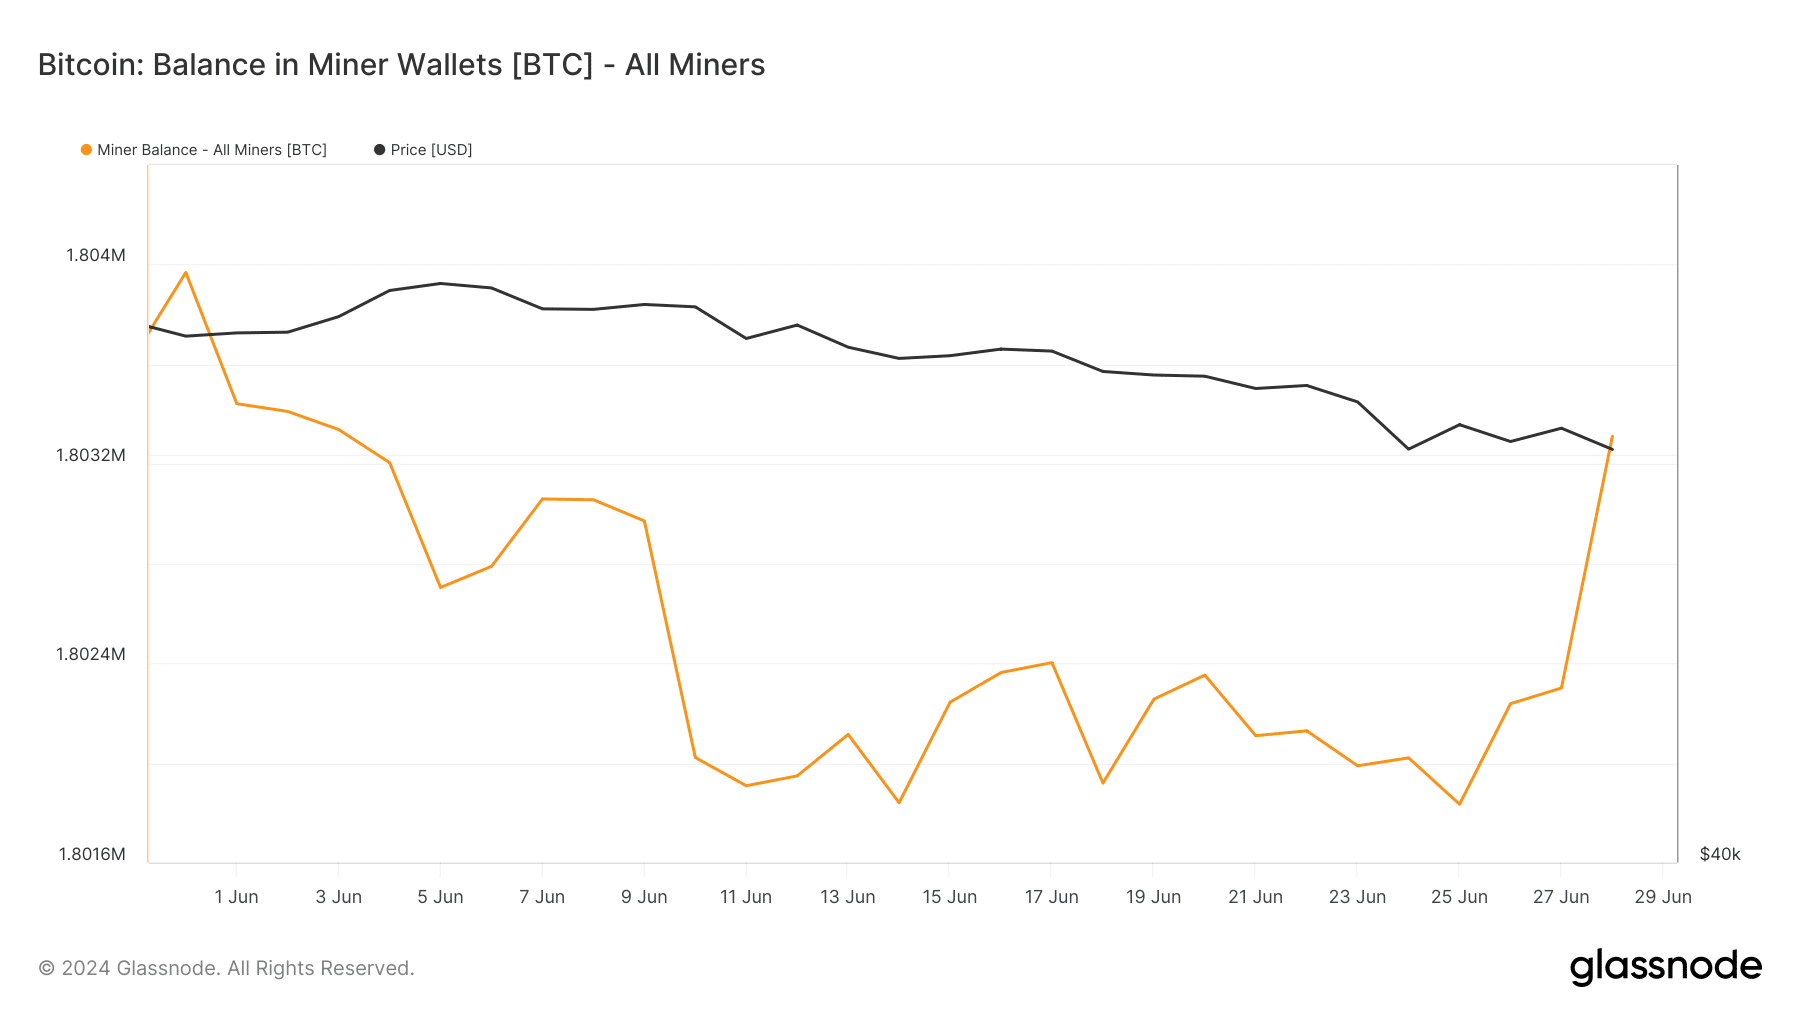
Additionally, our analysis of Glassnode’s data revealed that after a decline, BTC miners’ reserves started to rise, meaning that miners have been buying BTC. Finally, as per CryptoQuant, BTC’s net deposit on exchanges seemed to be high, compared to the last seven days’ average – Indicating a hike in buying pressure.
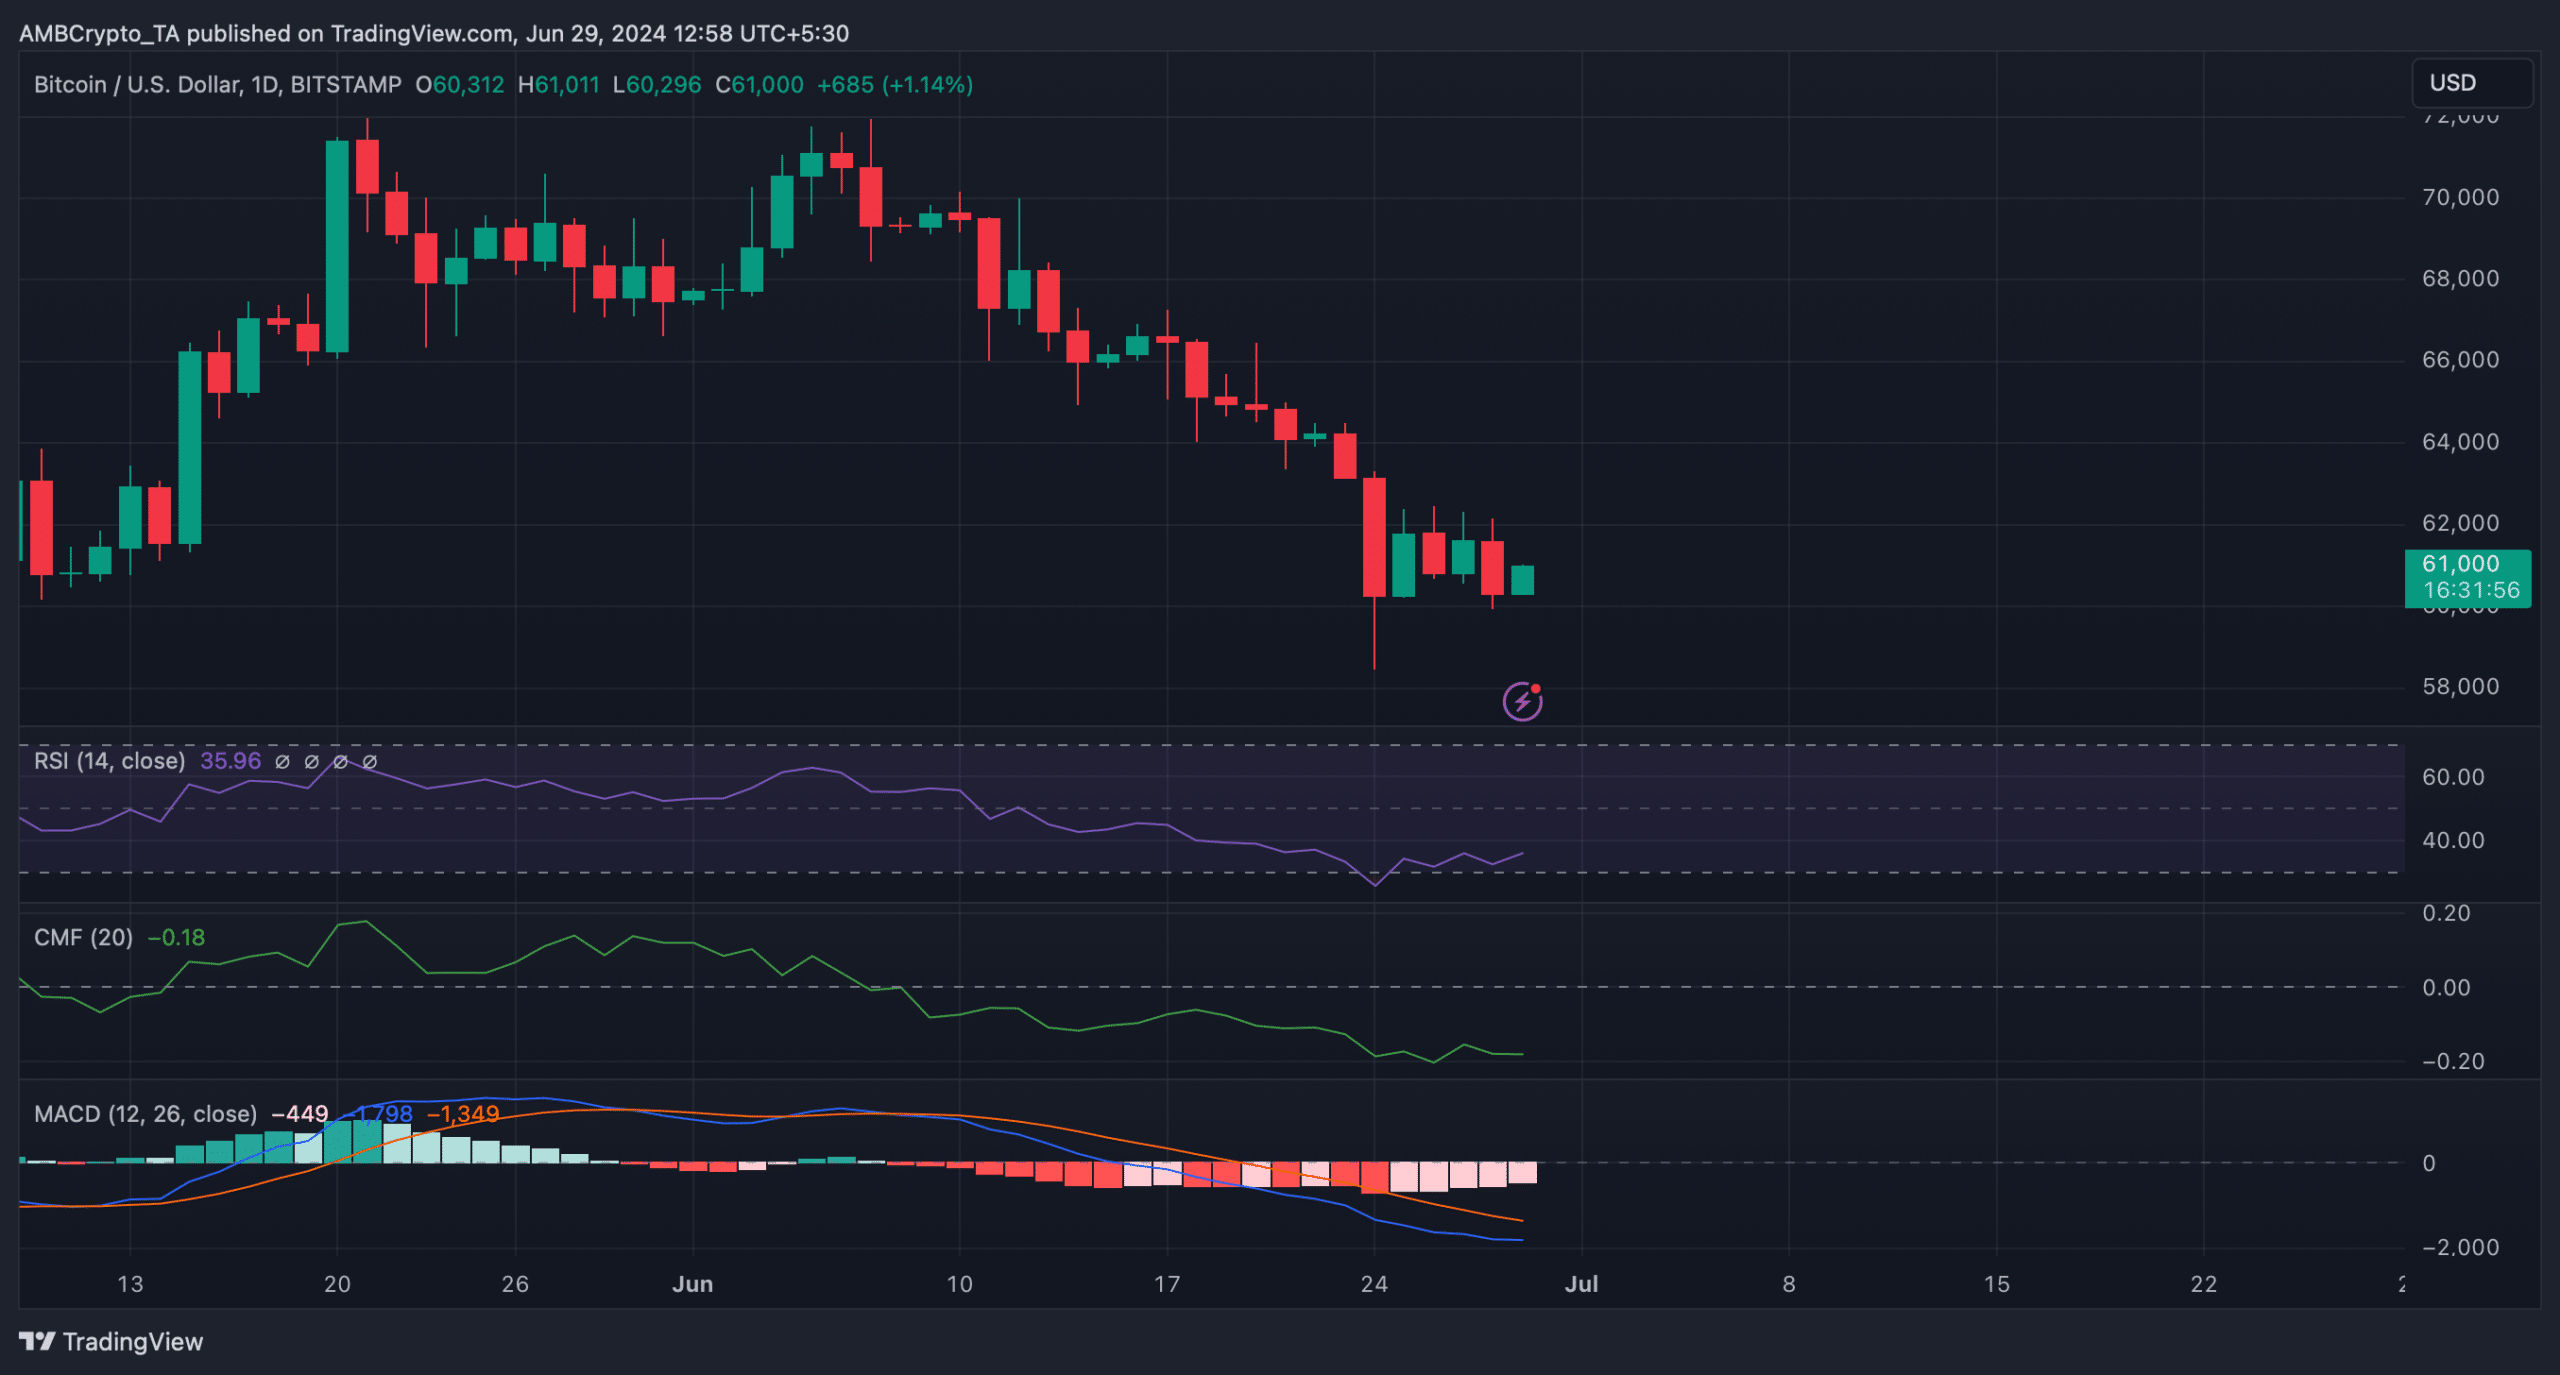
However, at press time, BTC’s price charts continued to flash red. According to CoinMarketCap, BTC was down by over 5% in the last seven days. At the time of writing, BTC was trading at $60,920.48 with a market capitalization of over $1.19 trillion.
The Chaikin Money Flow (CMF) registered a downtick. The MACD also displayed a bearish advantage in the market, suggesting a sustained downtrend.
Read Bitcoin’s [BTC] Price Prediction 2024-25
Nonetheless, the Relative Strength Index (RSI) looked bullish as it went up. This might allow BTC to gain more momentum in the coming days.


