Bitcoin: On lower timeframe, buying BTC in this area could be quite risky

Disclaimer: The findings of the following analysis are the sole opinions of the writer and should not be considered investment advice.
Bitcoin [BTC] has traded between the $22k and the $19k levels for the better part of the past month. Deviations below $19k and above $22k were bought or sold within a couple of days of a move past these levels.
Yet, the formation of a range does not indicate a phase of accumulation. Indeed, back in May, after a sharp drop to $27k, the price appeared to consolidate about the $30k mark. Two weeks into June, the hopes of the bulls were brutally smashed as Bitcoin nosedived to $20.5k and $17.8k support.
BTC- 1-Hour Chart
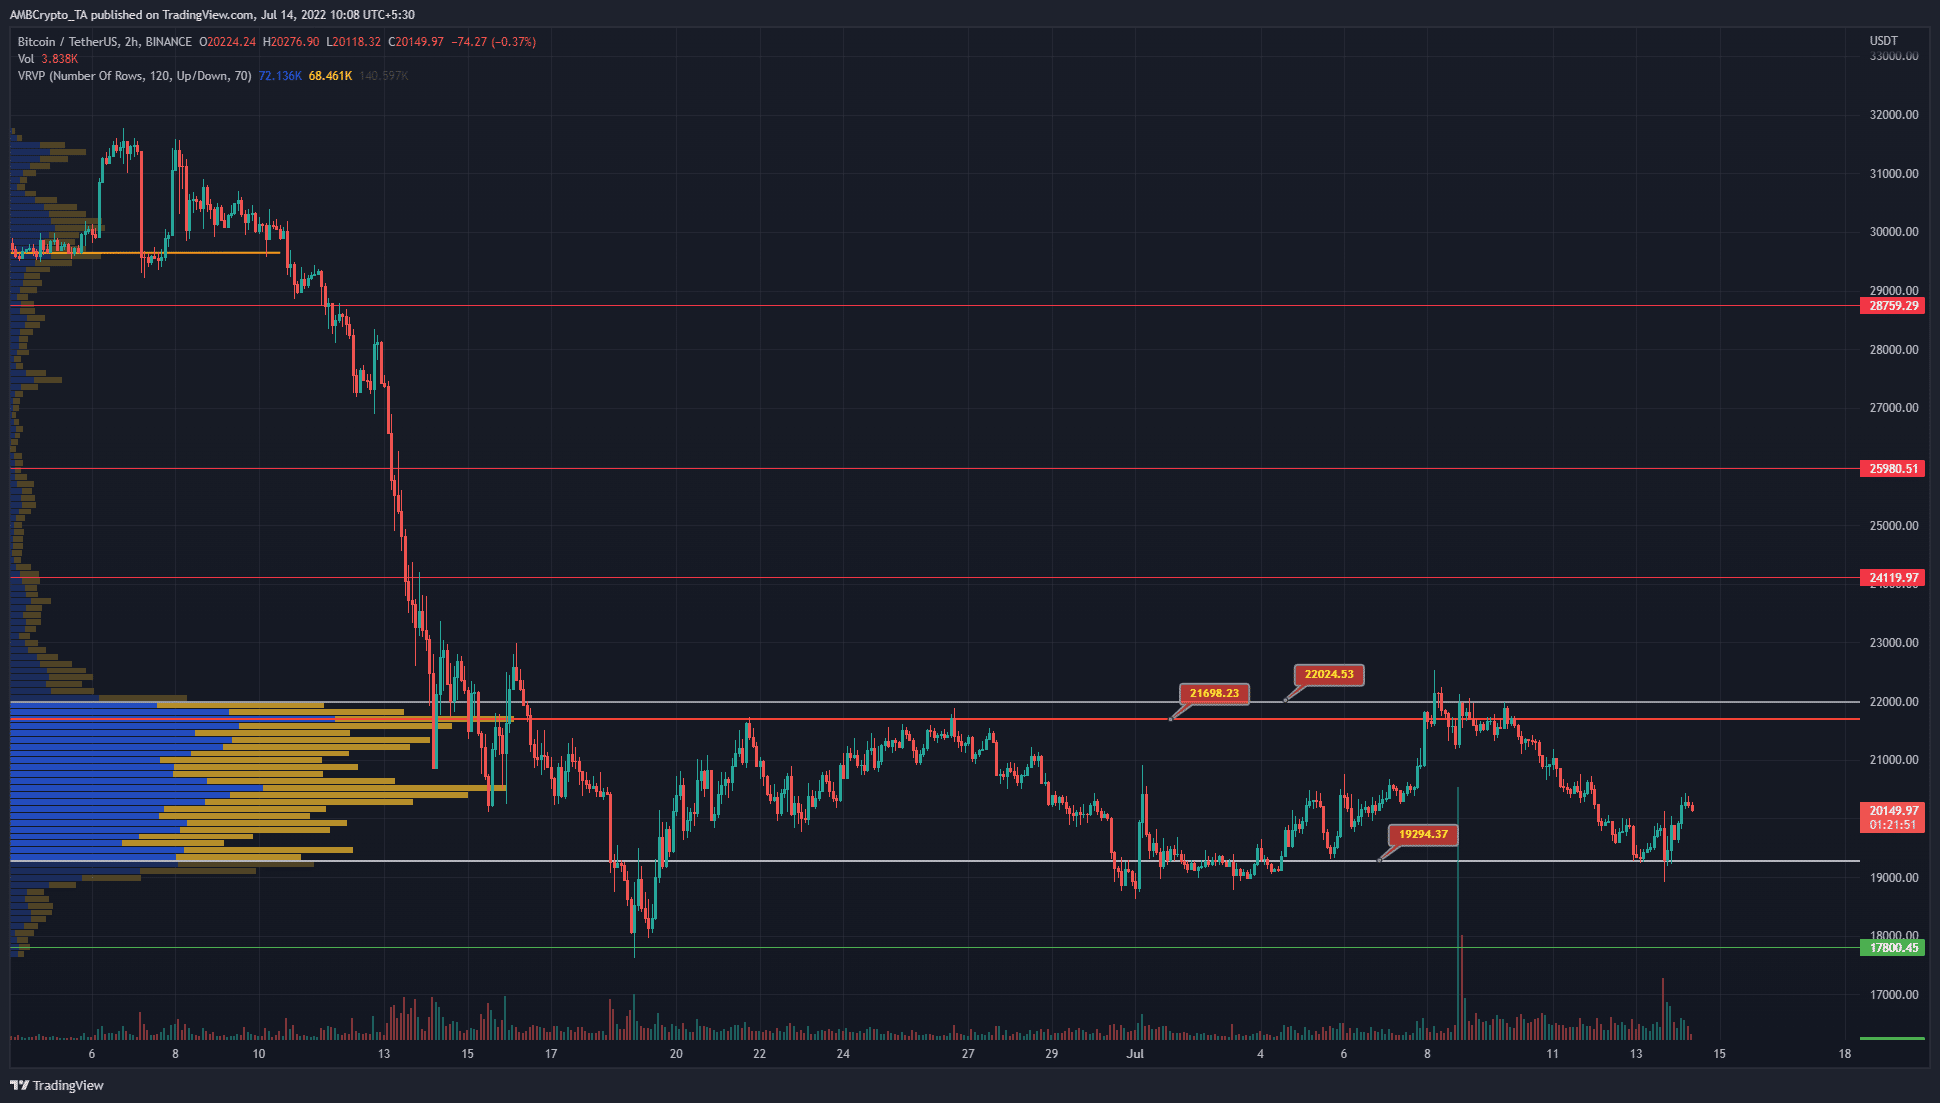
Even though long-term investors might be wary of buying Bitcoin, shorter timeframe traders certainly have plenty of opportunities. However, volatility could ruin certain bullish or bearish setups. The Visible Range Volume Profile showed the Value Area High (VAH) and Low (VAL) to be at $22k and $19.3k.
This meant that a retest of either level would be a good place to sell or buy the asset, respectively. The Point of Control (PoC) represented the level where the most amount of trading, by volume, occurred. It stood at $21.6k.
Moreover, the $20.2k-$20.8k was a zone of supply for Bitcoin on shorter timeframes.
Rationale
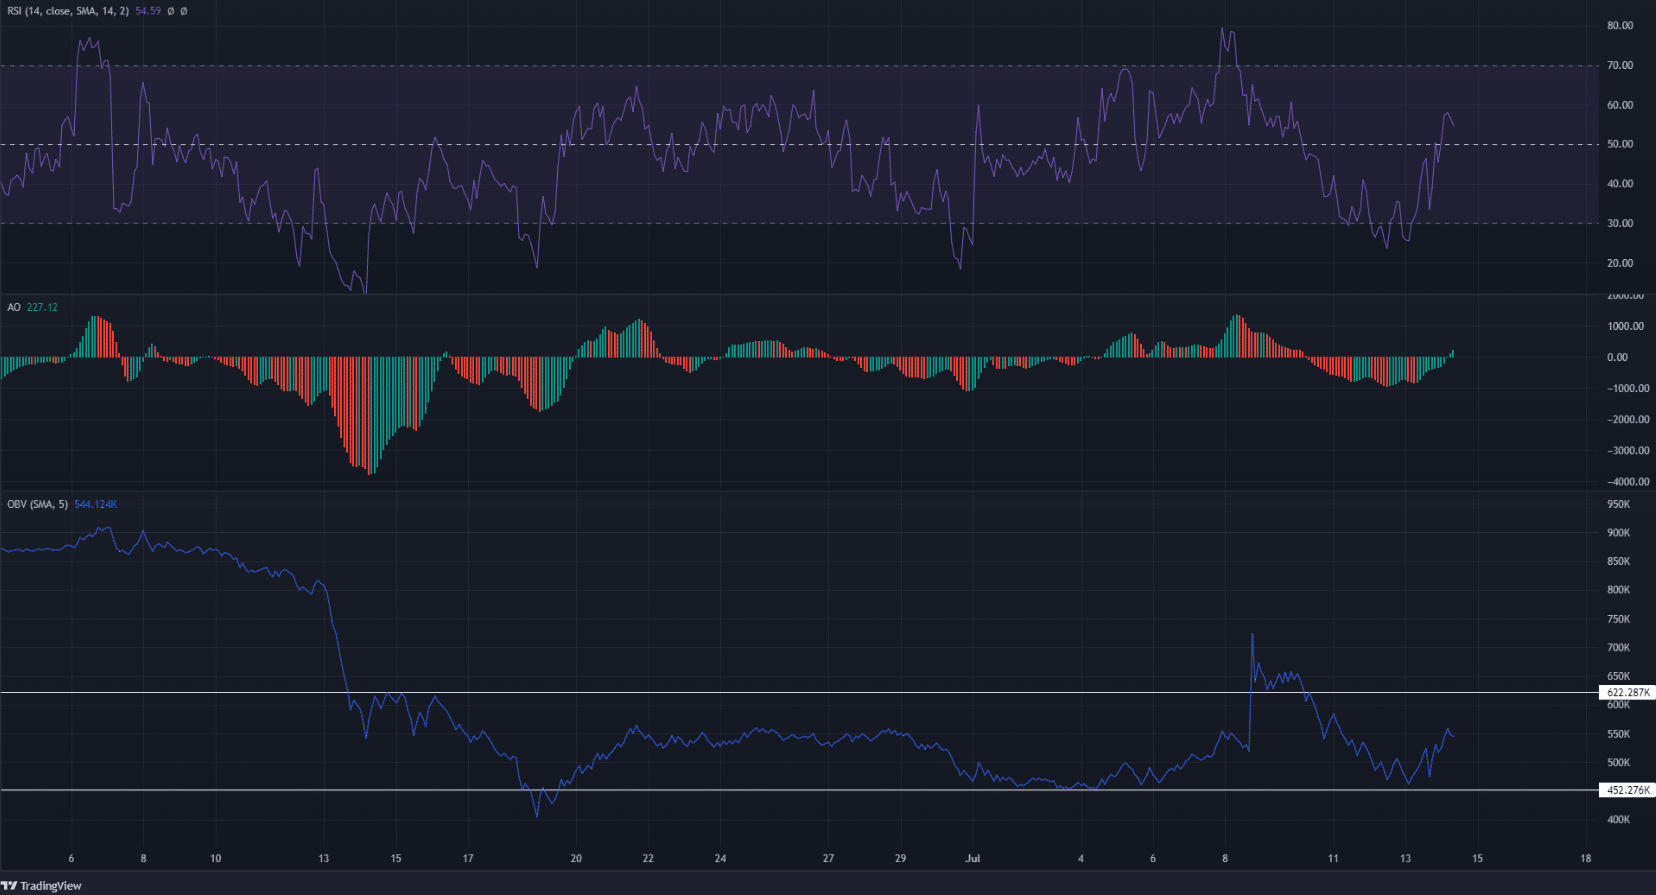
The indicators also supported the idea of a range for Bitcoin. Over the past month, the Relative Strength Index (RSI) went from oversold to overbought, but a significant market structure break was not seen. Instead, the price has been stuck between the $22k and $19k levels.
At press time, the RSI pushed back above the neutral 50 mark. Similarly, the Awesome Oscillator (AO) also climbed above the zero line to show upward momentum was stronger.
The On-Balance Volume (OBV), on the other hand, did not see a significant breakout. Much like the price, the OBV has also been stuck within a range over the past month. However, the past few hours of trading did see significant buying volume on the OBV.
Conclusion
While the bounce from the $19k lows was backed by some demand, there was no sign of a breakout from the range yet. The mid-point of this range lay at $20.6k, right in the middle of a stiff zone of resistance.
On the lower timeframes, buying Bitcoin in the $20.2k-$20.8k area could be quite risky. Instead, a retest of the VAH or VAL can be used to sell or buy.


