Bitcoin on track for $120K? Insights from MVRV, Pi Cycle Top indicators show…

- The Pi Cycle Top indicator revealed that BTC was near its market bottom.
- BTC was testing a resistance, and a breakout might begin a bull rally.
Bitcoin [BTC] continued to remain bearish as both its daily and weekly charts remained red. Nonetheless, the latest analysis suggested a trend reversal soon. Therefore, AMBCrypto investigated further to find whether a trend reversal is possible.
Bitcoin to touch $120k in the coming months?
The king coin witnessed a 3% price drop last week. The bearish trend continued in the last 24 hours, and at press time it was trading at $68.4k. While the bears remained dominant, a CryptoQuant analysis hinted at a major rally ahead.
CoinLupin, an author and analyst at CryptoQuant, recently posted an analysis that took into account BTC’s MVRV ratio. As per the analysis, the MVRV stood around 2, indicating that the market’s surface value was twice the on-chain estimated value.
The analyst used the 365-day Bollinger Band for MVRV and the 4-year average. The metric typically reflects Bitcoin’s cycle. This metric’s reading revealed that the upward trend remains intact, and generally, the cycle peak tends to occur when the MVRV reaches levels between 3 and 3.6.
The analysis mentioned that a 43%–77% rise is required if the realized value (RV) stays the same. This corresponds to an aim of $95k to $120k when applied to Bitcoin.
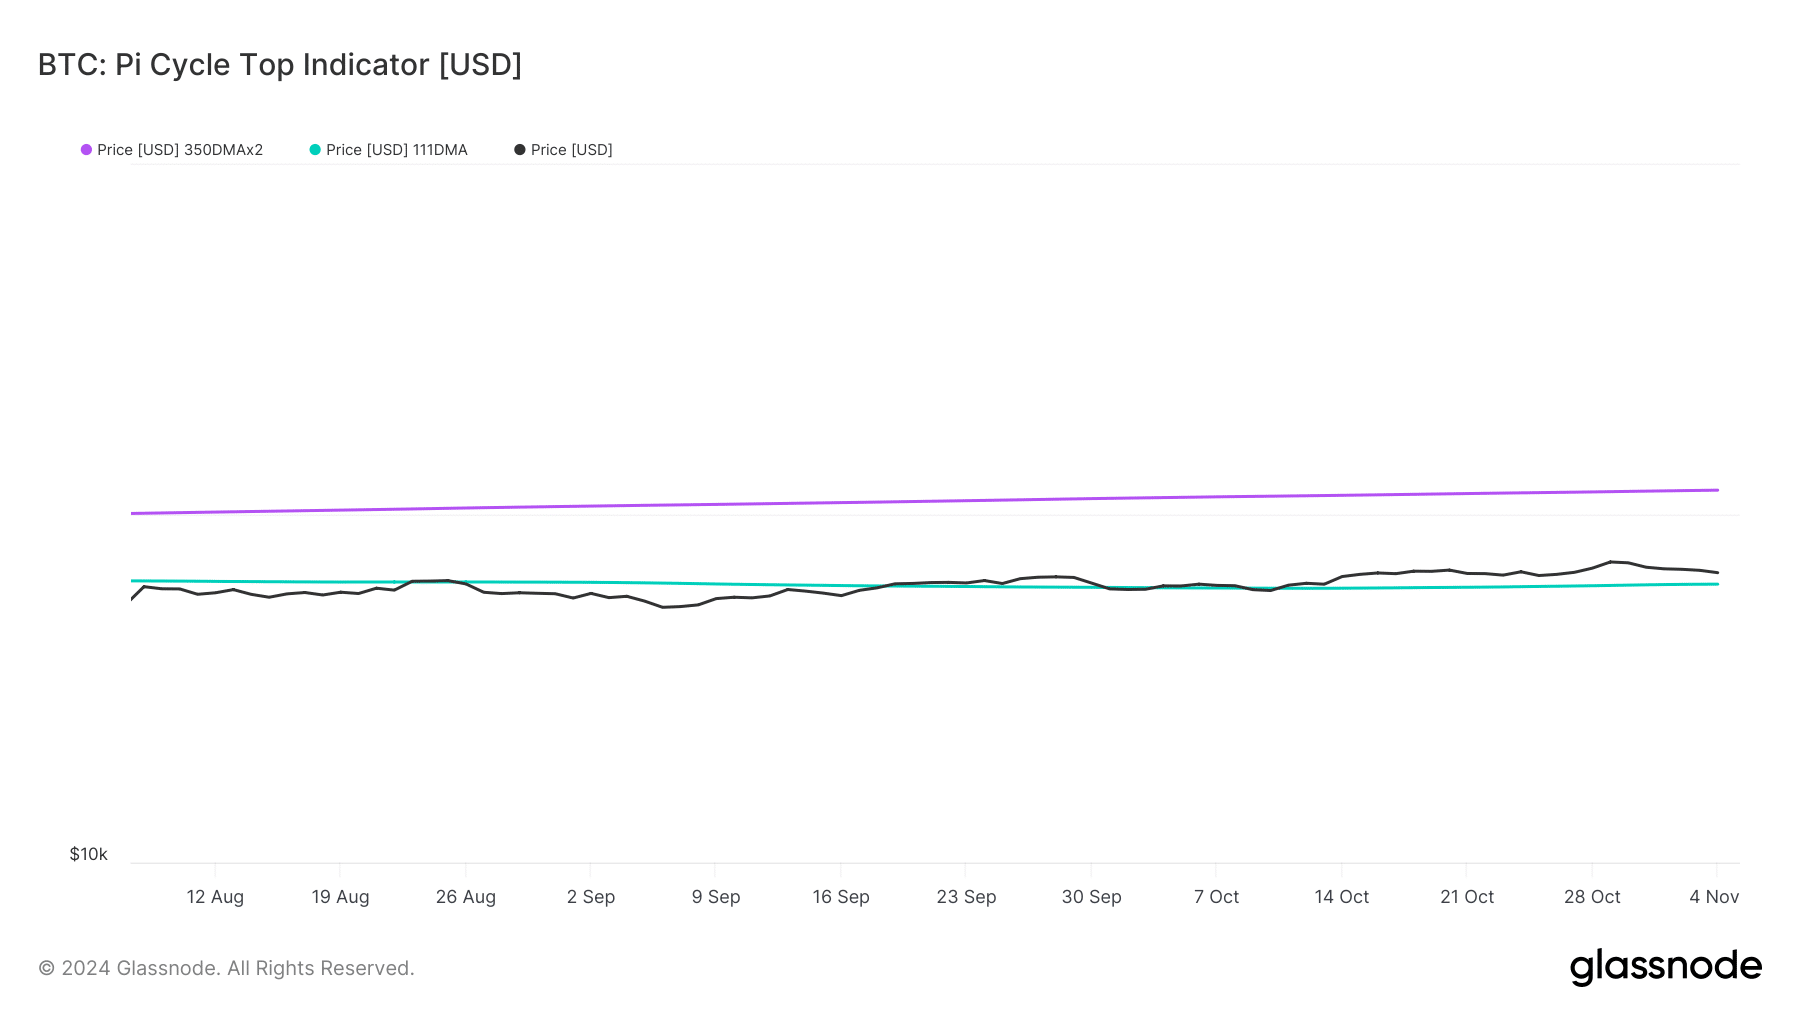
To check the likelihood of BTC moving towards $120k, AMBCrypto assessed Glassnode’s data. The Pi Cycle Top indicator revealed that Bitcoin’s price was fast approaching its possible market bottom of $62.7k.
If the metric is to be believed, then BTC’s possible market top was near $116k.
Therefore, considering the Pi Cycle Top indicator and the CryptoQuant analysis, expecting BTC to begin its journey towards $120k in the coming months didn’t seem too ambitious.
What’s next for BTC in the short-term
Though the future prospect of BTC looked optimistic, the present situation remained questionable.
Therefore, AMCrypto assessed its on-chain data to find more about where BTC was headed as the world awaits the U.S. presidential election result. Our analysis revealed that BTC’s binary CDD turned red.
This meant that long-term holders’ movement in the last 7 days was lower than the average. They have a motive to hold their coins. Its NULP was also bearish, as it indicated that investors were in a belief phase where they are currently in a state of high unrealized profits.
Read Bitcoin (BTC) Price Prediction 2024-25
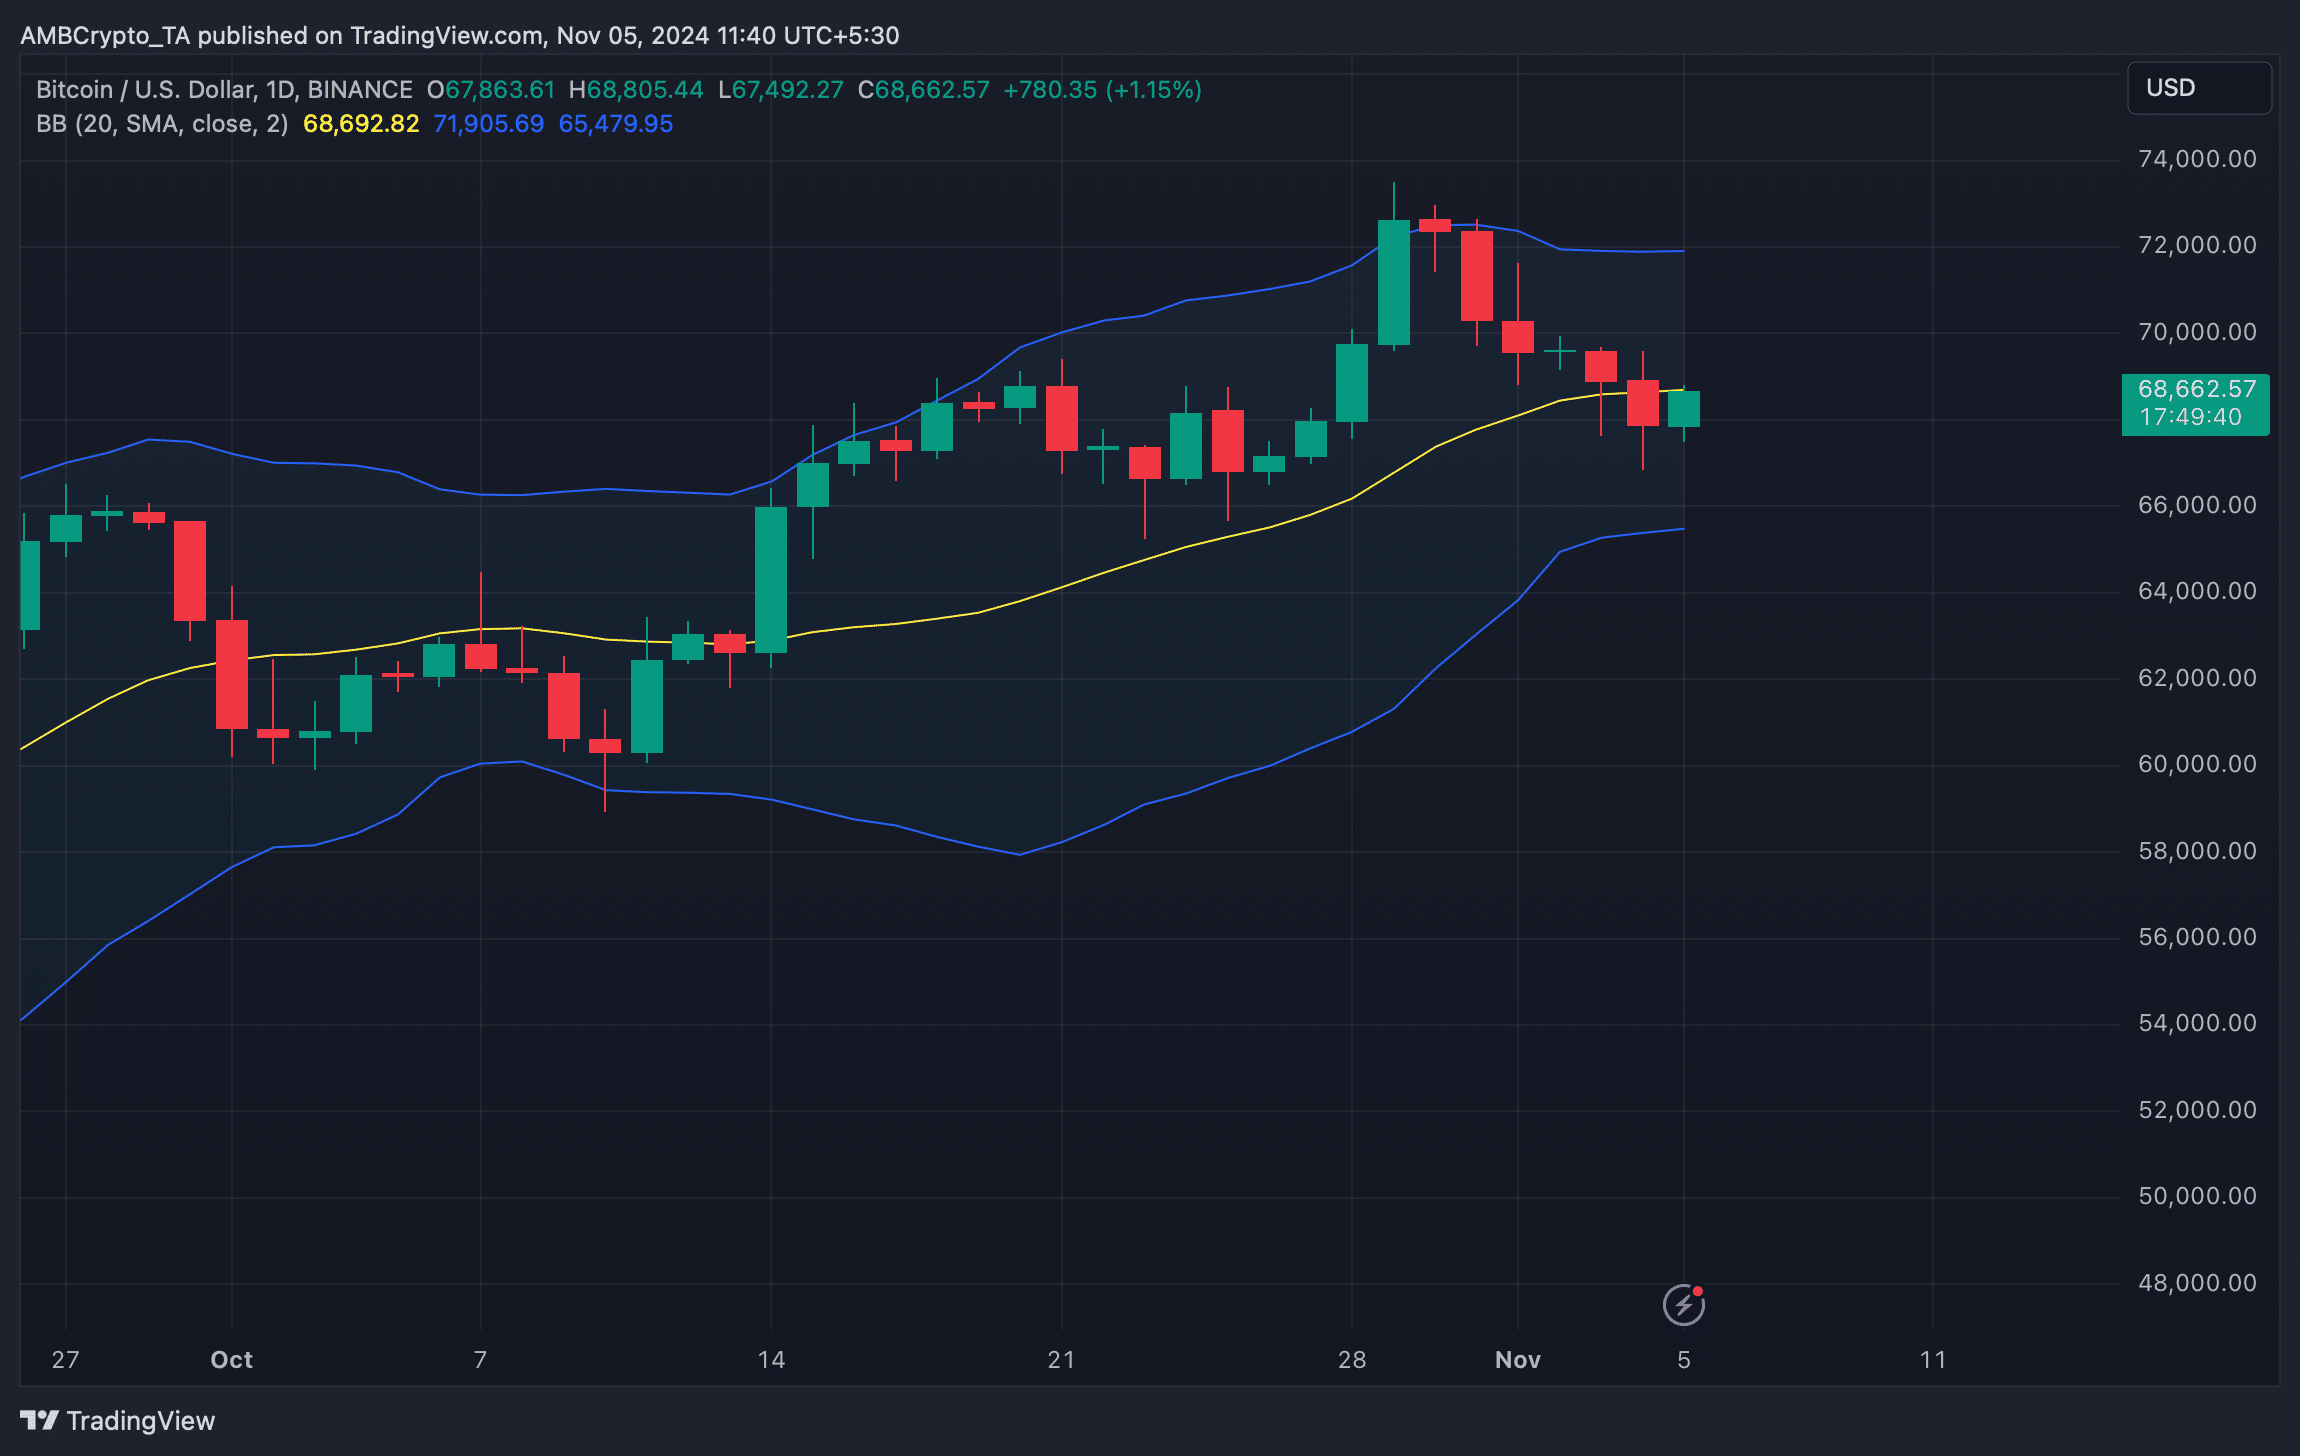
We then took a quick look at BTC’s daily chart to see what market indicators suggested. At the time of writing, Bitcoin was testing its resistance at its 20-day Simple Moving Average (SMA).
A successful breakout could begin a bull rally. But if it gets rejected, then BTC might fall to $65k again.


