
- Bitcoin had a bearish bias due to the relentless selling.
- Accumulation has been strong over the past month and might set the stage for a recovery.
Bitcoin [BTC] had its halving event occur nearly three months ago, but the promised bull run was not yet in play. Some investors question why BTC is struggling even with the demand from ETFs or the cooling inflation.
A deeper dive into the long-term metrics showed that the Bitcoin predictions of a bottom being close, or already in, are likely true.
Bitcoin predictions: Gleaning clues from price action
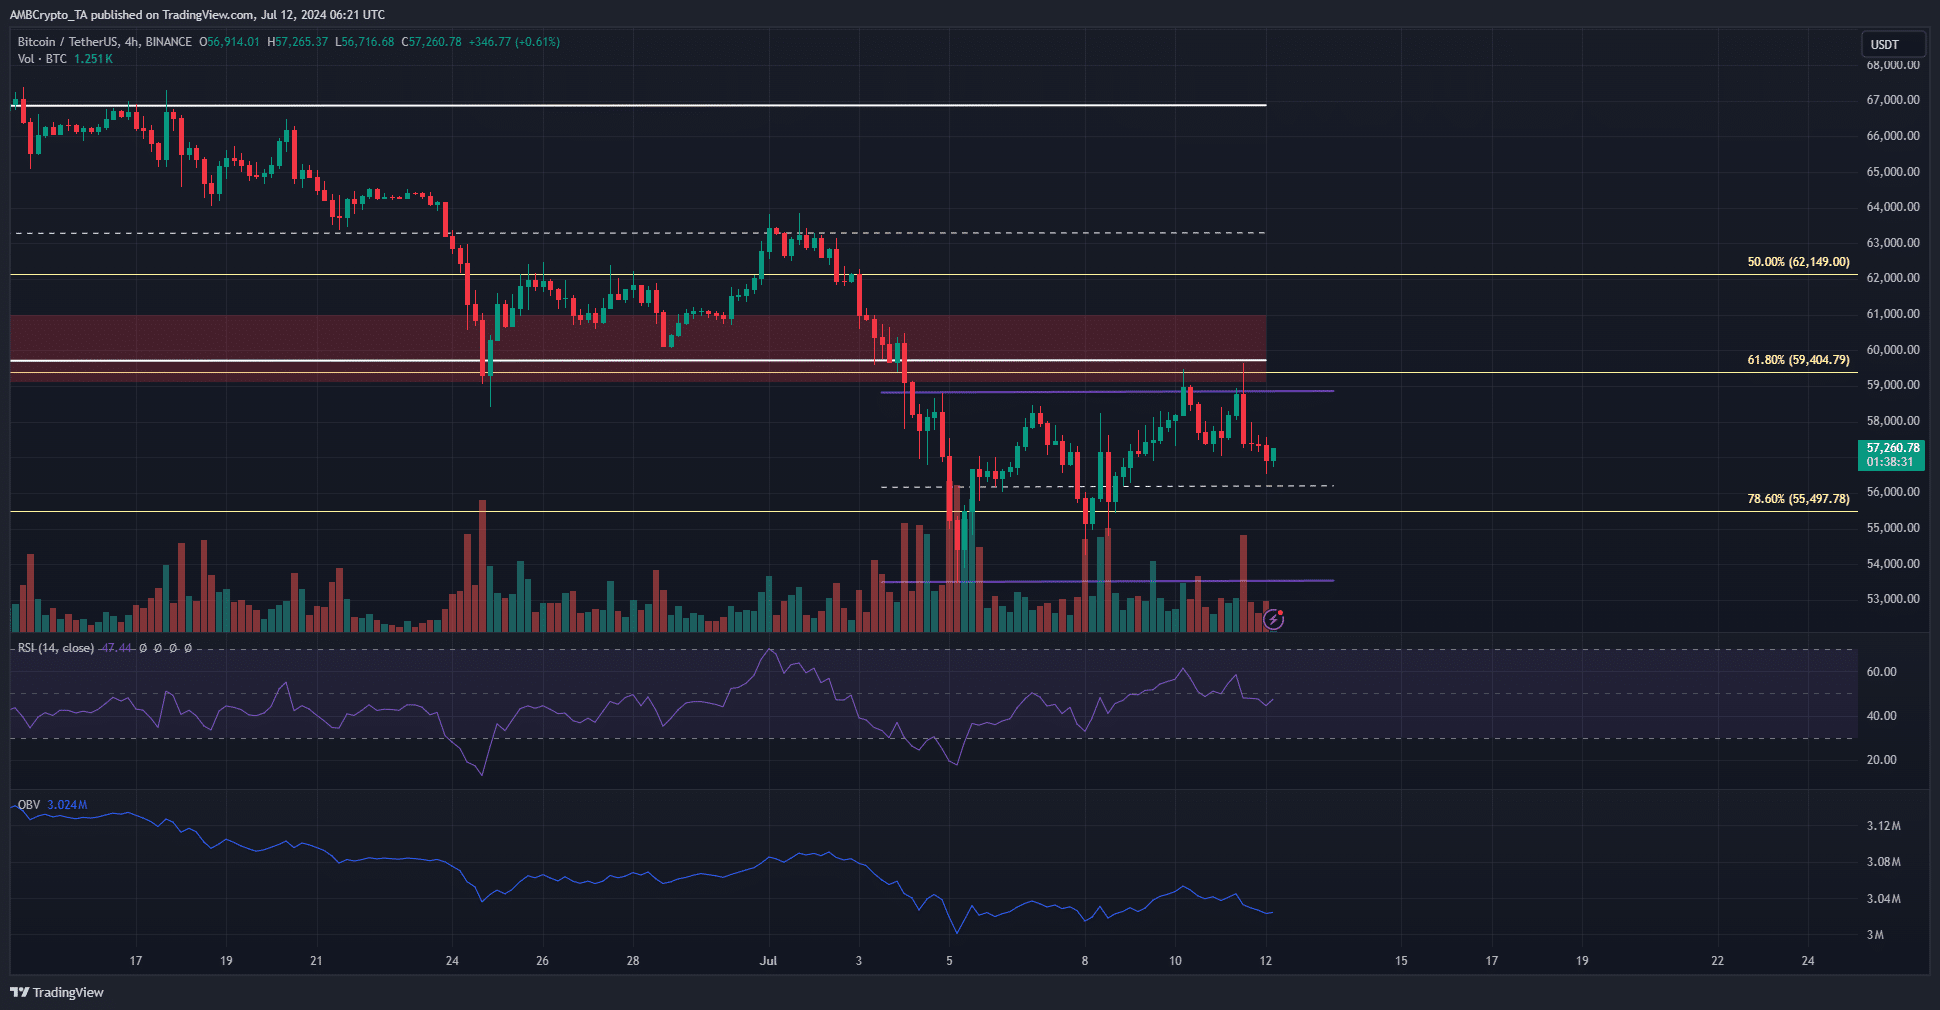
Source: BTC/USDT on TradingView
The 4-hour price chart showed a range formation (purple) between $53.5k and $58.9k. The supply zone (red box) at $59.2k-$61k has been tested twice in the past few days, but to no avail.
The OBV showed that buying pressure was not strong. The RSI was pushed below neutral 50 after the price rejection at the range highs.
The bulls were unable to sustain the pressure, and traders can prepare for another price dip toward $55k over the weekend.
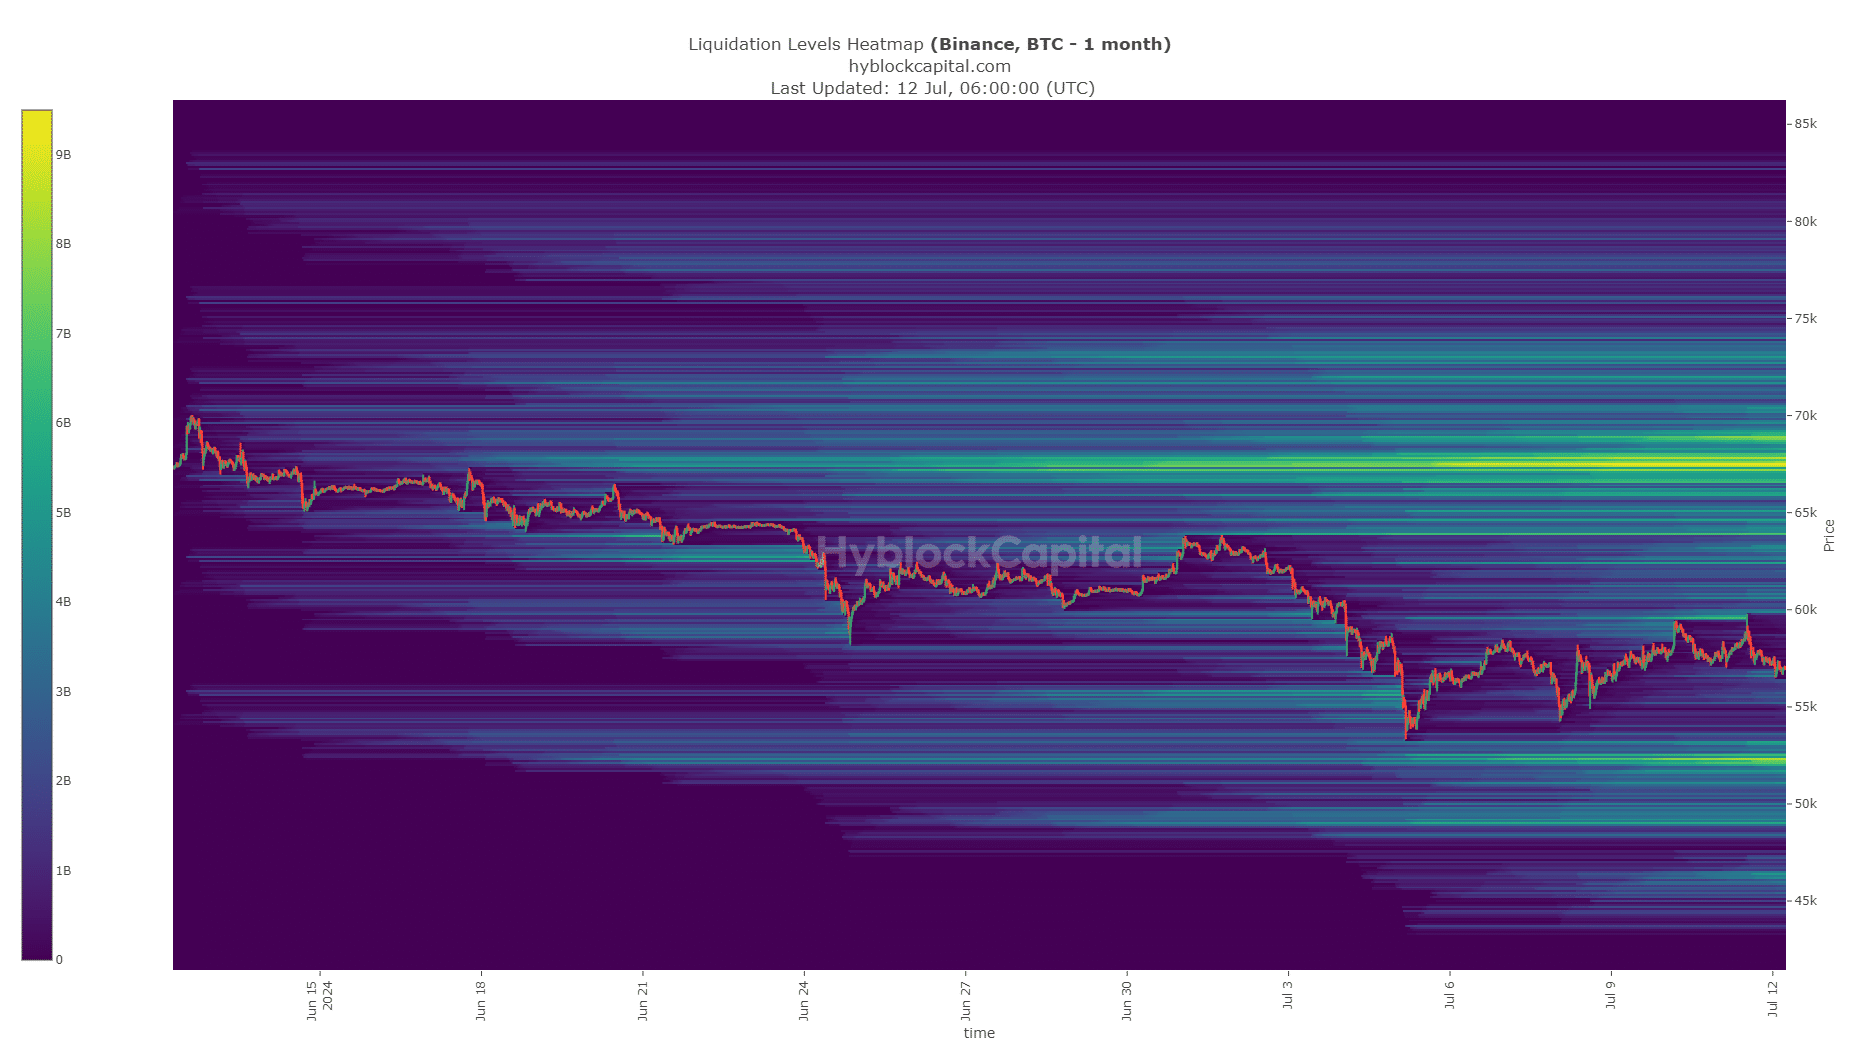
Source: Hyblock
The past month’s liquidation heatmap showed that the $59.5k liquidity pocket was tested on the 11th of July and prices immediately retraced. This was a sign that the liquidity cluster at $52.1k was the next target.
If the buyers had been dominant, BTC would have broken through the $60k barrier. Since it did not, the near-term Bitcoin predictions favor more losses.
Nice opportunity for traders
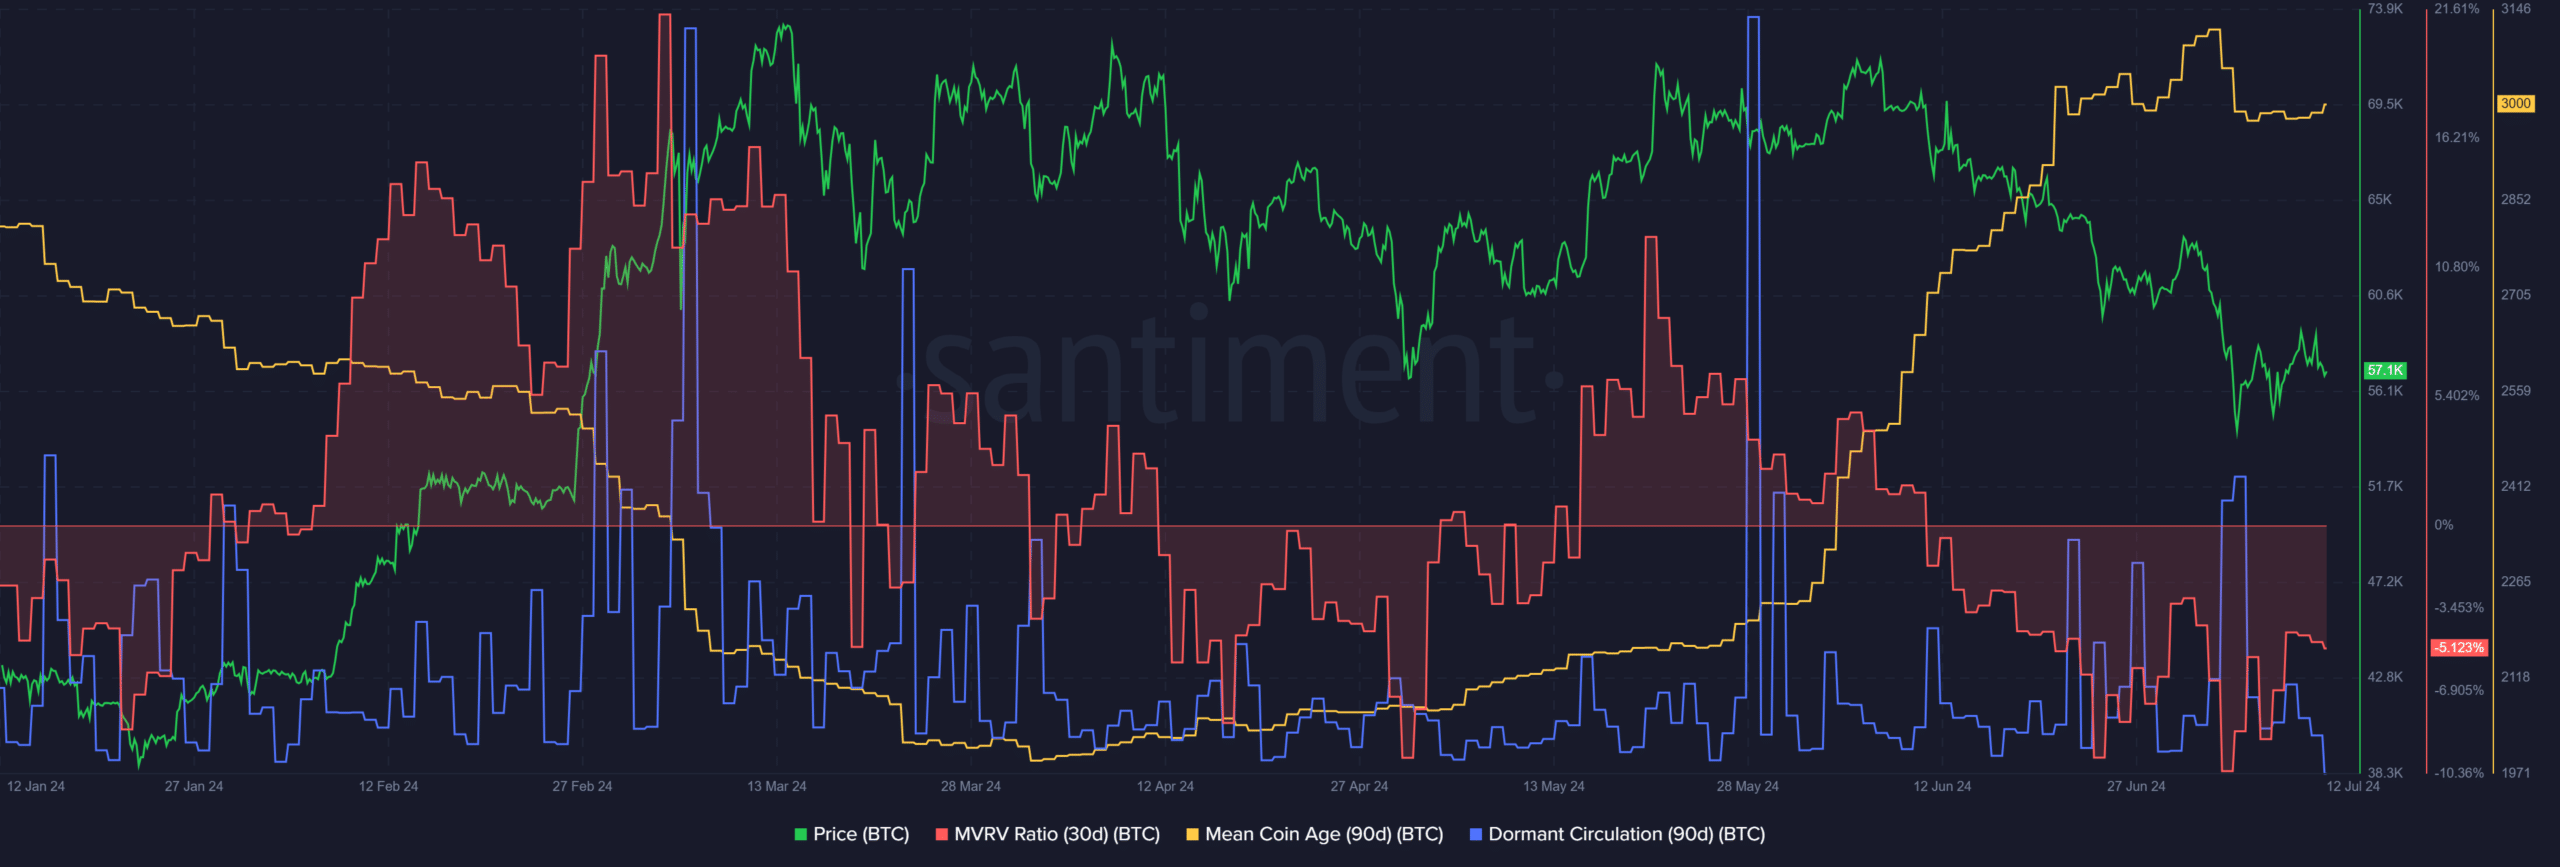
Source: Santiment
The mean coin age has trended higher since May. Over the past ten days, it has stalled, but overall the metric suggested strong network-wide accumulation during the past month’s price dip.
The 30-day MVRV was negative, showing short-term holders at a loss. Together, this combination is a strong buy signal.
Read Bitcoin’s [BTC] Price Prediction 2024-25
The dormant circulation spiked dramatically on the 5th of July as Bitcoin prices cratered, but has been quiet since then.
Overall, the Bitcoin predictions of more losses hold weight due to the liquidity at $52.1k. The $46k region might be targeted too if sentiment gets weak enough. As things stand, investors can look to buy the dip.
Disclaimer: The information presented does not constitute financial, investment, trading, or other types of advice and is solely the writer’s opinion.