
- BTC’s key metric has presented a buying opportunity.
- However, bearish sentiments remain significant in the market.
Bitcoin’s [BTC] Market Value to Realized Value (MVRV) has flashed a buy signal, crypto analyst Ali Martinez has noted in a post on X (formerly Twitter).
According to the analyst, the token’s MVRV ratio assessed over the 30-day moving average returned a negative value of -11.6%.
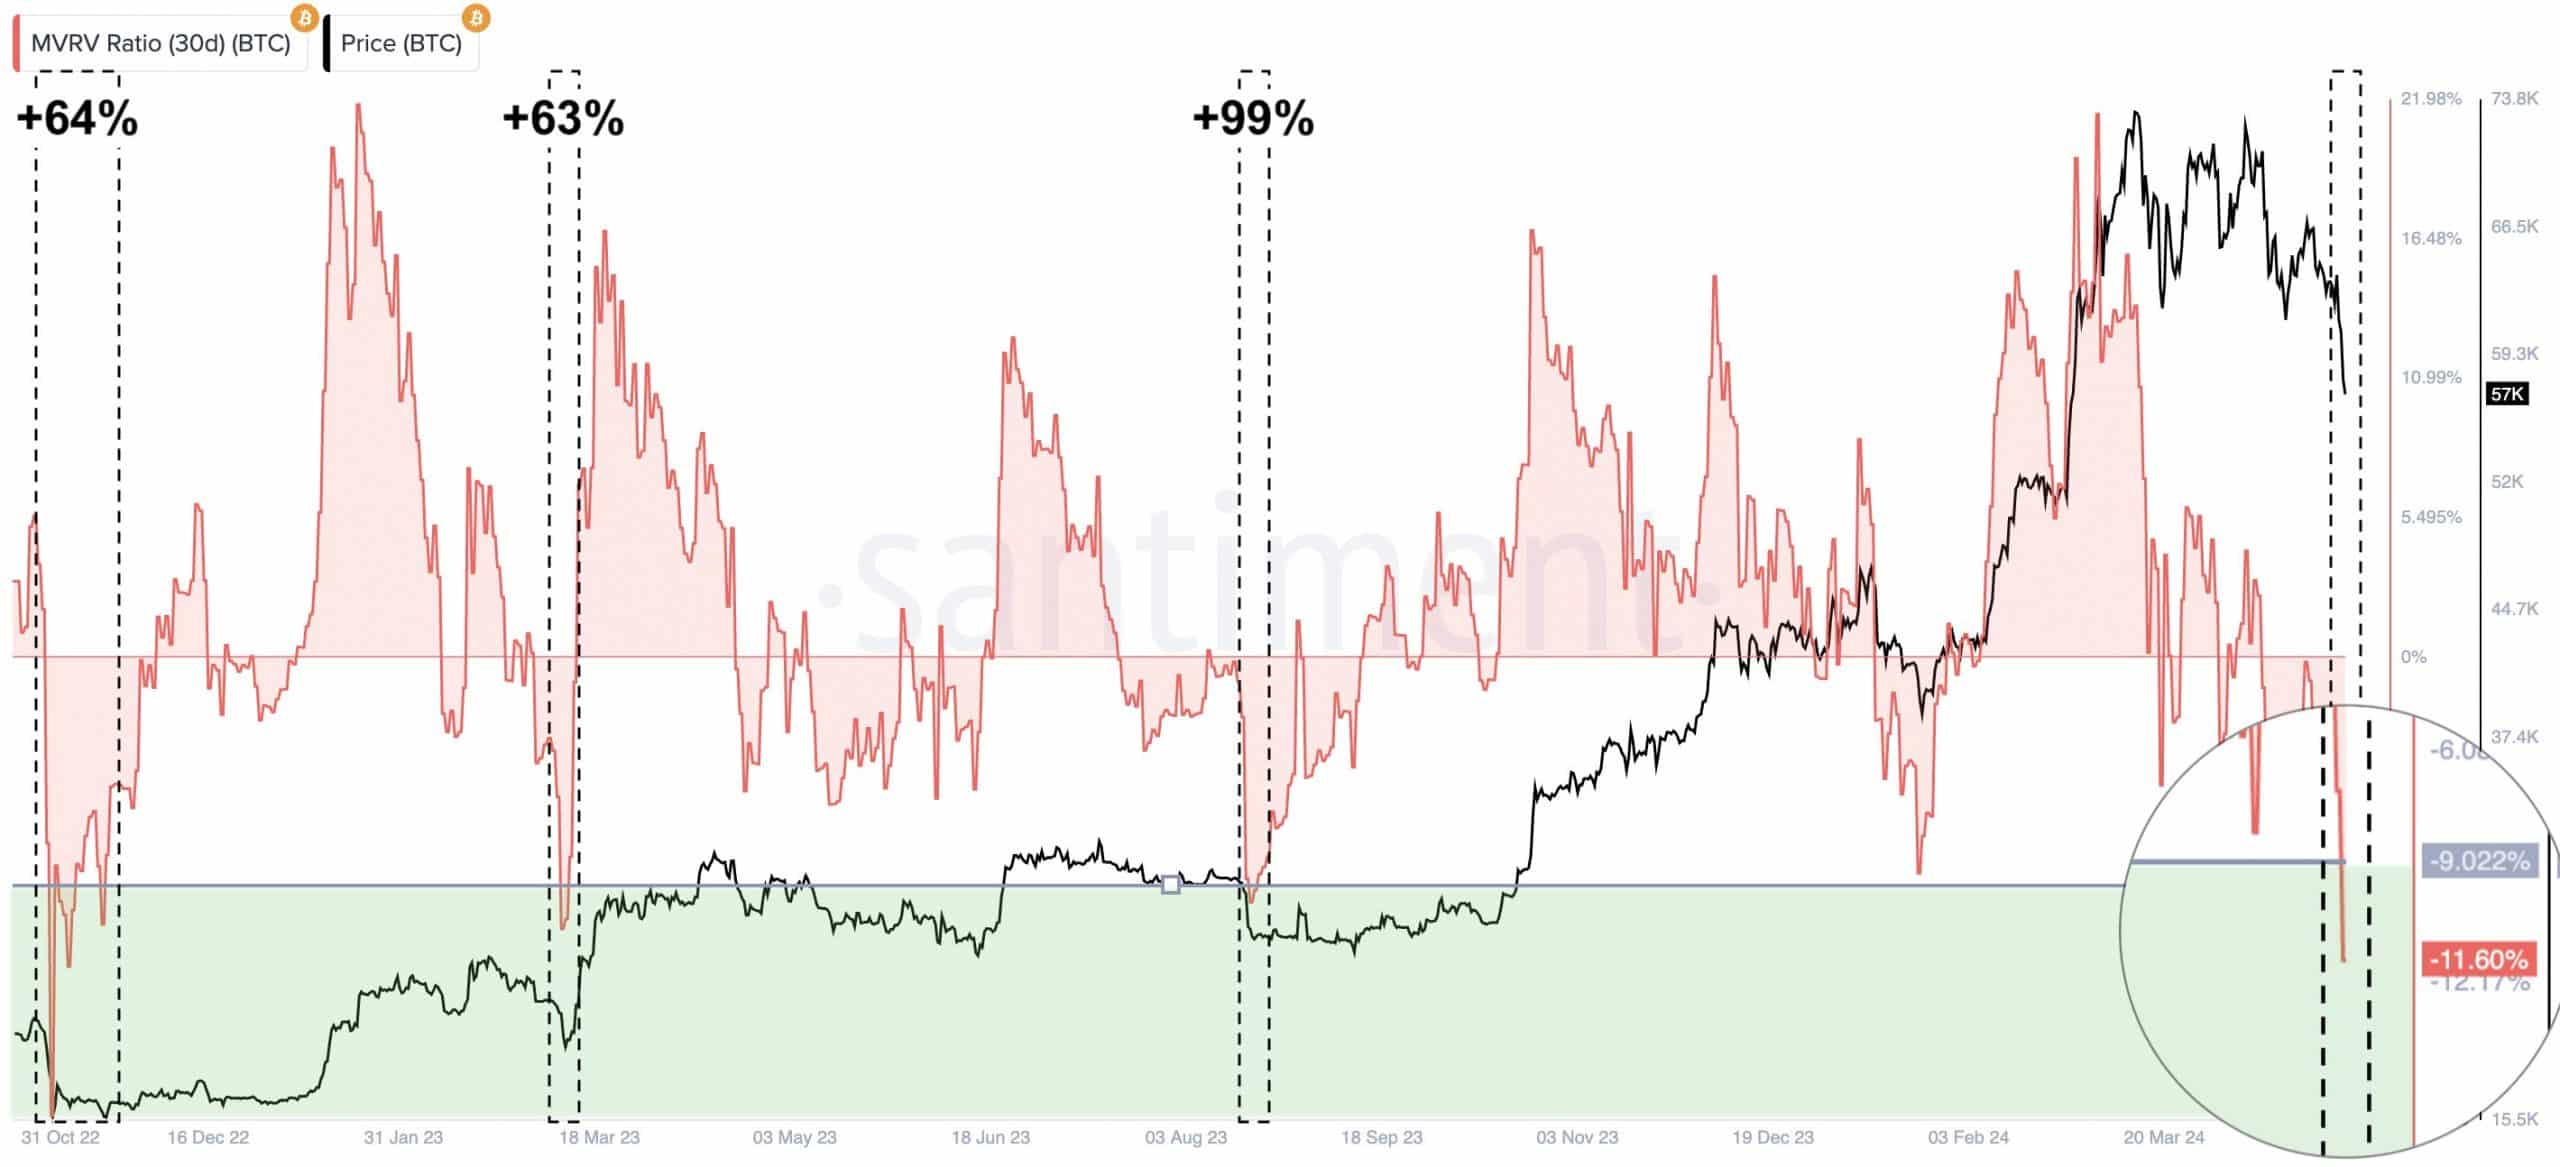
Source: Santiment
This metric tracks the ratio between an asset’s current market price and the average price of every coin or token acquired for that asset.
When it returns a value above one, it suggests that an asset’s market value is significantly higher than the price at which most investors acquired their holdings. When this happens, the asset is said to be overvalued.
On the other hand, a negative MVRV value shows that the asset in question is undervalued. It suggests that its market value is below the average purchase price of all its tokens in circulation.
Martinez assessed the historical pattern of BTC’s MVRV ratio (30d) and found that the last three times the metric dropped below -9%, the coin’s price surged by 64%, 63%, and 99%, respectively.
According to Martinez, a double-digit rally might be in the books for the leading coin as its MVRV ratio now sits under the critical -9% mark.
Is a rally feasible?
Readings from the coin’s movements on a daily chart revealed that it broke below support on 30th April, signaling that the bears were in control.
Some of the key technical indicators observed confirmed the significant decline in bullish sentiment. For example, BTC’s Elder-Ray Index has returned only negative values since 24th April.
The indicator measures the relationship between the strength of an asset’s buyers and sellers. When its value is negative, bear power dominates the market.
Likewise, the coin’s positive directional index (green) rested under its negative index at the time of writing. This showed that selling activity outpaced coin accumulation among market participants.
Is your portfolio green? Check out the BTC Profit Calculator
Regarding demand for BTC, its Relative Strength Index (RSI) and Money Flow Index (MFI) trended downward as of this writing. Its RSI was 31.74, while its MFI was 39.71. These values showed that the coin was making its way to the oversold zone of the market.
If selling momentum heightens, the bears may push the coin’s price downward to $52,000 and, subsequently, to $47,000.
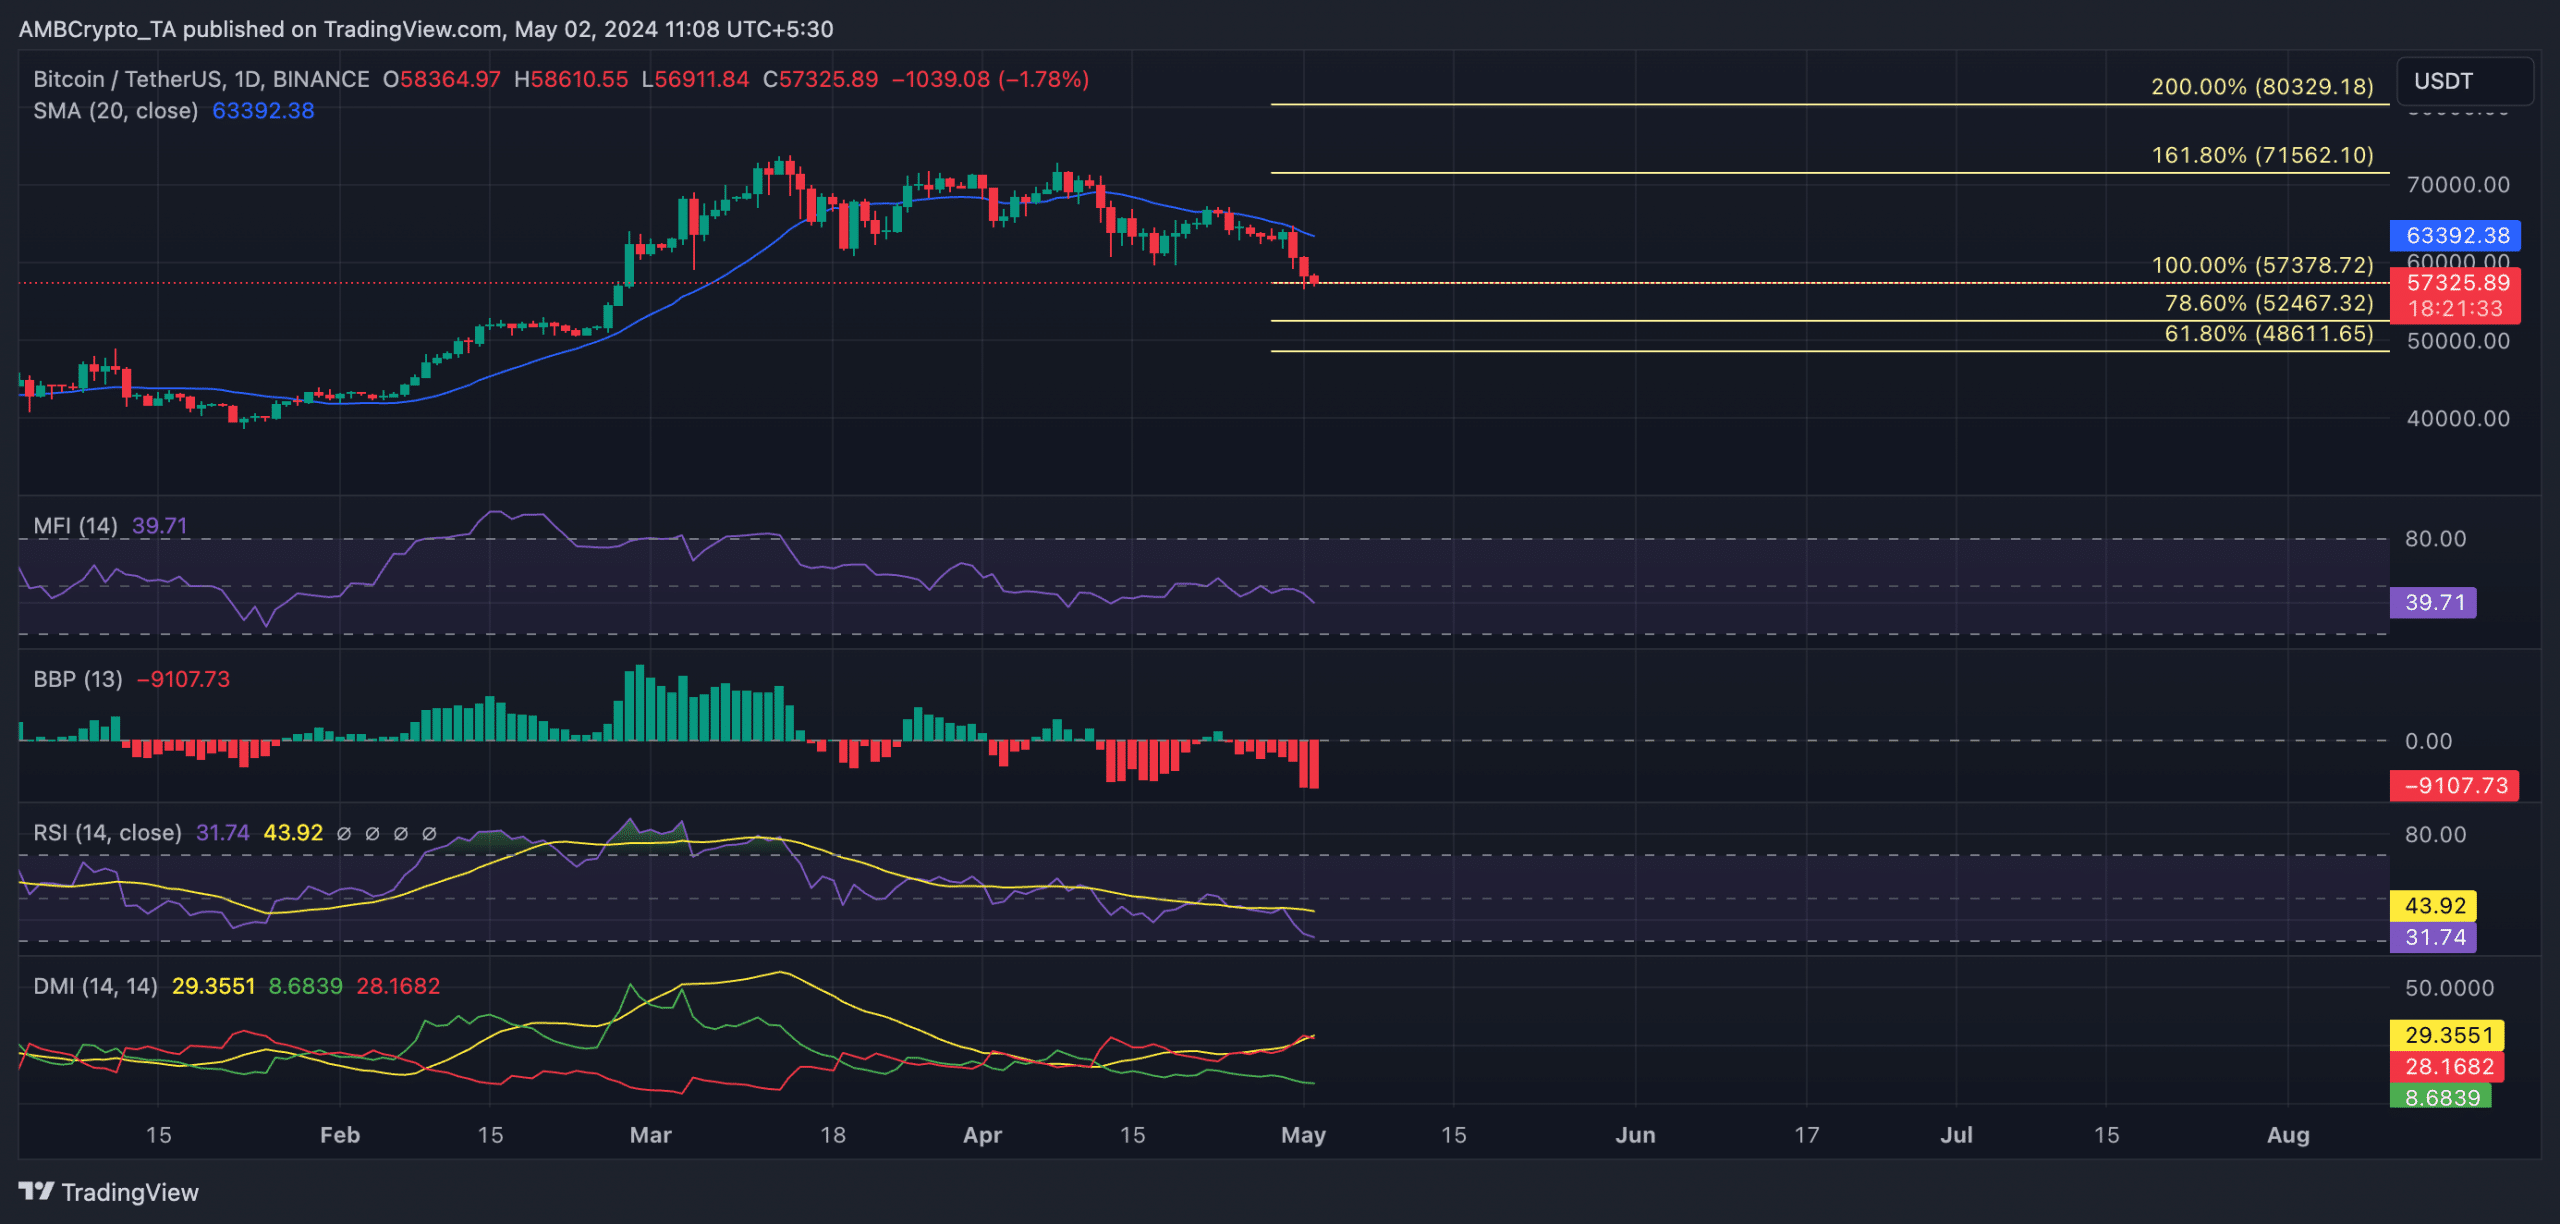
Source: BTC/USDT on TradingView