


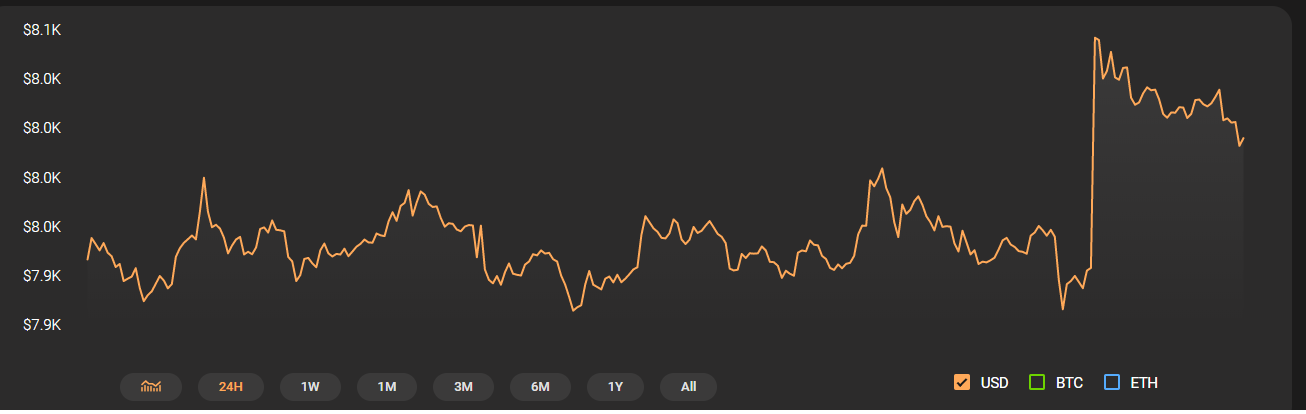
Bitcoin has been struggling to maintain its position above $8k and any significant gain has been neutralized by a wave of market corrections. The cryptocurrency was trading at $8048 at press time after registering a rise of 1.18% on the 24-hour price chart. The total market cap of the coin stood above $144 billion.

1-Hour Price Chart
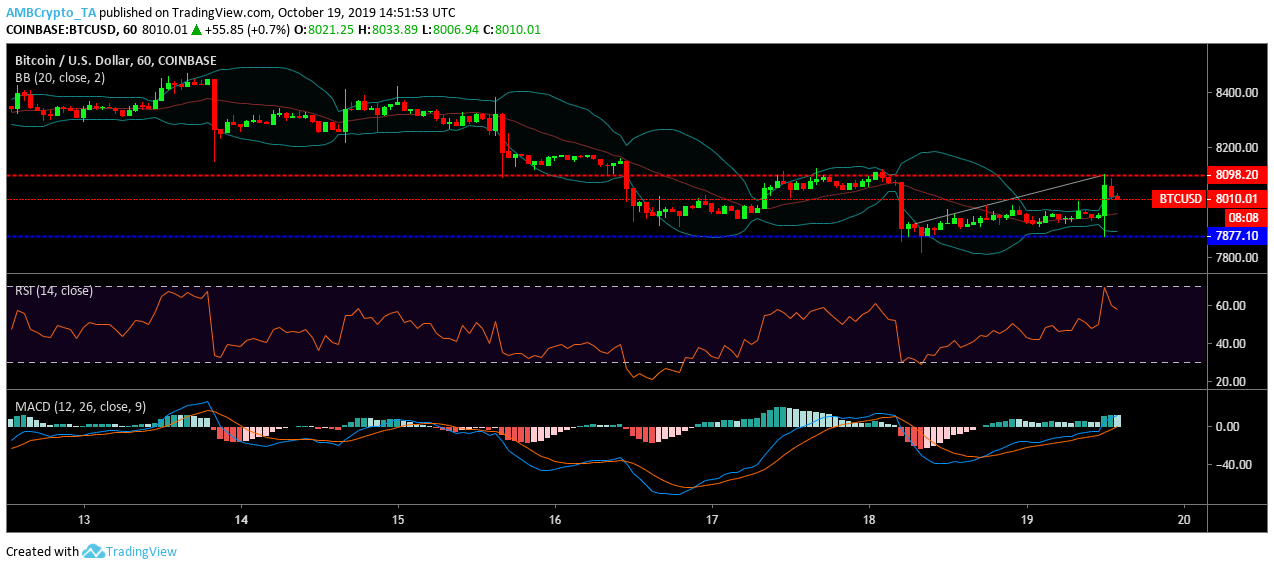

In the 1-hour price chart, the immediate support formed at $7877.10 and required to break through the resistance of $8098.20 to show bullish momentum. Bitcoin showed an uptrend starting from $7,931 to $8,100.
The Bollinger Band indicator showed that the price volatility was low today while it was on the higher side the past week.
The RSI indicator suggested that buyers had a strong upper hand in the market after sellers dominated on 18th October.
The MACD indicator suggested that bullish sentiment was higher since 18th October as the MACD line went under a bullish cross over towards the second half of 18th October.
1-Day Chart
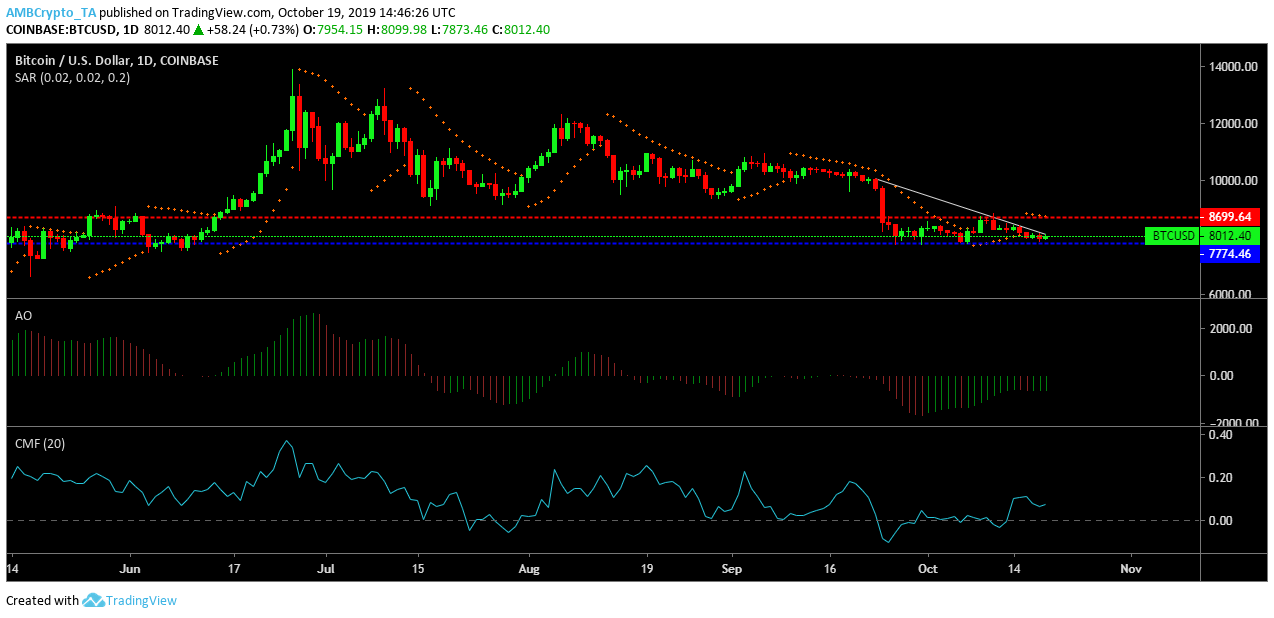

In the one-day price chart, Bitcoin formed immediate support at $7774.46. The resistance required for break through stood at $8699.64. The cryptocurrency showed a downward trend from $10083 to $8093.28.
Parabolic SAR Indicator acted as a resistance starting from 15th October, suggesting bearish sentiment.
Awesome Oscillator indicated that the market was fluctuating in the long term with minimal momentum, however, in the short term, it was more on the bearish side.
The Chaikin Money Flow or CMF showed that the amount of capital coming into the market was more since 13th October.
Conclusion
Bitcoin was quite volatile in the past week and has been struggling to maintain its position above $8k, however, the short term sentiment in the market was bearish.