Bitcoin breaks $86.8K: Traders, watch out for THIS price range next!
Bitcoin has a short-term bullish outlook, but the resistance around $90k could be too great to be broken in the coming days.

- BTC has a bullish H4 structure, and sizable capital inflows according to the CMF.
- This steady buying pressure could drive prices toward the $90.5k resistance level.
The Bitcoin [BTC] price trajectory has been bullish over the past week. Compared to last Tuesday’s low at $81.1k, BTC was up 6.88%, at press time. For long-term investors, news that the realized price was rising meant that HODLers were still largely profitable.
If the realized price continued to rise, it could come alongside a BTC price push toward $150k-$180k. As for the next few days of trading, the price move beyond the mid-range resistance was a positive sign.
BTC breaks the $86.8k local resistance
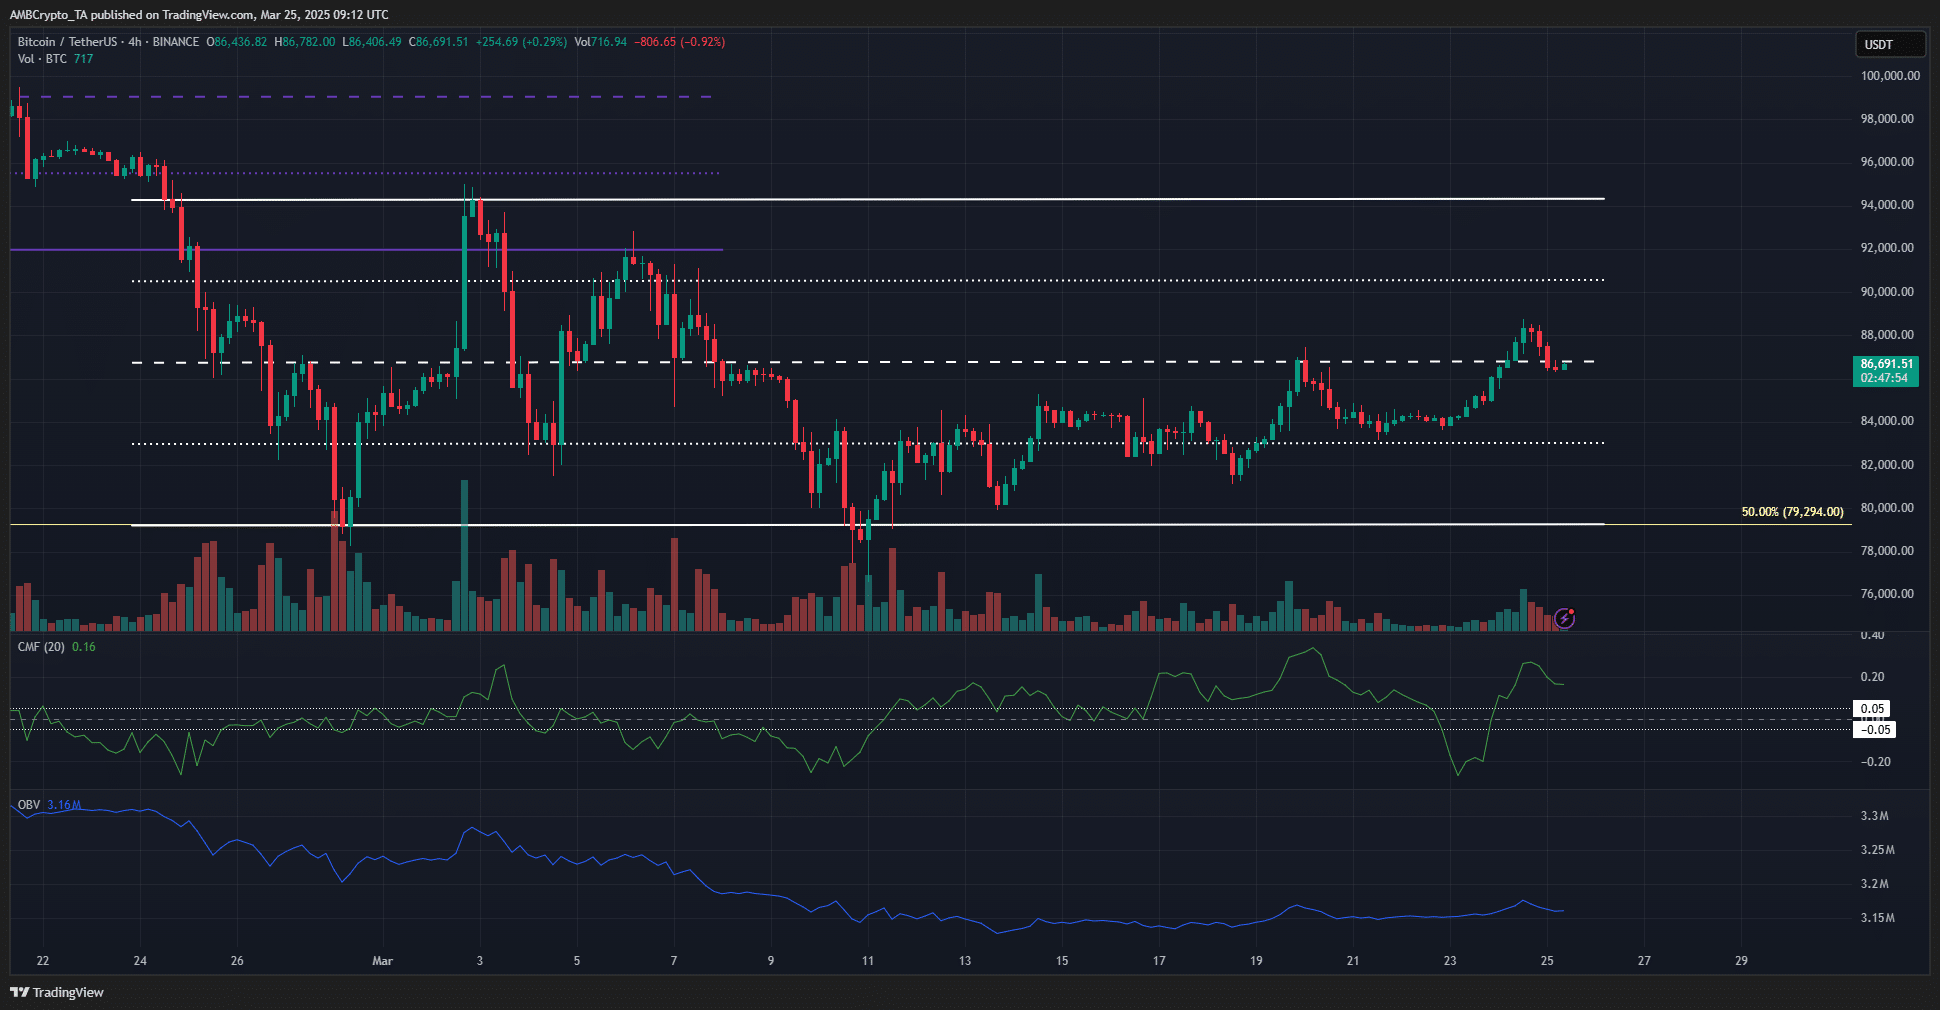
Since late February, Bitcoin’s price has traded within a range of $79.2k to $94.3k, with a mid-point at $86.8k. On the 24th of March, the price surpassed this local resistance.
Following the move, there was a minor 2% pullback, but Bitcoin still showed potential for further gains. On the 4-hour chart, the price action remains bullish, supported by higher highs and higher lows over the past week.
The CMF indicated bullish momentum with a reading of +0.16, reflecting strong capital inflows. Meanwhile, the OBV has gradually risen over the past ten days but has yet to reach the local highs observed on the 3rd of March.
Key resistance levels to monitor are $90.5k and $94.3k, representing Bitcoin’s immediate bullish targets.
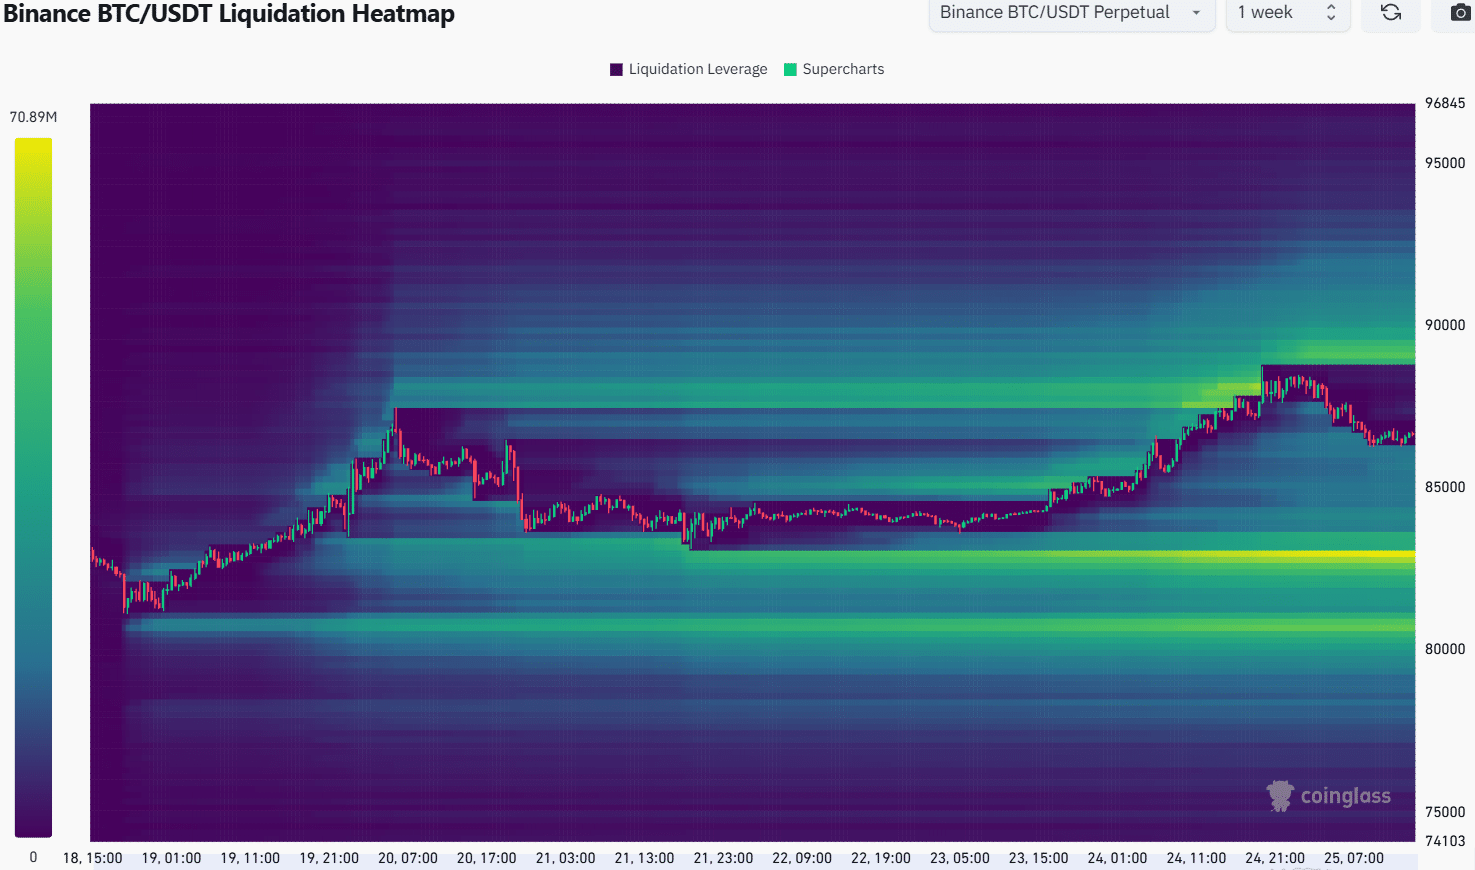
The 1-week liquidation heatmap showed rejection at the $88.2k liquidity cluster on 24th of March. Another significant liquidity pocket has formed between $88.9k and $89.7k, just below the $90k psychological level.
A strong magnetic zone was identified at $83k, but its distance from the current BTC price of $86.6k suggests an upward move is more likely. This short-term bullish outlook is further supported by technical analysis of the 4-hour chart.
However, a bearish reversal could occur in the $89k-$89.7k range. Swing traders should consider taking profits in this region. The next resistance at $90.5k may present a challenging hurdle for the bulls.
Disclaimer: The information presented does not constitute financial, investment, trading, or other types of advice and is solely the writer’s opinion