
- Bitcoin rallied by nearly 15% over the past two weeks after rebounding from its $55.8k support
- BTC’s derivates data showed a slight bullish edge for the long term
Bitcoin entered a relatively high liquidity zone after its recent rally, which helped the coin reclaim a spot above the 200-day EMA.
Although the bulls had an edge at its press time price point, any decline below the 20 and 50-day EMAs could delay immediate recovery prospects in the short term.
The king coin recently broke down from a bullish chart pattern after reaching the ‘Point of Control (POC)’ – A level that’s typically characterized by the highest trading levels at specific price points. At press time, the crypto was trading at $64,304, down by nearly 3% in the last 24 hours.
A rising wedge breakdown
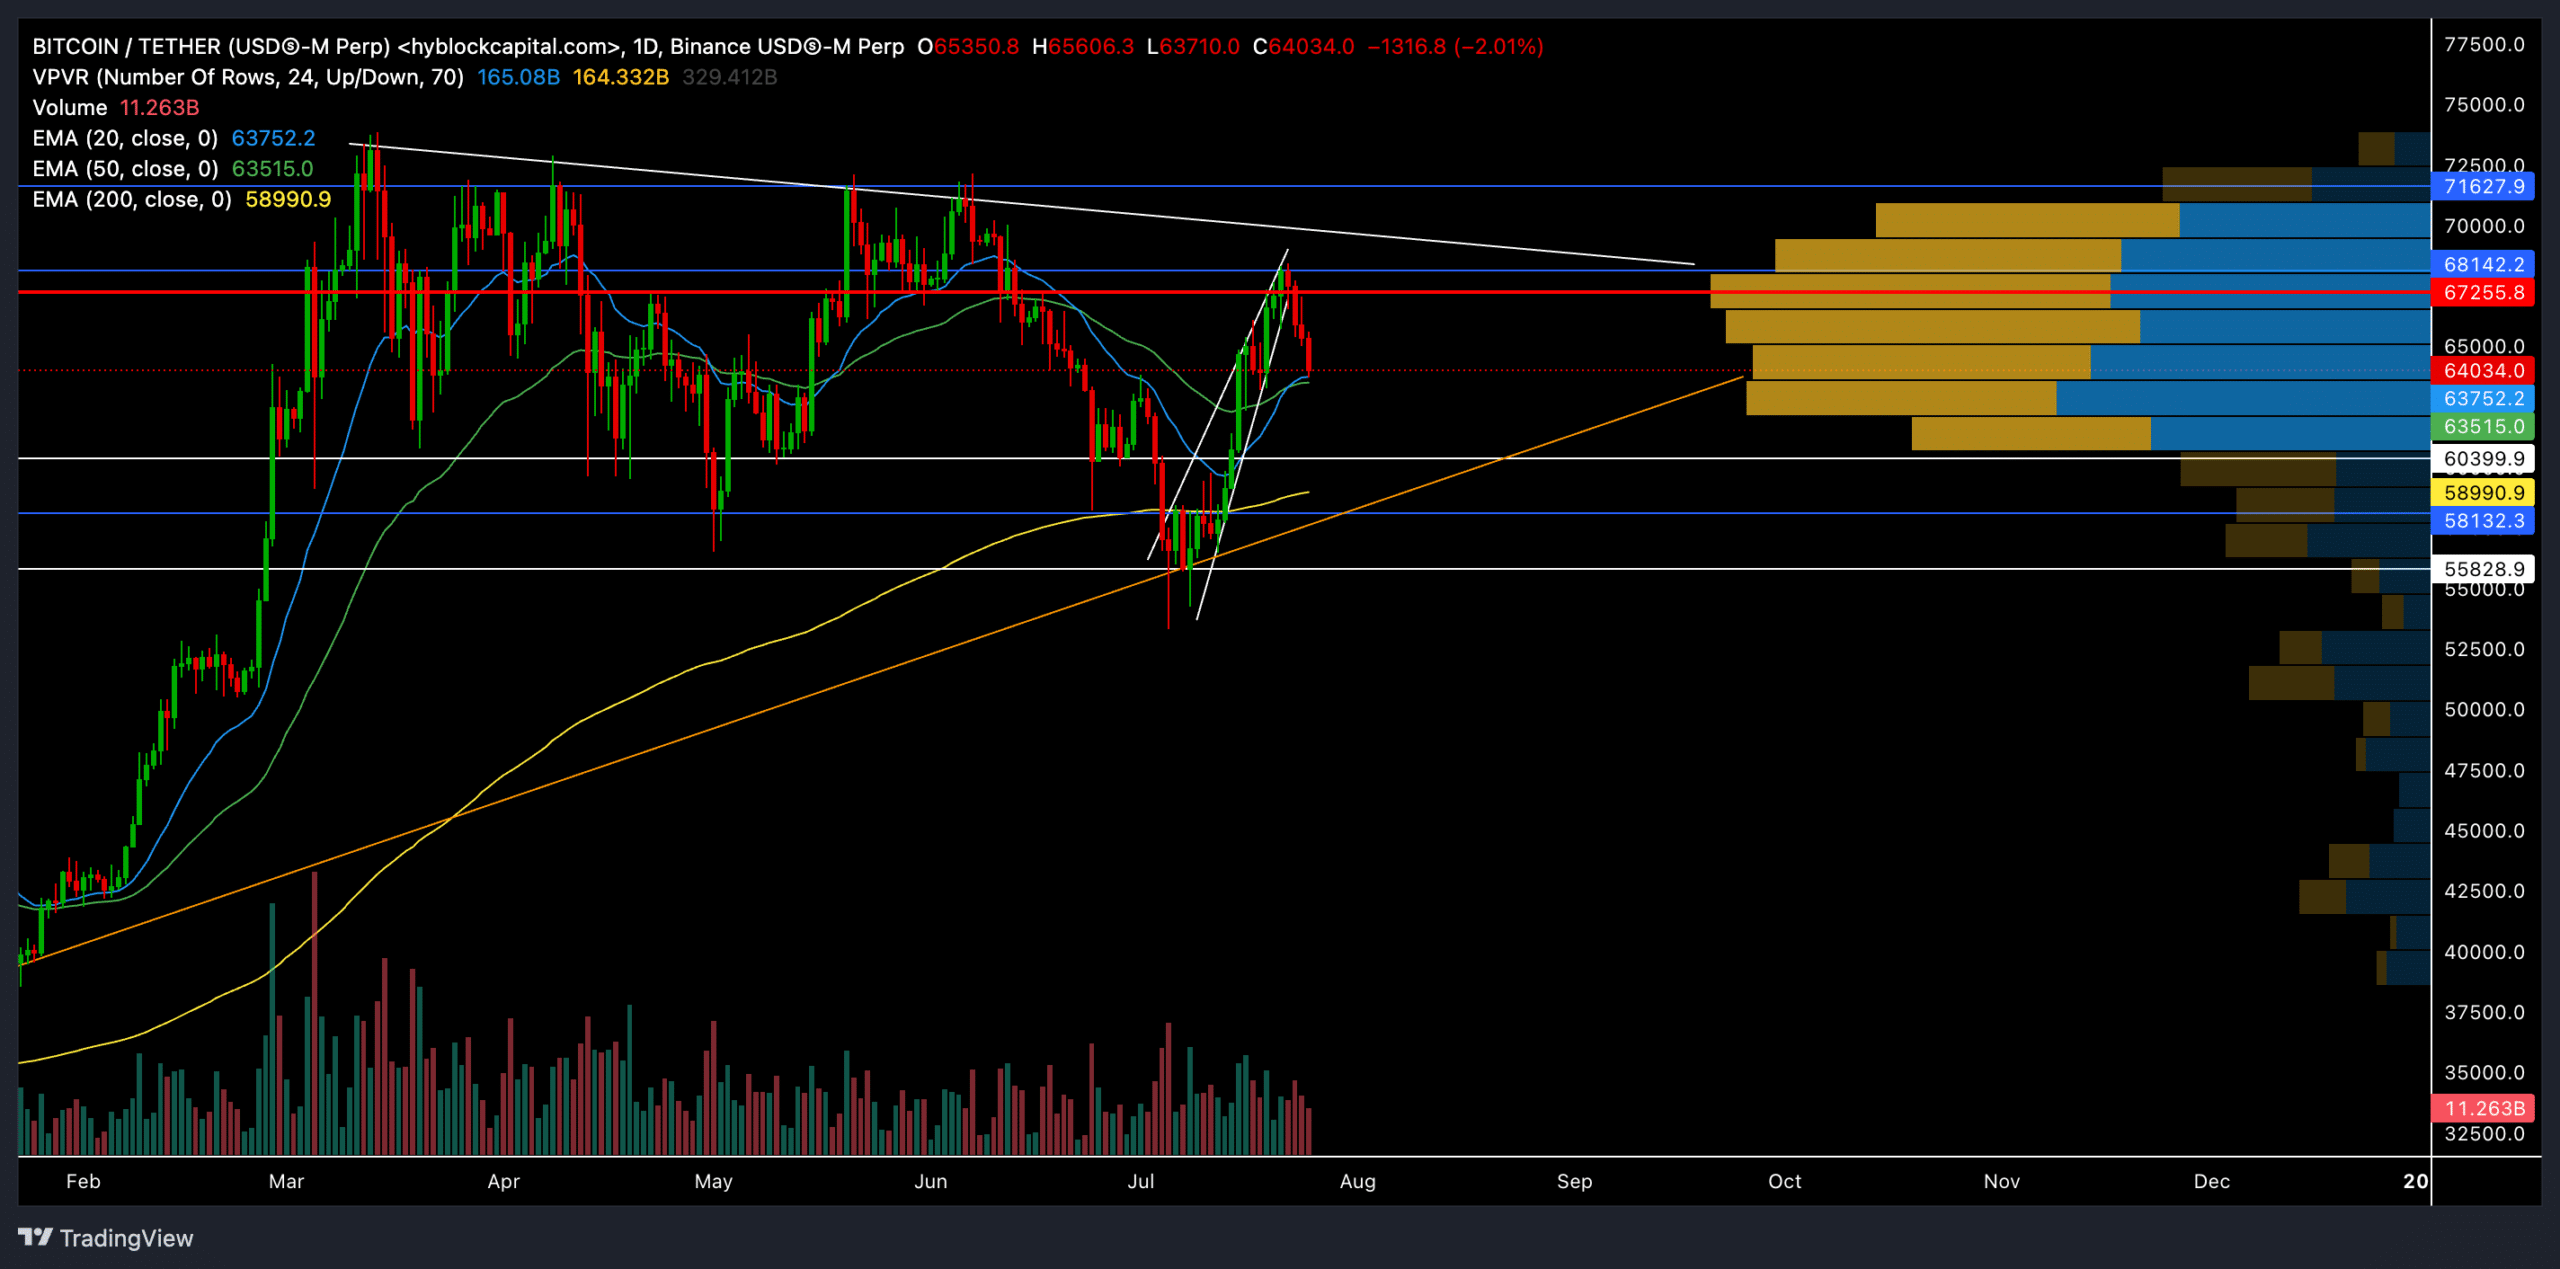
Source: TradingView, BTC/USDT
BTC has found an oscillating range between $55.8K and $71.6K for over four months now. The coin’s last rebound from the upper boundary of this range propelled a nearly 21% monthly downturn until 6 July.
In the meantime, BTC closed below its 200-day EMA after over nine months, indicating a strong bearish edge. However, the bulls re-entered the market and provoked an upturn from the $55.8K support level.
Consequently, Bitcoin chalked out a classic rising wedge on its daily chart. Such a pattern often provokes a trend reversal in the short term. Thus, BTC saw an expected breakdown after the pattern approached the POC (red horizontal line) level.
The coin would likely see less volatility in the short term since it’s currently trading in a relatively high liquidity zone.
Here, it’s worth noting that the price action managed to stay above the 20, 50, and 200-day EMAs at press time. Although this pointed to a slight bullish edge, any decline below the 20 and 50-day EMAs can provoke a downtrend towards the $60.3K support level.
BTC would likely rebound from this support level, especially given the confluence of the support levels.
The RSI also saw a steep downtrend, but was yet to close below the 50-mark. Any close below this level will confirm an ease in buying pressure. Similarly, buyers should look for a potential bearish cross on the MACD lines to gauge the near-term sentiment.
Derivates data says…

The increase in options open interest, despite a drop in volume, indicated new positions being opened for longer-term expectations of volatility.
The dominance of long positions in the face of recent price drops could indicate that the market sentiment, at least among smaller traders, remains somewhat bullish or hopeful for a recovery.


![Bitcoin [BTC]](https://ambcrypto.com/wp-content/uploads/2025/06/Erastus-2025-06-25T110829.705-1-400x240.png)


