Bitcoin price prediction – How high can the U.S.-Iran peace deal push it?
After a brief pullback, the U.S. stock market climbed towards all-time highs on optimism about peace talks. Meanwhile, Bitcoin bulls were fighting an uphill battle.

The two-day meeting of the U.S. Federal Reserve’s open market committee (FOMC) will conclude on the 17th of June. The Fed’s new chair, Kevin Warsh, will make the rate-related decision on the same day.
The FedWatch Tool showed that the market has all but decided that the Fed would hold the interest rate steady at 3.50%-3.75%. Some short-term Bitcoin [BTC] price volatility around the hours of the announcement is still possible.
Recently, AMBCrypto reported that the optimism around the U.S.-Iran peace deal helped fuel the recent move to the $65k level. This recovery was on thin ice because of declining spot volumes that indicated limited market conviction.
Bitcoin may have already peaked following recent macro optimism. Moreover, the $67.3k level could mark the high‑water point for its next move.
Bitcoin has not yet witnessed its extreme bear phase
In a post on X, a crypto analyst observed that miner pressure increased dramatically in June after Bitcoin fell to a low of $59.1k. The analyst argued that the price dump forced miners to reduce or diversify their operations to lower costs.
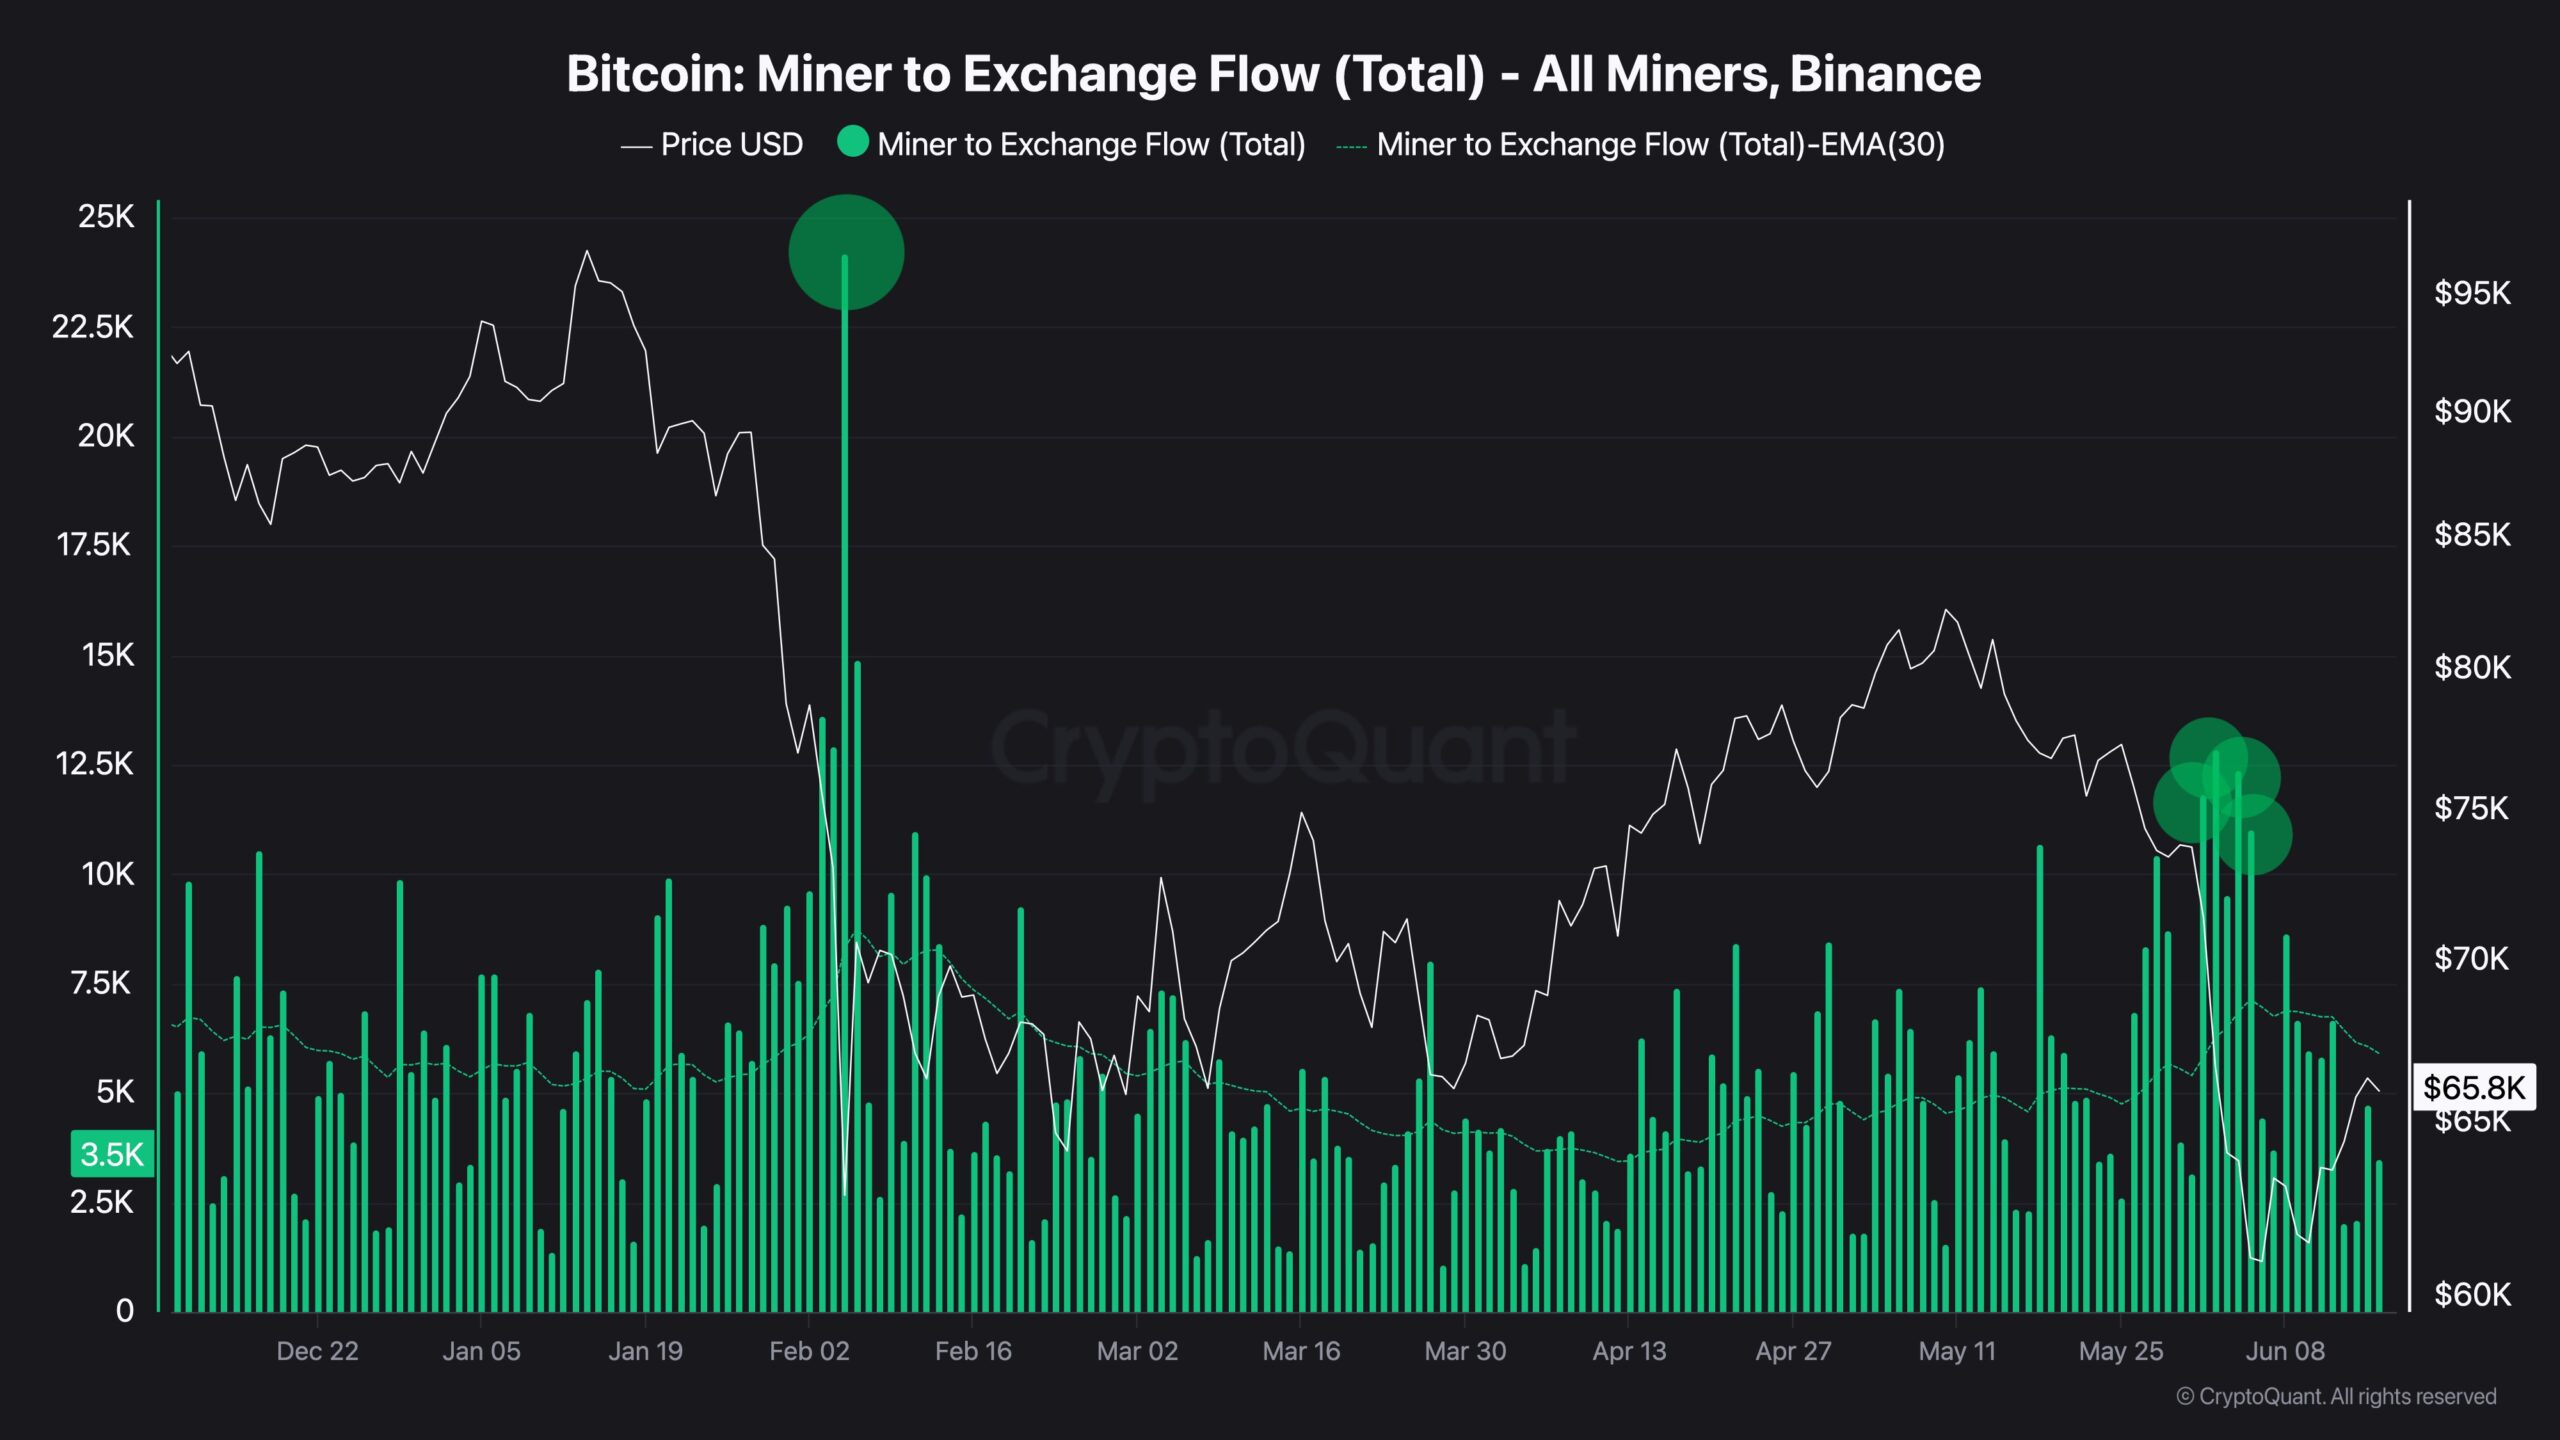
The hashrate has fallen 28% since last October, supporting this idea. Moreover, February and the one earlier in June had some similarities.
They both forced increased BTC miner inflows to exchanges. The production cost was at $76k, but market prices were far lower, forcing them to operate at a loss and sell some inventory to keep up with operational expenses.
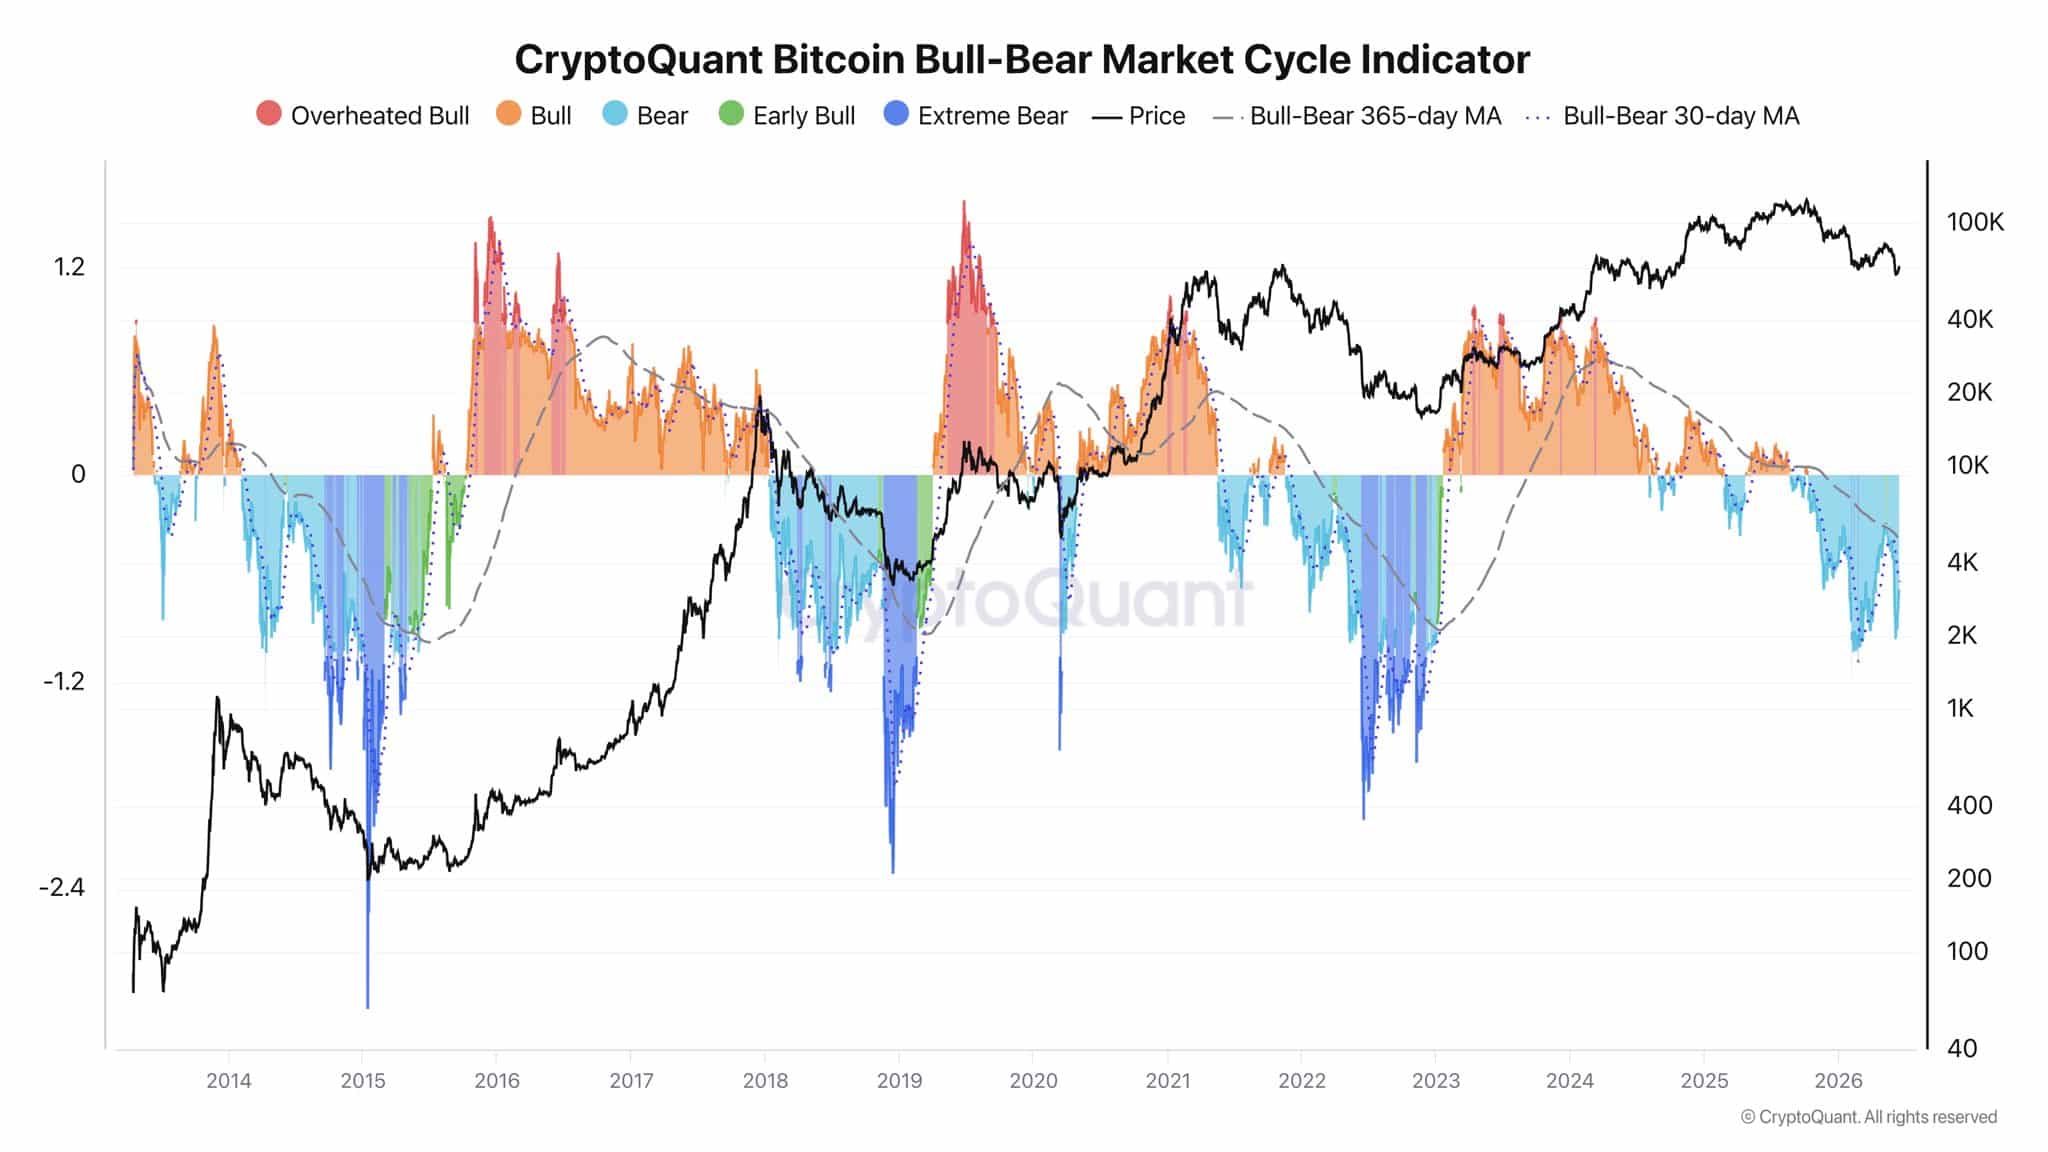
Notably, each cycle can be broken down into five distinct phases, from overheated bull to extreme bear. Based on the metric above, the threshold for extreme bear has not yet been reached.
Bitcoin price prediction: More losses to come?
The on-chain data shows miners and holders facing heavy losses, and the capitulation has not yet ended. From a price action perspective, the trend remained bearish from the weekly down to the 4-hour timeframes.
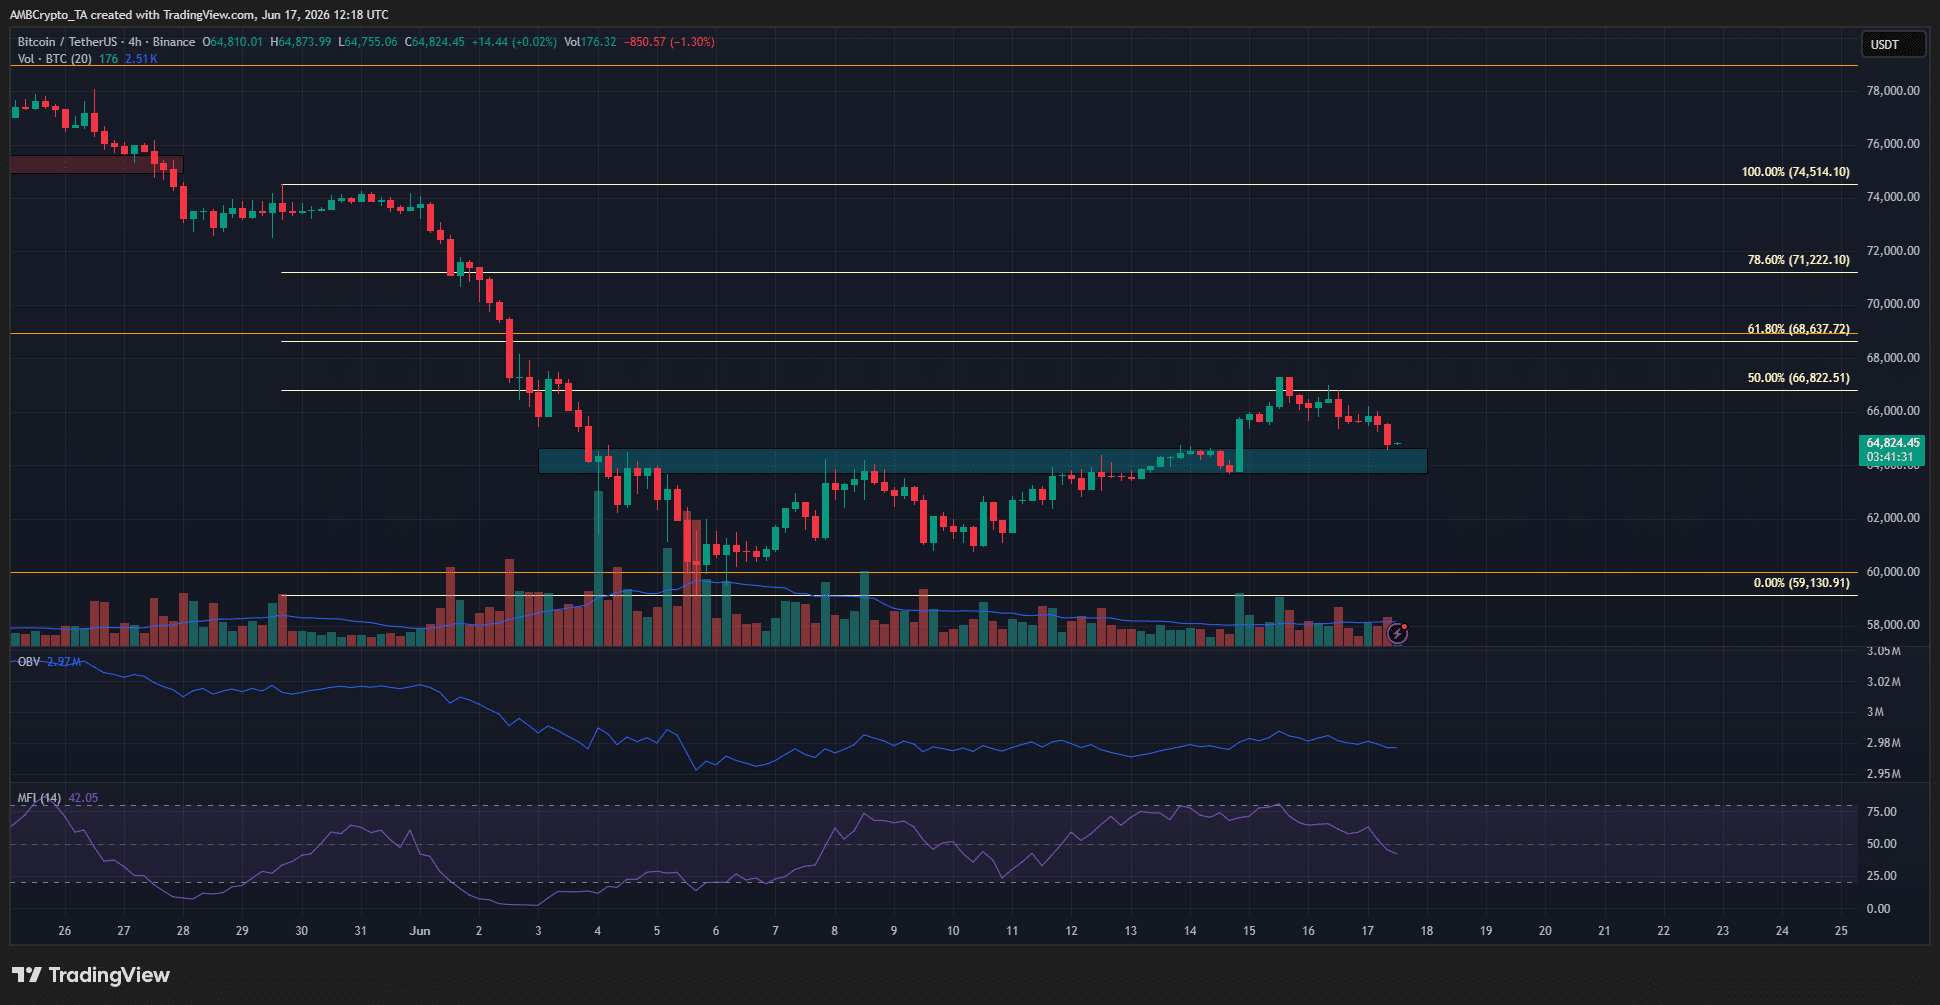
The swing structure on the 4-hour chart was bearish. The recent U.S.-Iran peace talks saw a BTC bounce that reached just beyond the 50% retracement level at $66.8k.
However, the rejection in recent days could see a drop below the $64k support zone (cyan). This scenario would increase the chances of a drop below the $59.1k level.
Final Summary
- Though the stock markets were roaring higher, the recent uptick came as peace talk optimism grew.
- Bitcoin was unable to move to the $70k resistance. Another sell-off is possible, and a drop below $64k would signal the continuation of the downtrend.