Bitcoin Rainbow Chart flashes ‘BUY’ signal: Time to grab BTC?
Since its March high and subsequent decline, BTC remained within the ‘accumulate’ and ‘buy’ zones on rainbow chart.

- The Bitcoin Rainbow Chart and other key metrics signaled ‘BUY’ at press time.
- Market pundits expect bullish Q4 and 2025 — Should you hold on or jump in?
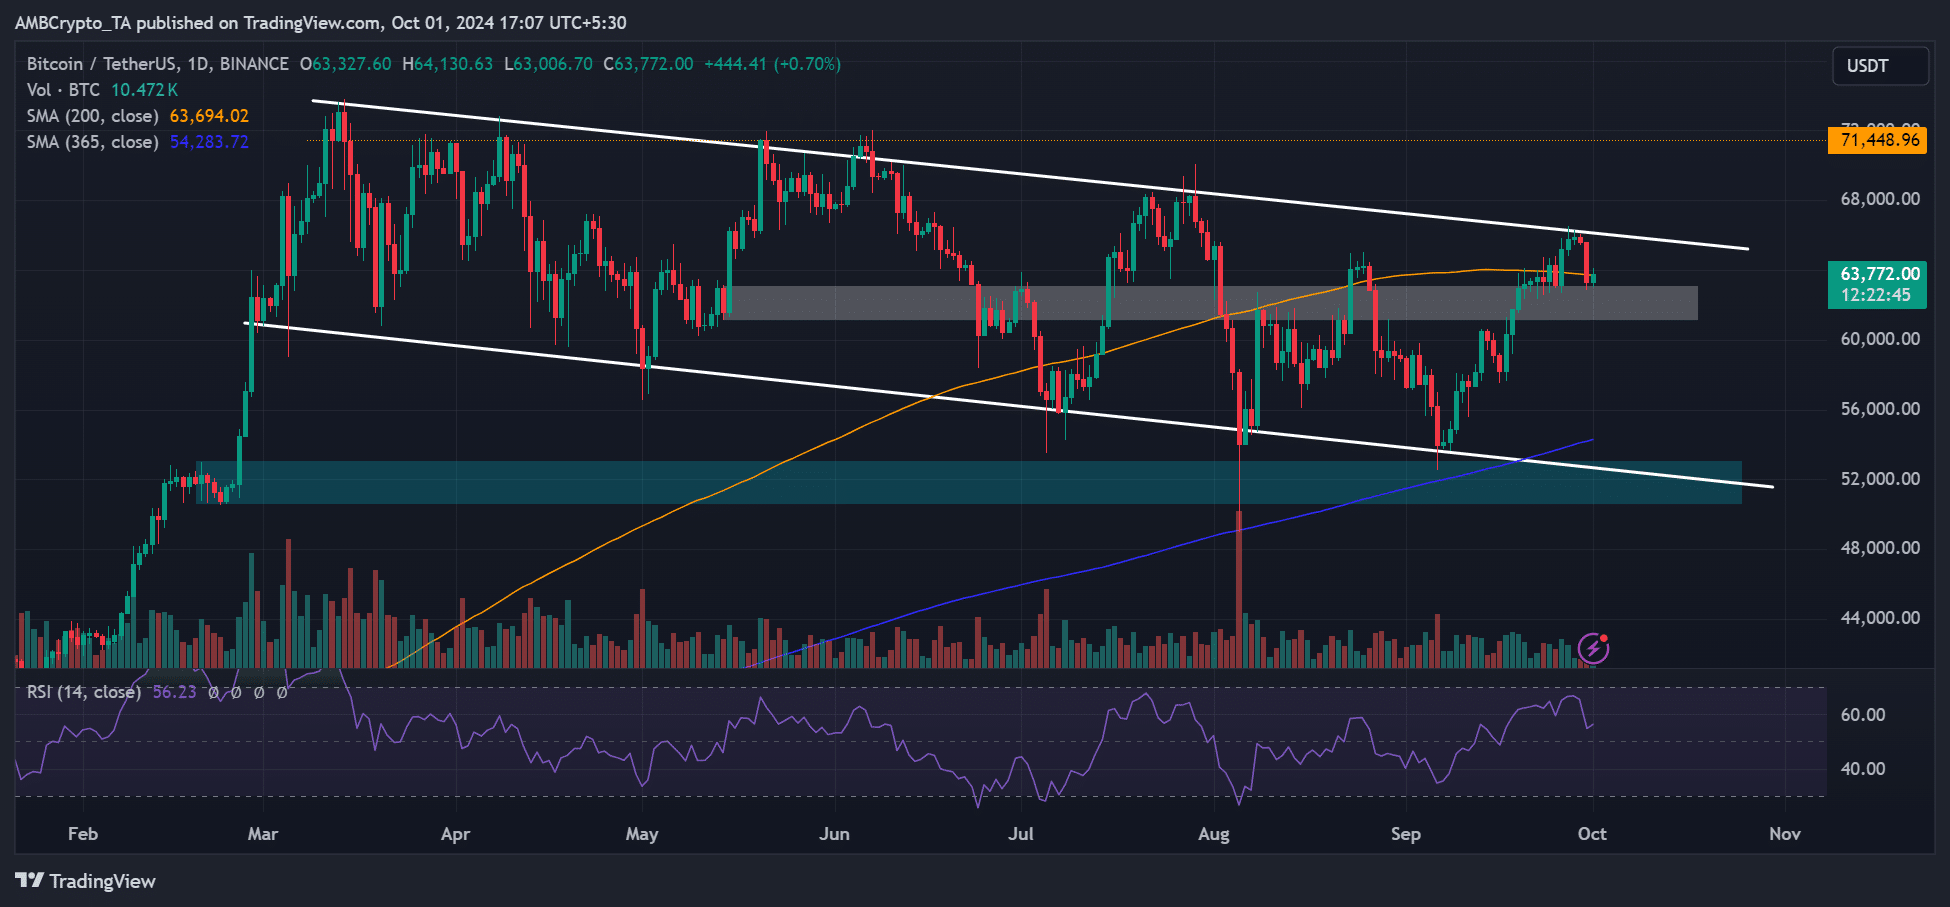
Bitcoin [BTC] has been consolidating within $60K—$70K for the past seven months. Despite the boring price action, the current BTC value was still a great buy opportunity ahead of a historically bullish Q4.
According to the Bitcoin Rainbow Chart, BTC’s current value was still within the ‘buy’ zone.
In fact, since its March and subsequent retracement, the asset has been firmly within the ‘accumulate’ and ‘buy’ zones.
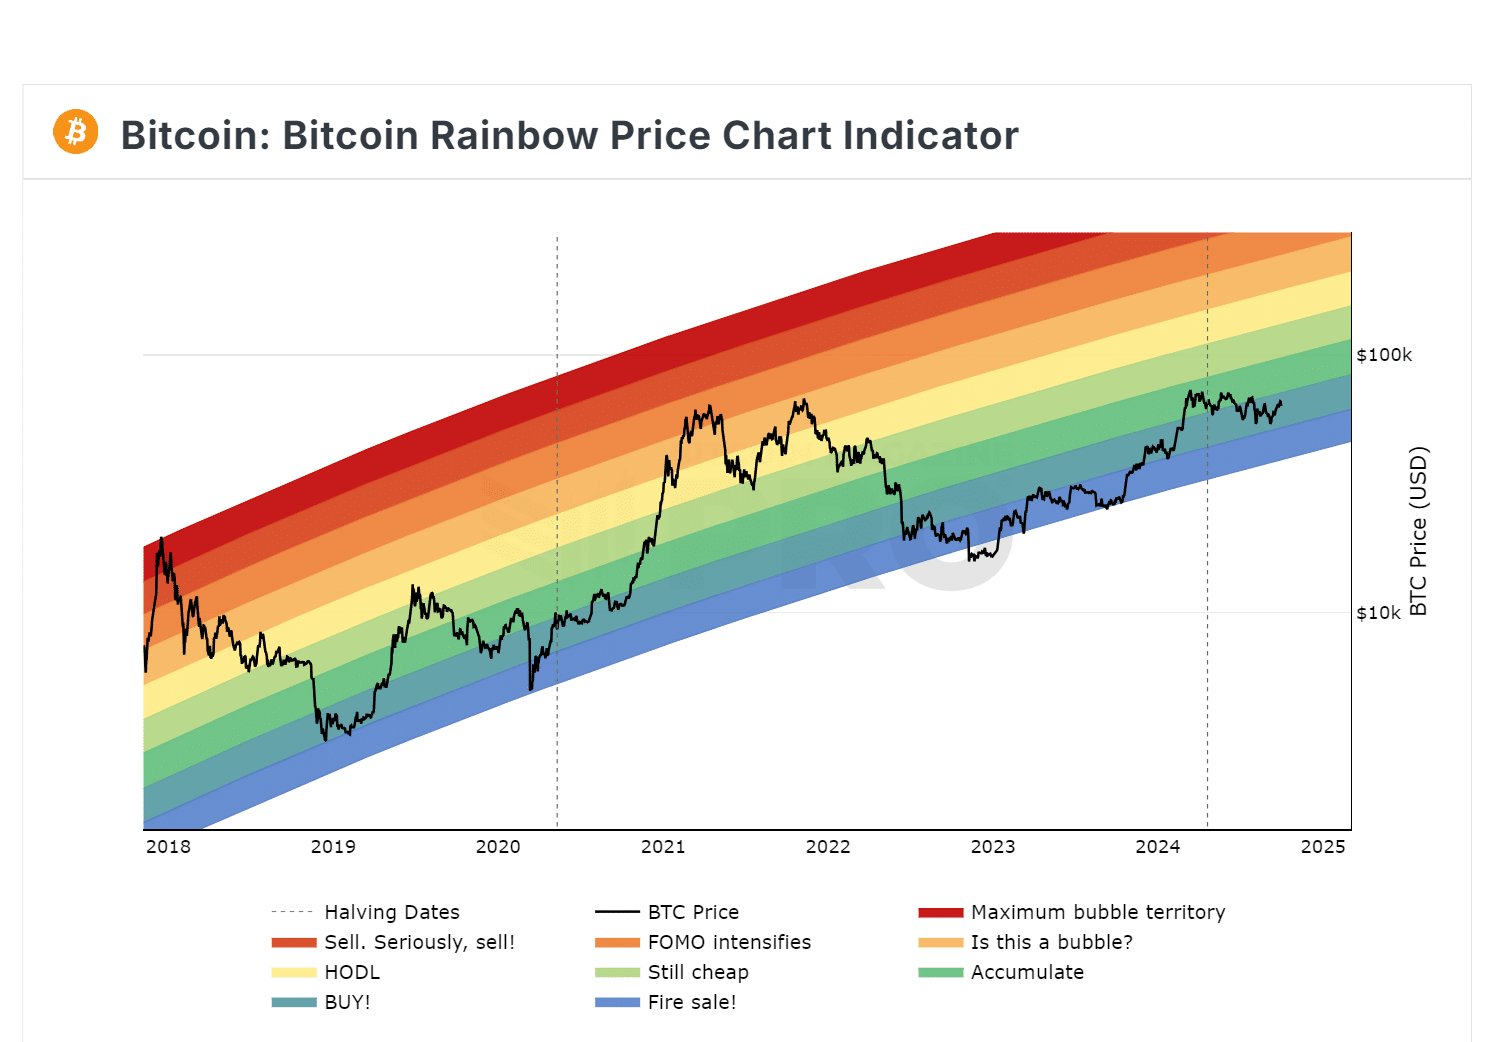
For context, the Rainbow Chart gauges BTC valuation based on historical prices but is presented visually through rainbow colors.
Lower color bands signal undervalued BTC, while higher bands denote overheated market and potential corrections.
Is BTC still discounted?
Other key valuation metrics also signaled that BTC was relatively ‘cheap’ at press time value.
According to the Pi Cycle Top indicator, BTC was far from hitting this cycle’s top, as denoted by the wide gap between the 111-day MA (Moving Average) and 350-day MA multiple (350 DMAx2).
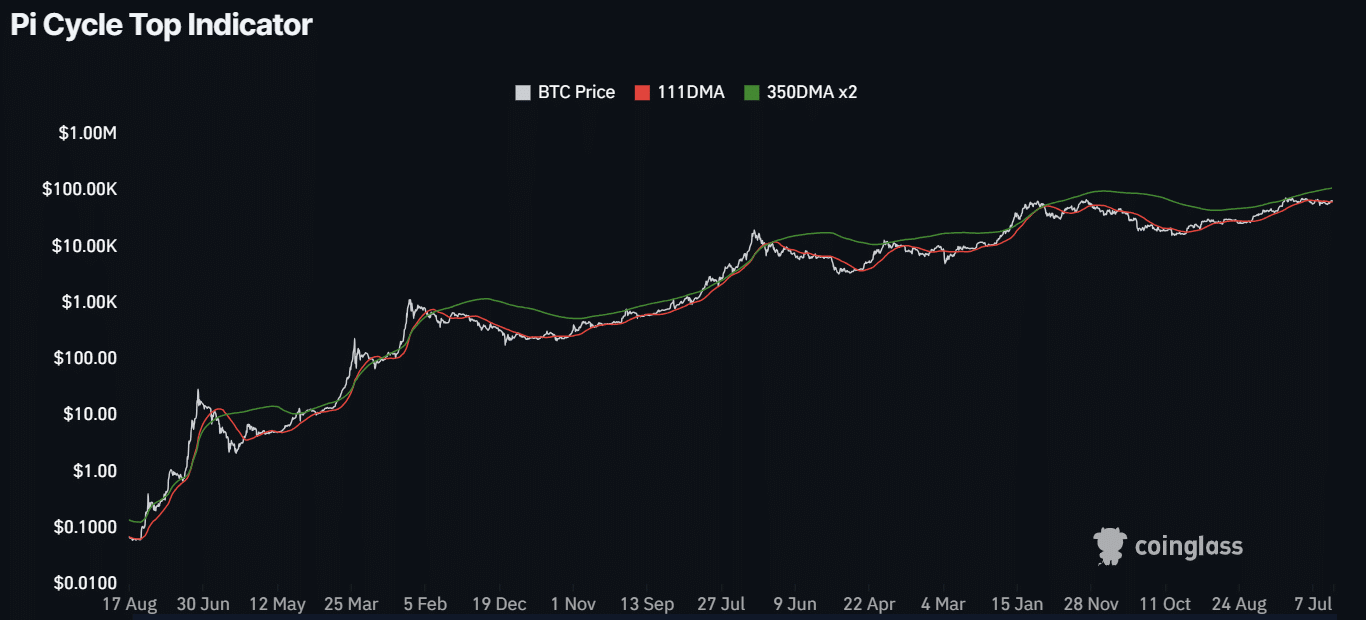
For the unfamiliar, the Pi Cycle Top metric has effectively captured BTC cycle tops with a 3-day accuracy. Historically, cycle tops have been hit after 111 DMA hiked and crossed 350DMAx2.
The wide gap at press time meant BTC’s bull run could extend.
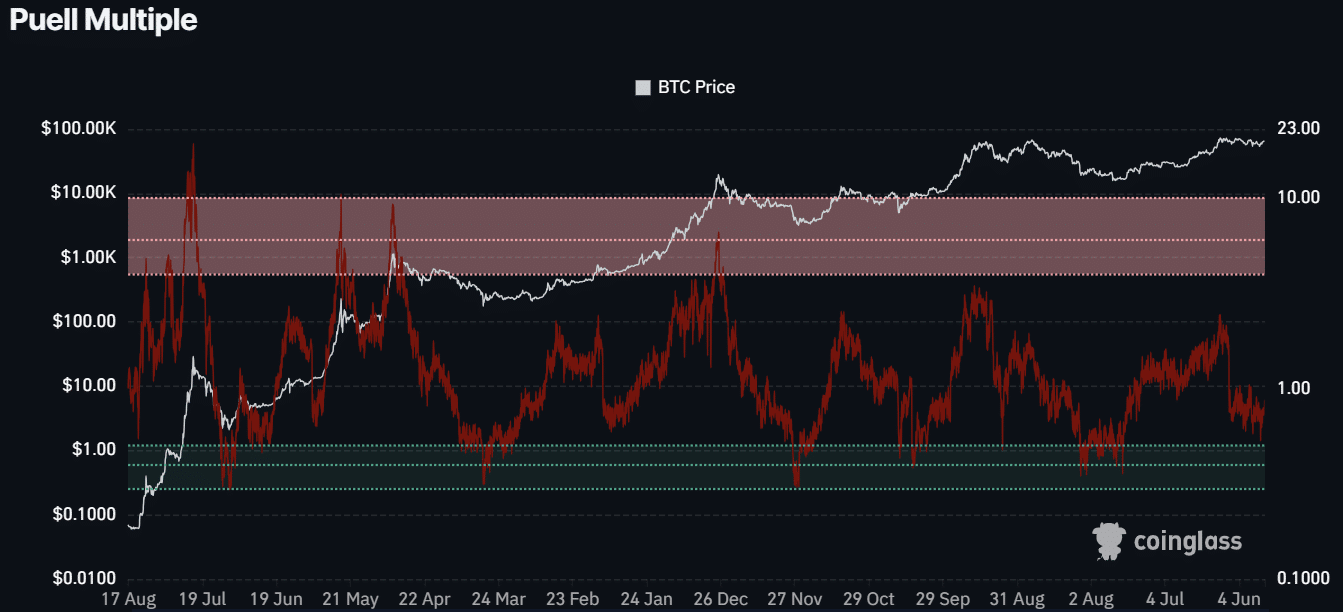
In short, BTC was relatively undervalued at press time. A similar outlook was illustrated by the Puell Multiple, which evaluates whether BTC is overpriced using BTC miners’ profitability.
The green zone is synonymous with undervalued BTC, while the overhead zone signals an overheated market.
Based on the press time reading, 0.73, BTC was grossly underpriced, suggesting a great buying opportunity for investors.
Besides the above valuation metrics, key industry figures and firms have made high BTC price targets for end-2024 and 2025. Standard Chartered Bank predicted the asset could hit $250K by 2025.
On his part, CK Zheng, founder of crypto-focused hedge fund ZX Squared Capital, BTC, would hit an ATH in Q4 2024, regardless of who wins the US elections.
The executive cited high US national debts and fiscal deficits as reasons why BTC would become more lucrative amid the Fed rate cut cycle.
If the predictions come true, Q4 2024 and 2025 would offer huge BTC returns, potentially breaking above the 7-month long price range. If so, the current BTC value could be deemed grossly discounted.