Bitcoin Rainbow Chart reveals October rally could spur bull run – All the details
Bitcoin is in a good buying zone for long-term investors, according to the Rainbow Chart.

- The Rainbow Chart showed the bottom is closer than the top for BTC
- Falling NUPL noted reduced selling pressure from profit-takers
Thirteen months ago, Bitcoin [BTC] was trading at $25.7k. Last September, the market was in despair and the halving event was at least seven months away. This sentiment shifted in October amid rumors of a potential spot ETF approval from the SEC. Inflation also appeared to have peaked.
These factors contributed to Bitcoin’s attractiveness to potential buyers, and the prices trended higher to reach an all-time high of $73.7k in March 2024. Can this October also initiate a rally that breaks the yearly highs?
Bitcoin Rainbow Chart encourages investors
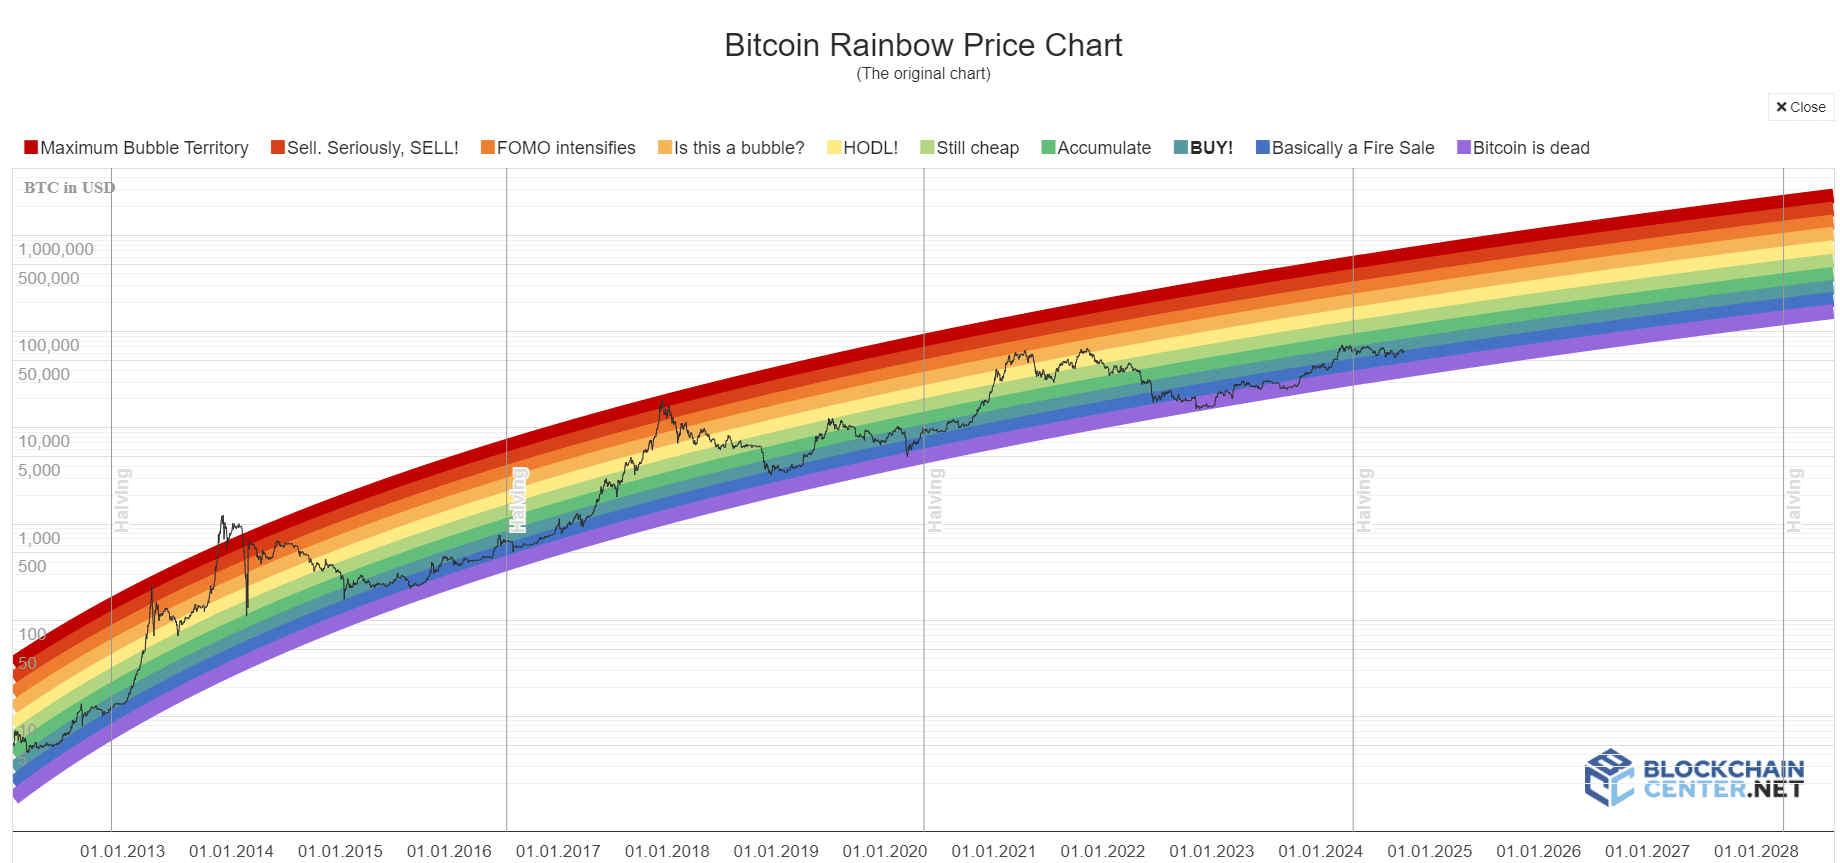
Bitcoin’s Rainbow Chart is a fun way of looking at the long-term price trends of Bitcoin. It uses a logarithmic scale to plot Bitcoin’s price, and color codes them to show investors whether they should be buying, selling, or HODLing.
It is not an exact tool, but it does surprisingly well in terms of predictions and timing the cycle top and bottom, especially the latter. While in recent months it has fallen towards the “Bitcoin is dead” territory, has not quite reached the ideal buy zone yet.
BTC is still within a good buy zone though, with the Bitcoin Rainbow Chart describing it as “a fire sale.” Comparing this cycle’s performance with the previous one, the latter half of October could be when Bitcoin embarks on a strong rally.
This rally could be the bull run that follows a halving event.
Downtrend since April has impacted holder profitability
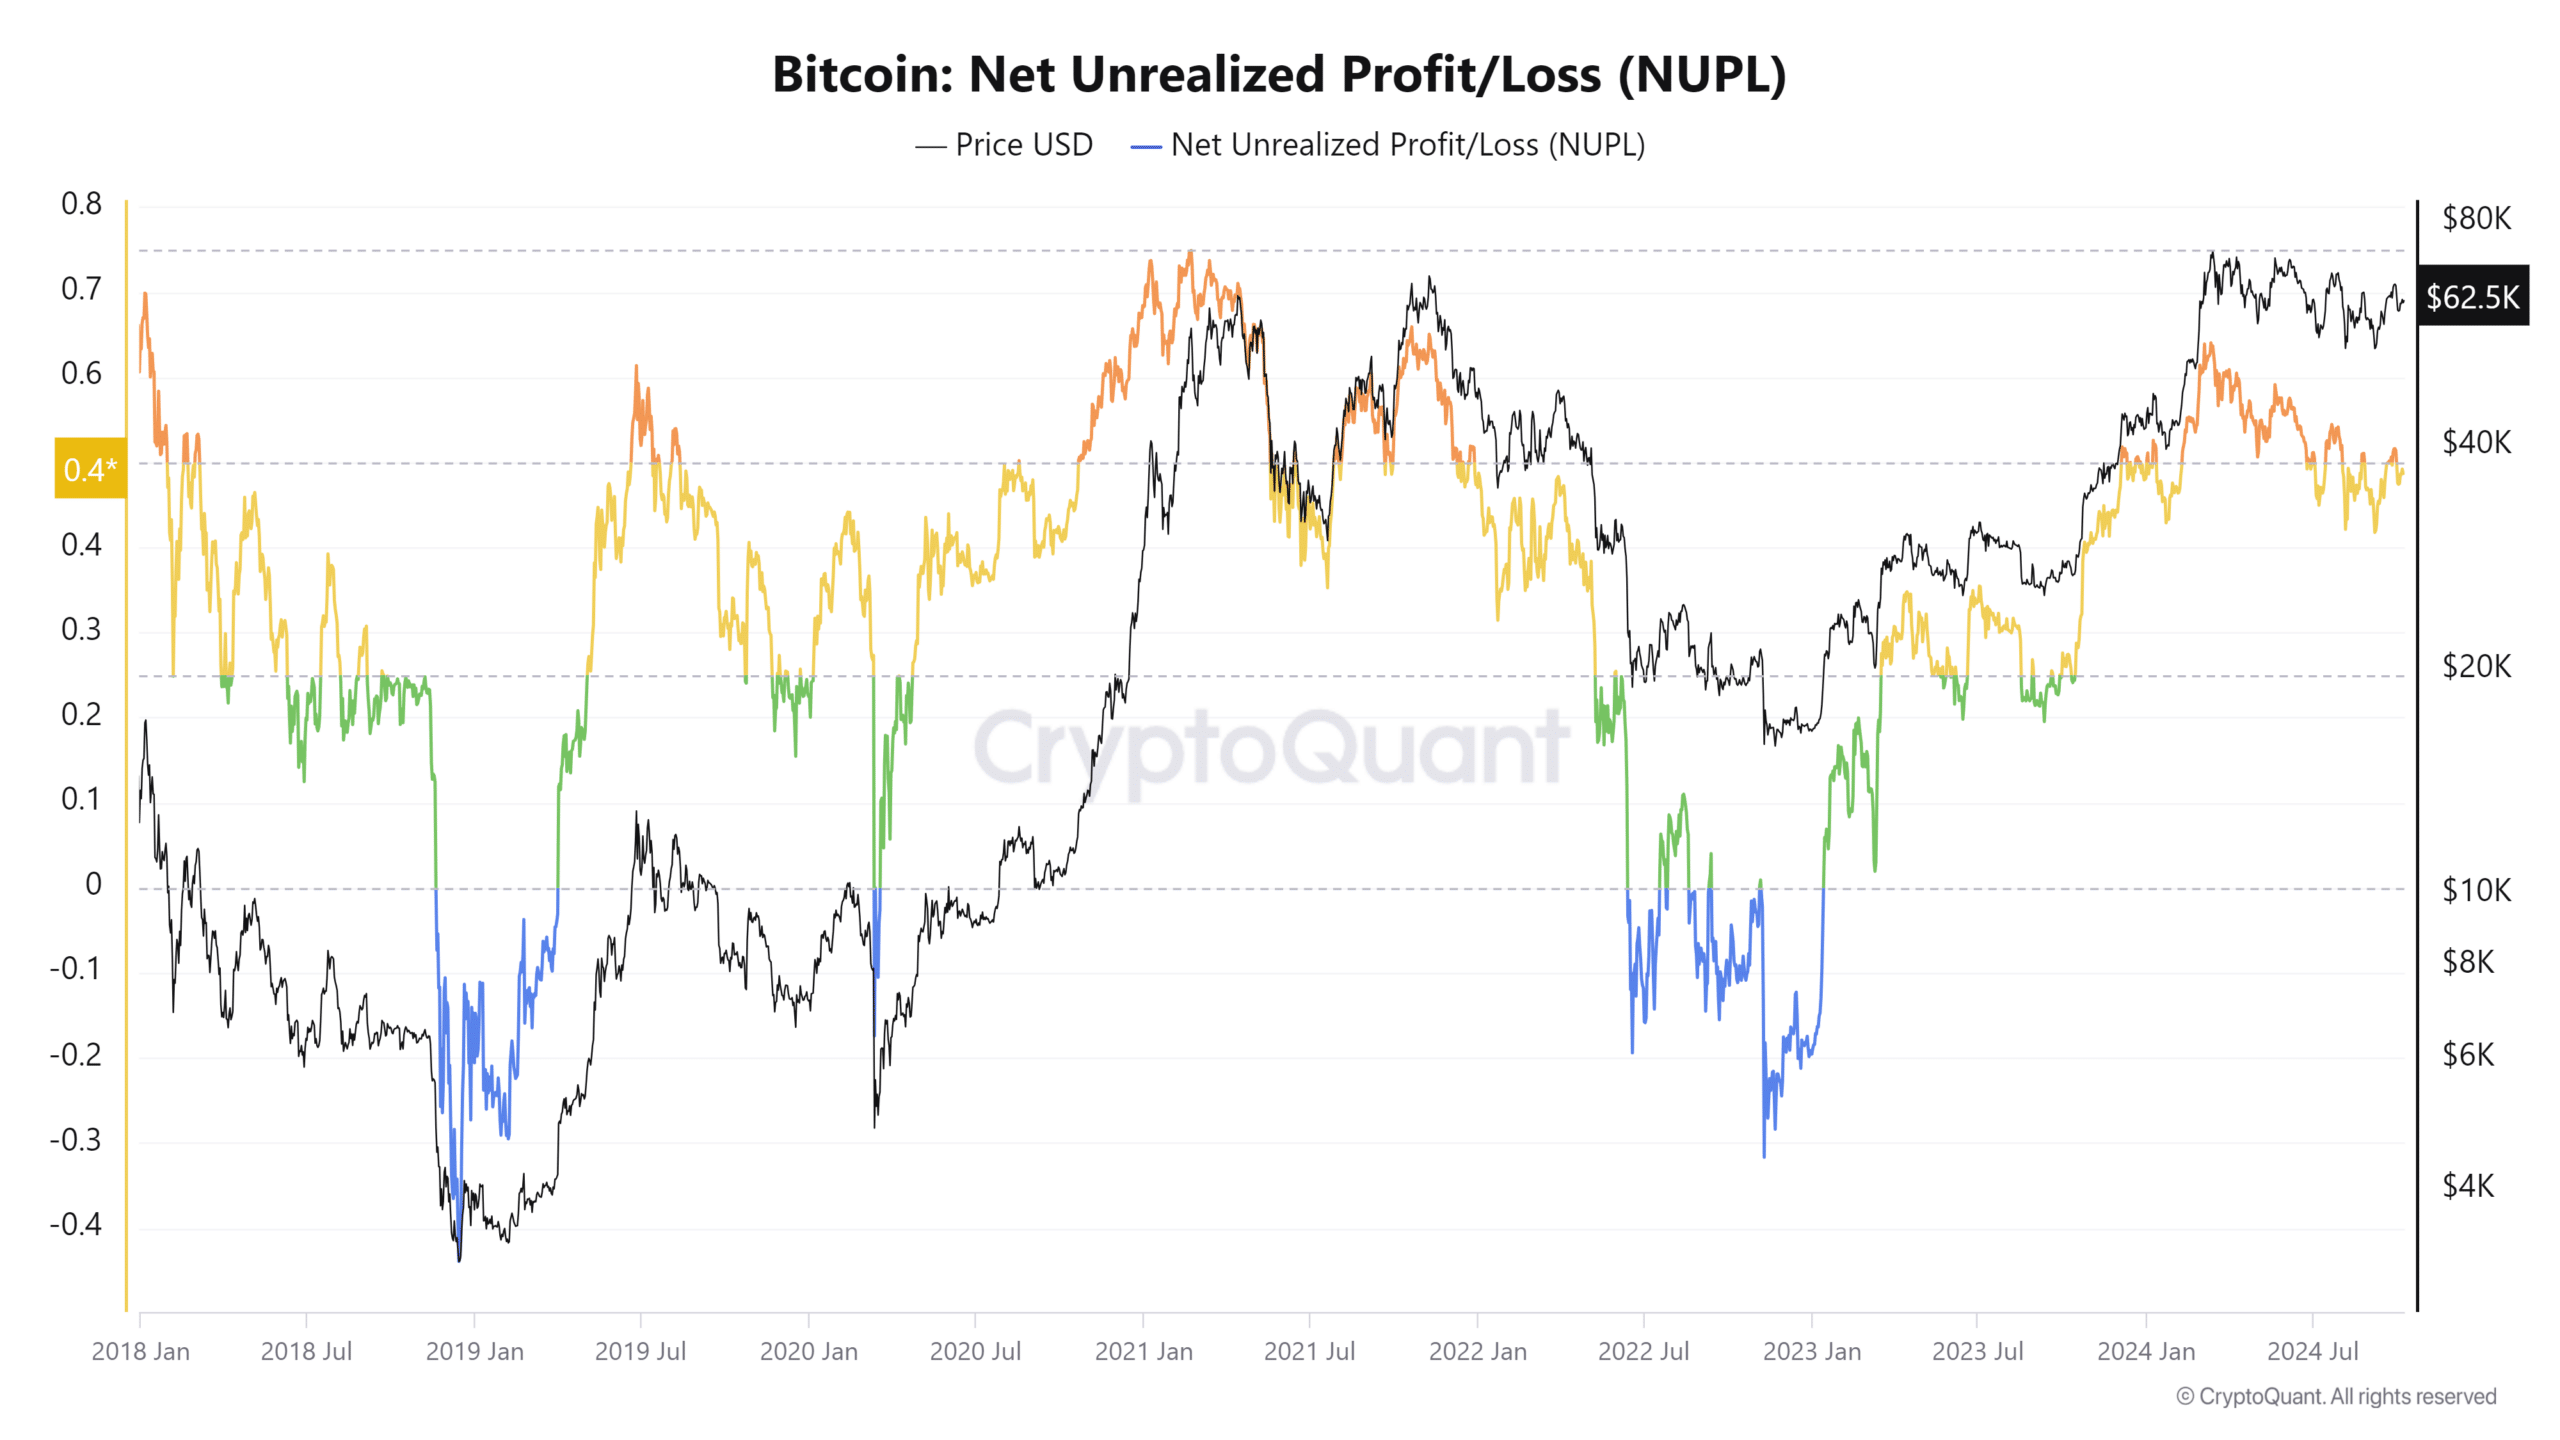
At press time, the Net Unrealized Profit/Loss metric was at 0.47 – A sign that the market cap was greater than the realized cap. Therefore, a good portion of holders may still be in profit, even though the price has been trending south over the past six months.
Read Bitcoin’s [BTC] Price Prediction 2024-25
The NUPL fell alongside the price too, showing that the intention to sell from holders in profit is likely in a decline. This means there is room for price appreciation in the coming months. A NUPL reading above 0.7 generally marks the cycle top.