
- The Bitcoin Rainbow chart entered the “buy” zone after 2020 and 2024 halvings.
- Market indicators hinted at a price decline in the coming days.
Investors’ confidence in Bitcoin [BTC] has somewhat dwindled as the king of crypto fails to go above $69k. However, the Bitcoin Rainbow Chart revealed that BTC was actually mimicking its 2020 trend post-halving.
Does this mean that BTC is all set to kickstart a rally?
The right time to buy Bitcoin?
Bitcoin’s price volatility has declined over the last few days. This has caused trouble for BTC, as it was struggling to go above $69k.
However, investors must not get disheartened, as BTC was mimicking its 2020 post-halving behavior.
AMBCrypto’s analysis revealed that after months of its third halving, the Bitcoin Rainbow chart revealed that the coin entered the “BUY” zone. After remaining in that zone for a few months, BTC’s price skyrocketed.
A similar trend was seen in BTC’s 2024 Rainbow chart, as it indicated that the coin was in the buy zone.
If that is to be considered, then this might just be the last opportunity for investors to buy BTC at a lower price before it moves up and enters the accumulate and HODL zones.

Source: BLOCKCHAINCENTER
AMBCrypto then analyzed BTC’s on-chain metrics to see whether investors have considered buying BTC as suggested by the Rainbow chart.
We found that its Exchange Outflow dropped last week after spiking on the 24th of May. Its Supply on Exchanges increased, meaning that investors chose to rather sell.
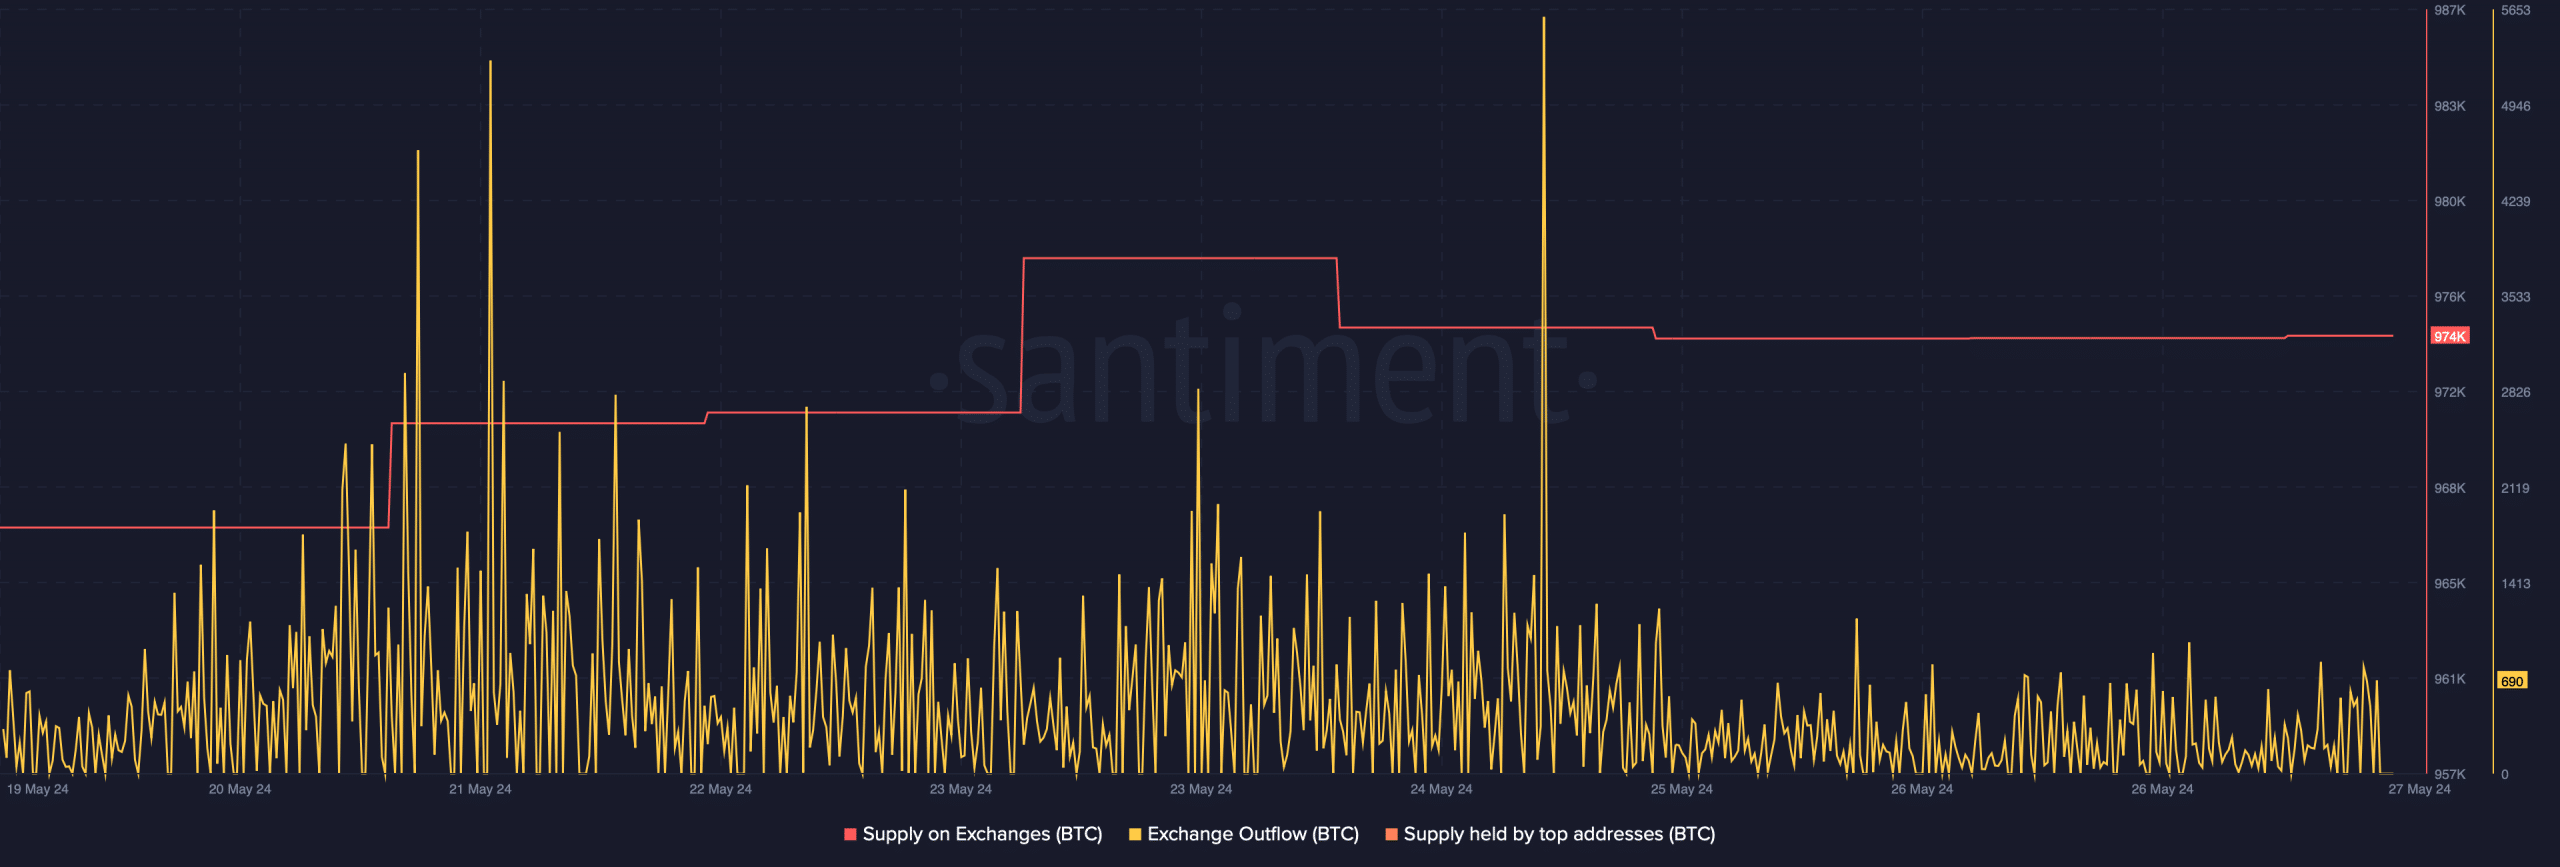
Source: Santiment
Our look at CryptoQuant’s data revealed that BTC’s net deposit on exchanges was high compared to the last seven-day average, further hinting at high selling pressure.
Apart from this, its Coinbase Premium was red, meaning that selling sentiment was dominant among U.S. investors.
Bitcoin’s troubles are far from ending
AMBCrypto then checked whether the rise in selling pressure could result in a price correction.
We found that investors weren’t following the Bitcoin Rainbow chart as its aSORP was red, suggesting that more investors are selling at a profit. In the middle of a bull market, it can indicate a market top.
At press time, BTC’s fear and greed index had a value of 74, meaning that the market was in a “greed” phase. Whenever the metric reaches that level, it indicates a price correction.

Source: CryptoQuant
Is your portfolio green? Check out the BTC Profit Calculator
Like metrics, most of the technical indicators also looked bearish. For instance, the MACD displayed the possibility of a bearish crossover.
The Relative Strength Index (RSI) registered a decline, indicating a price drop soon. Nonetheless, the Chaikin Money Flow (CMF) remained bullish as it went northwards.
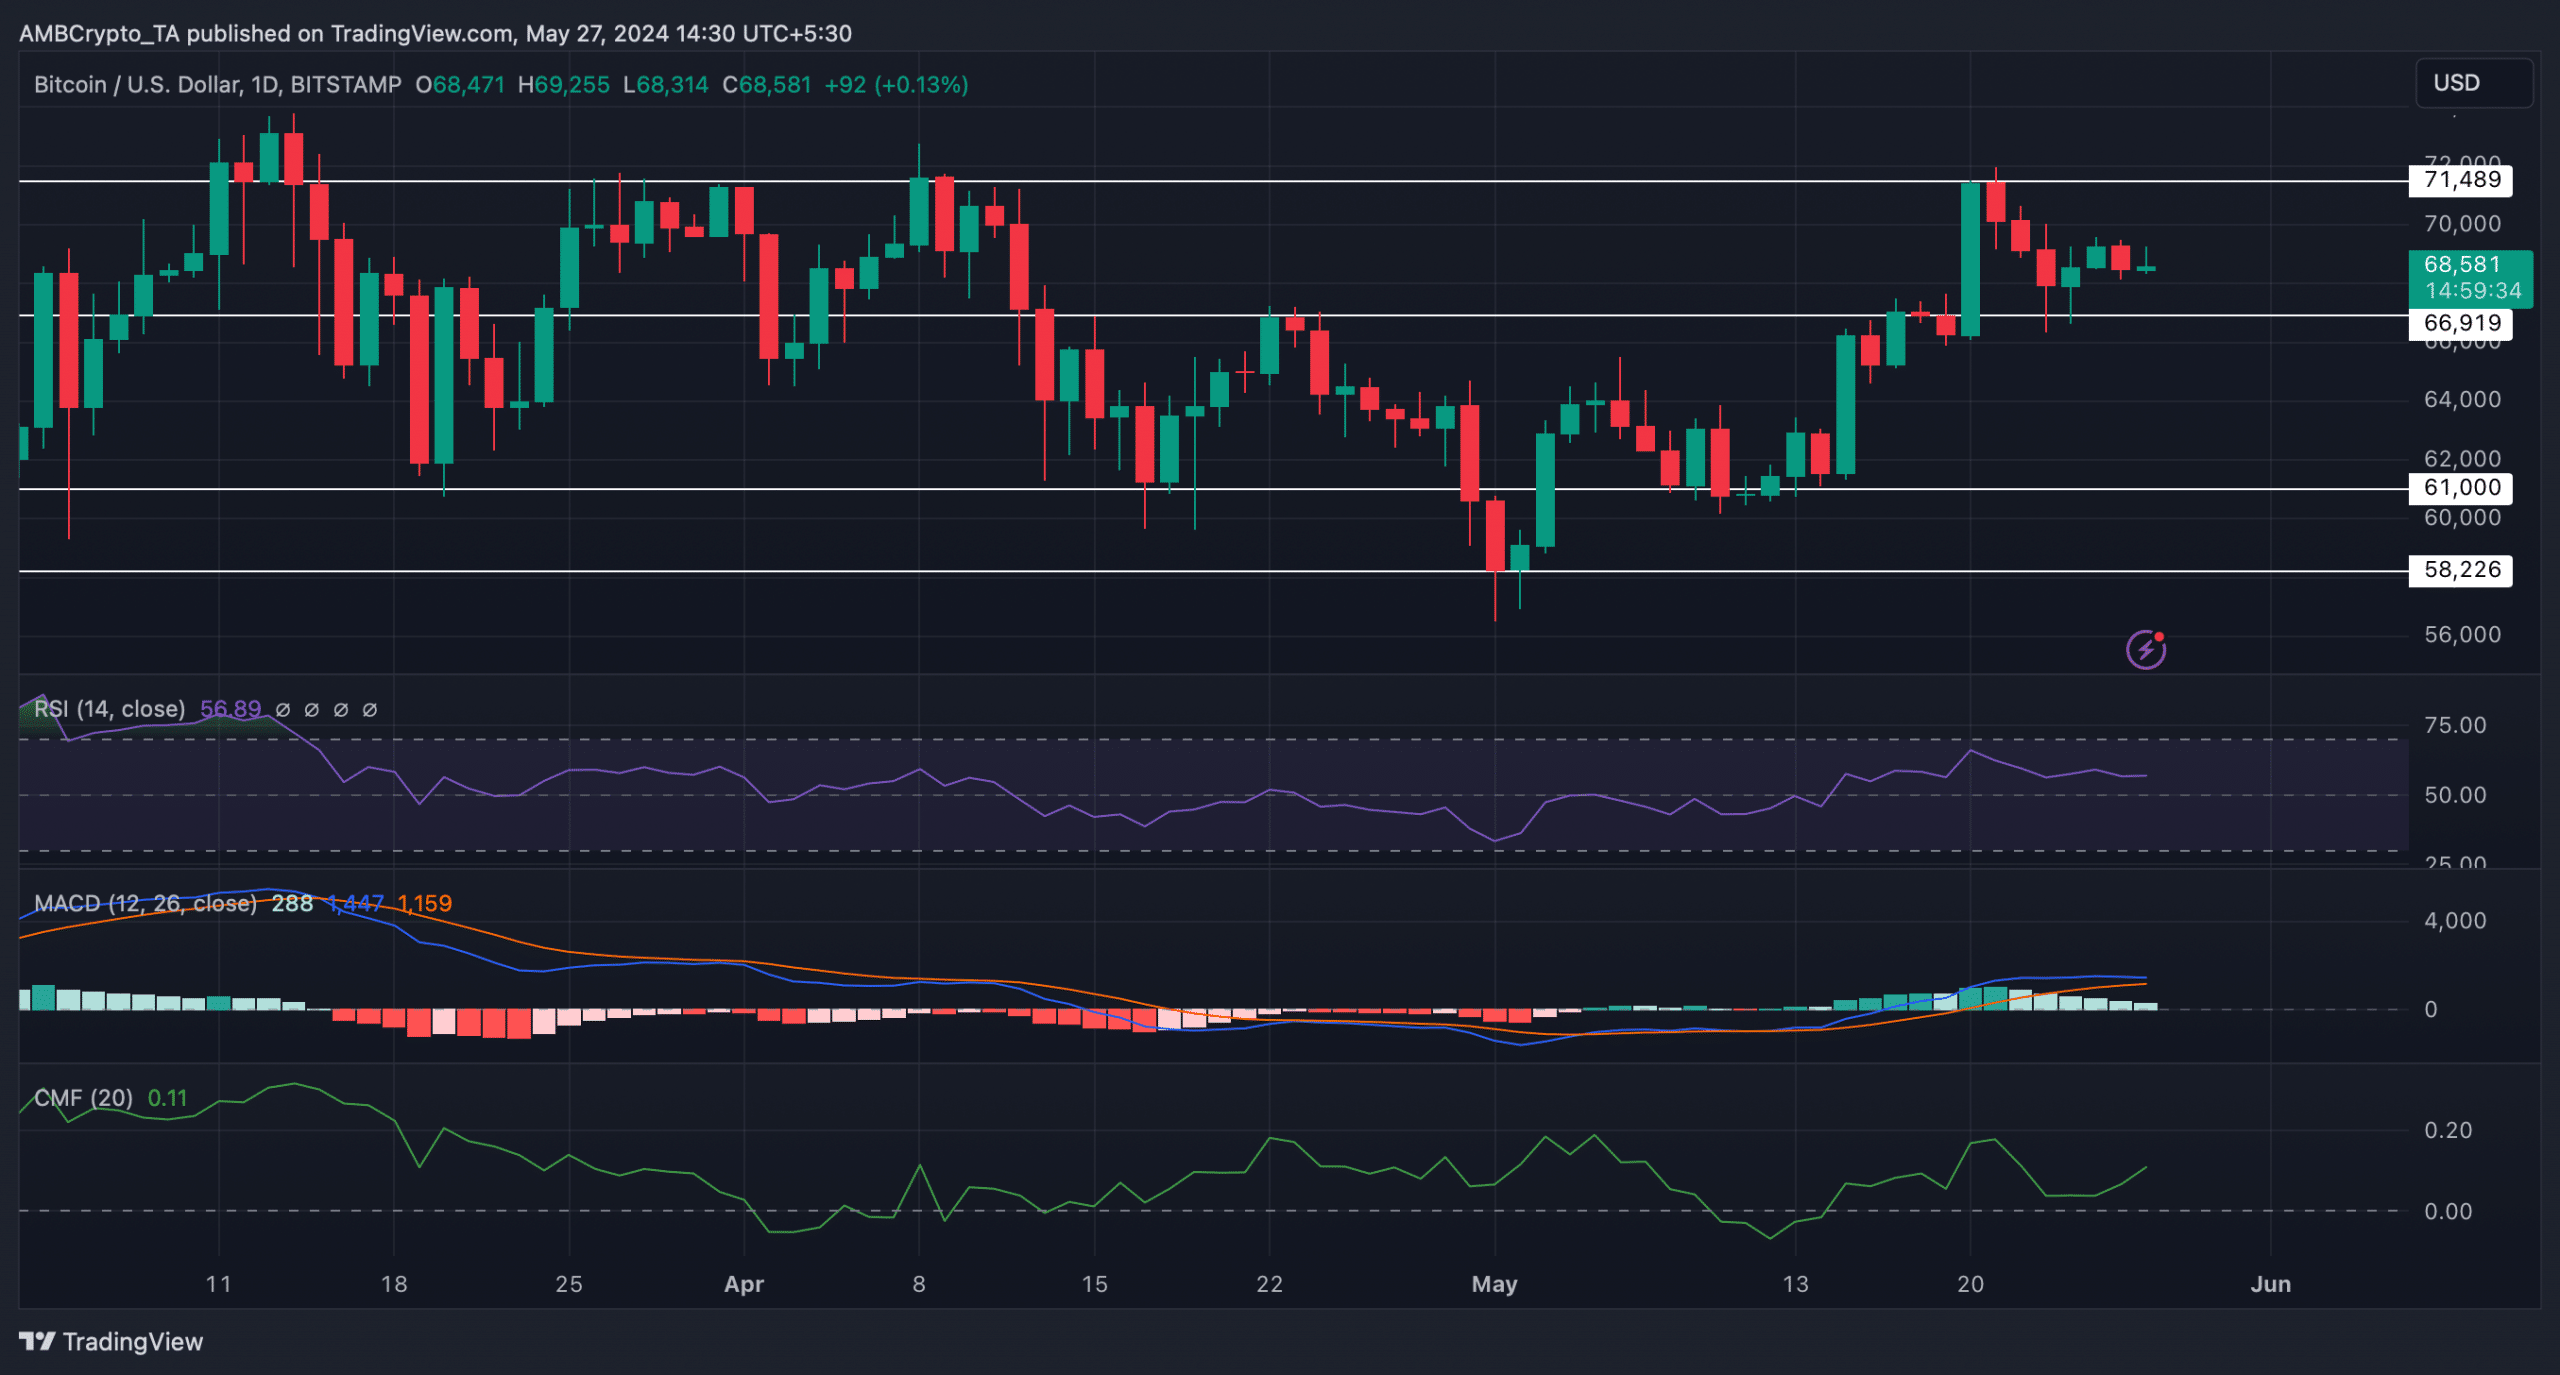
Source: TradingView