Bitcoin rallies from $17k after core CPI data release, should you go long now?

Disclaimer: The findings of the following analysis are the sole opinions of the writer and should not be considered investment advice
- The lower timeframe market structure was strongly bearish.
- The bulls can wait for a pullback before looking to bid.
The U.S. CPI data gave some relief to the bulls and indicated that inflation might be slowing down. The core CPI (excluding food and energy) rose by 0.1% compared to the previous month and below the 0.3% estimate. This indicated that the worst of the inflation could be over. Bitcoin and the stock markets rallied on the release of this data.
Read Bitcoin’s Price Prediction 2023-24
Crypto is an inherently risky sphere for investors, and the falling spending power of the past year saw widespread selling pressure in the market. While inflation remains high, its slowdown could begin to see BTC form a higher timeframe bottom.
Bitcoin was back near the month-long range and a breakout was likely
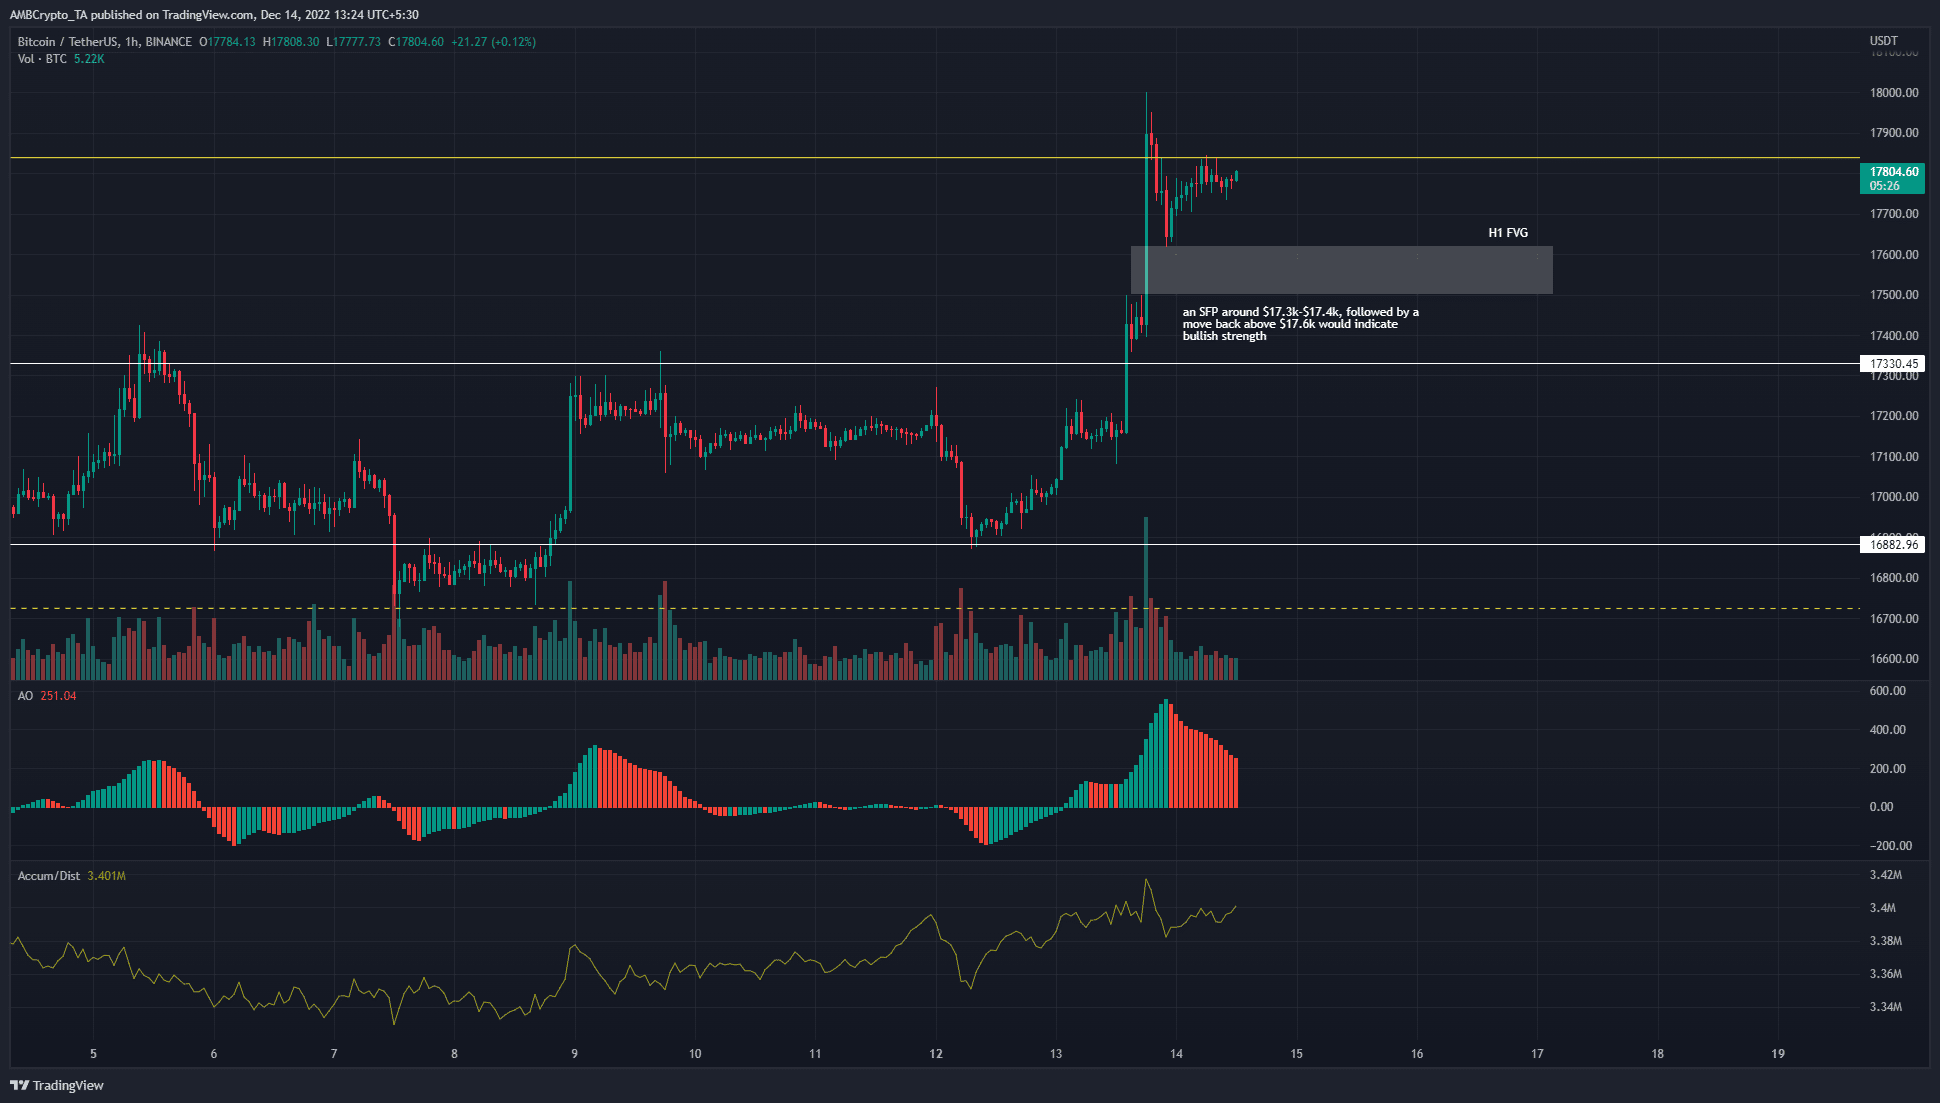
On the 1-hour chart, BTC posted good gains over the past two days. From Monday’s lows at $16.8k to Tuesday’s highs at $18k, BTC rallied by around 6.35%. At the time of writing, it traded near the $17.8k resistance mark.
Highlighted in yellow, the $17.8k level represented the highs of a range that BTC traded within since 10 November. The $17.3k mark served as a solid resistance in the past week. It was broken very recently. The surge higher left behind an inefficiency on the charts.
The FVG on the H1 chart will likely be revisited in the coming hours of trading. A swing failure pattern to the south, followed by a move back above $17.6k can act as a trigger for buyers looking to execute. Their stop-losses can be set beneath the lows of the SFP if it forms.
The Awesome Oscillator showed bullish momentum, while the A/D indicator steadily crept higher over the past week. This showed that buying pressure was in the market.
Open Interest surges alongside price to signal healthy demand
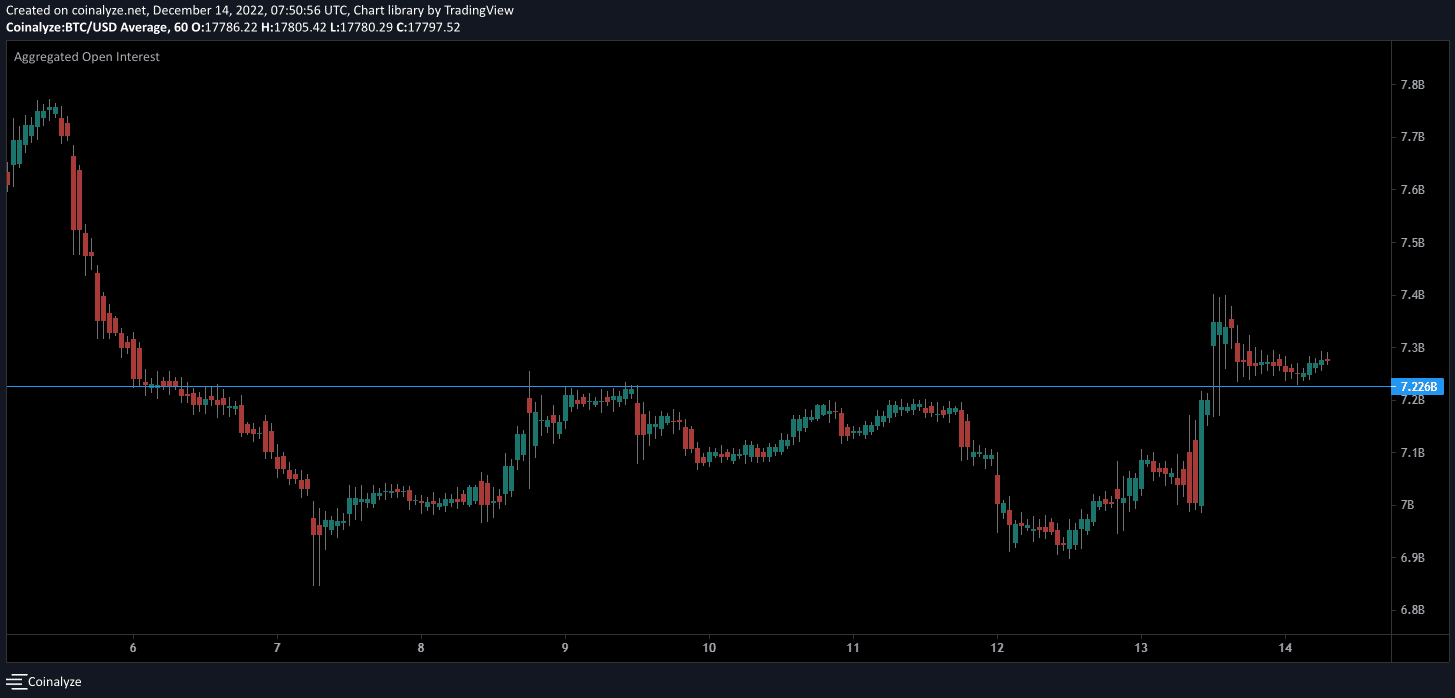
Since December 6, the OI slumped beneath $7.226b and only the rally of the past two days was able to beat this mark. Previous attempts in the past week saw BTC rejected at the $17.3k mark.
The rising OI meant futures market participants were increasingly willing to enter the market. The funding rate was also positive which indicated bulls regained some strength.
To the north, $18.6k will act as a stiff resistance zone. The news of FTX collapse drove BTC to $15.6k, but couldn’t take it any further. With news of slowing inflation, it was possible that crypto had turned a corner. The higher timeframe downtrend can shift into an accumulation phase, and investors might begin to assess long-term buying opportunities.