Bitcoin
Bitcoin rally at risk? What BTC holders need to know!
Bitcoin faced multiple rejections in the recent past, and the same trend might continue further.


- Bitcoin showed signs of recovery as its weekly and daily charts were green.
- Market indicators and metrics hinted at a price correction.
Bitcoin [BTC] has faced back-to-back price corrections over the past few weeks, which has caused trouble for its rally. The last week was somewhat in investors’ favor as the king coin witnessed price hikes.
However, a new report has suggested that BTC might once again fall victim to a correction.
Bitcoin rally is facing trouble
The Bitcoin rally has been facing trouble of late as it’s been struggling to move above $66k. However, the last 24 hours showed better signs. As per
CoinMarketCap, the coin’s price increased by more than 1.5%. At press time, Bitcoin was trading at $63,896.05.The latest price hike has pushed 48.9 million BTC addresses in profit, which accounted for 91% of the total number of BTC addresses. But BTC’s troubles are not over yet, as there were chances of the Bitcoin rally ending.
Ali, a popular crypto analyst, posted a tweet revealing an interesting development. As per the tweet, BTC’s price was moving inside a channel.
The bad news was that the coin had already faced rejection three times when it approached the resistance of the pattern. Therefore, it indicated that this recently gained bullish momentum might not last. So, AMBCrypto planned to dig deeper.
What’s next for BTC?
As per our analysis of Glassnode’s data, a metric suggested a halt to the Bitcoin rally. We found that the king coin’s NVT ratio increased. Whenever the metric rises, it indicates that an asset is overvalued, hinting at a price correction.
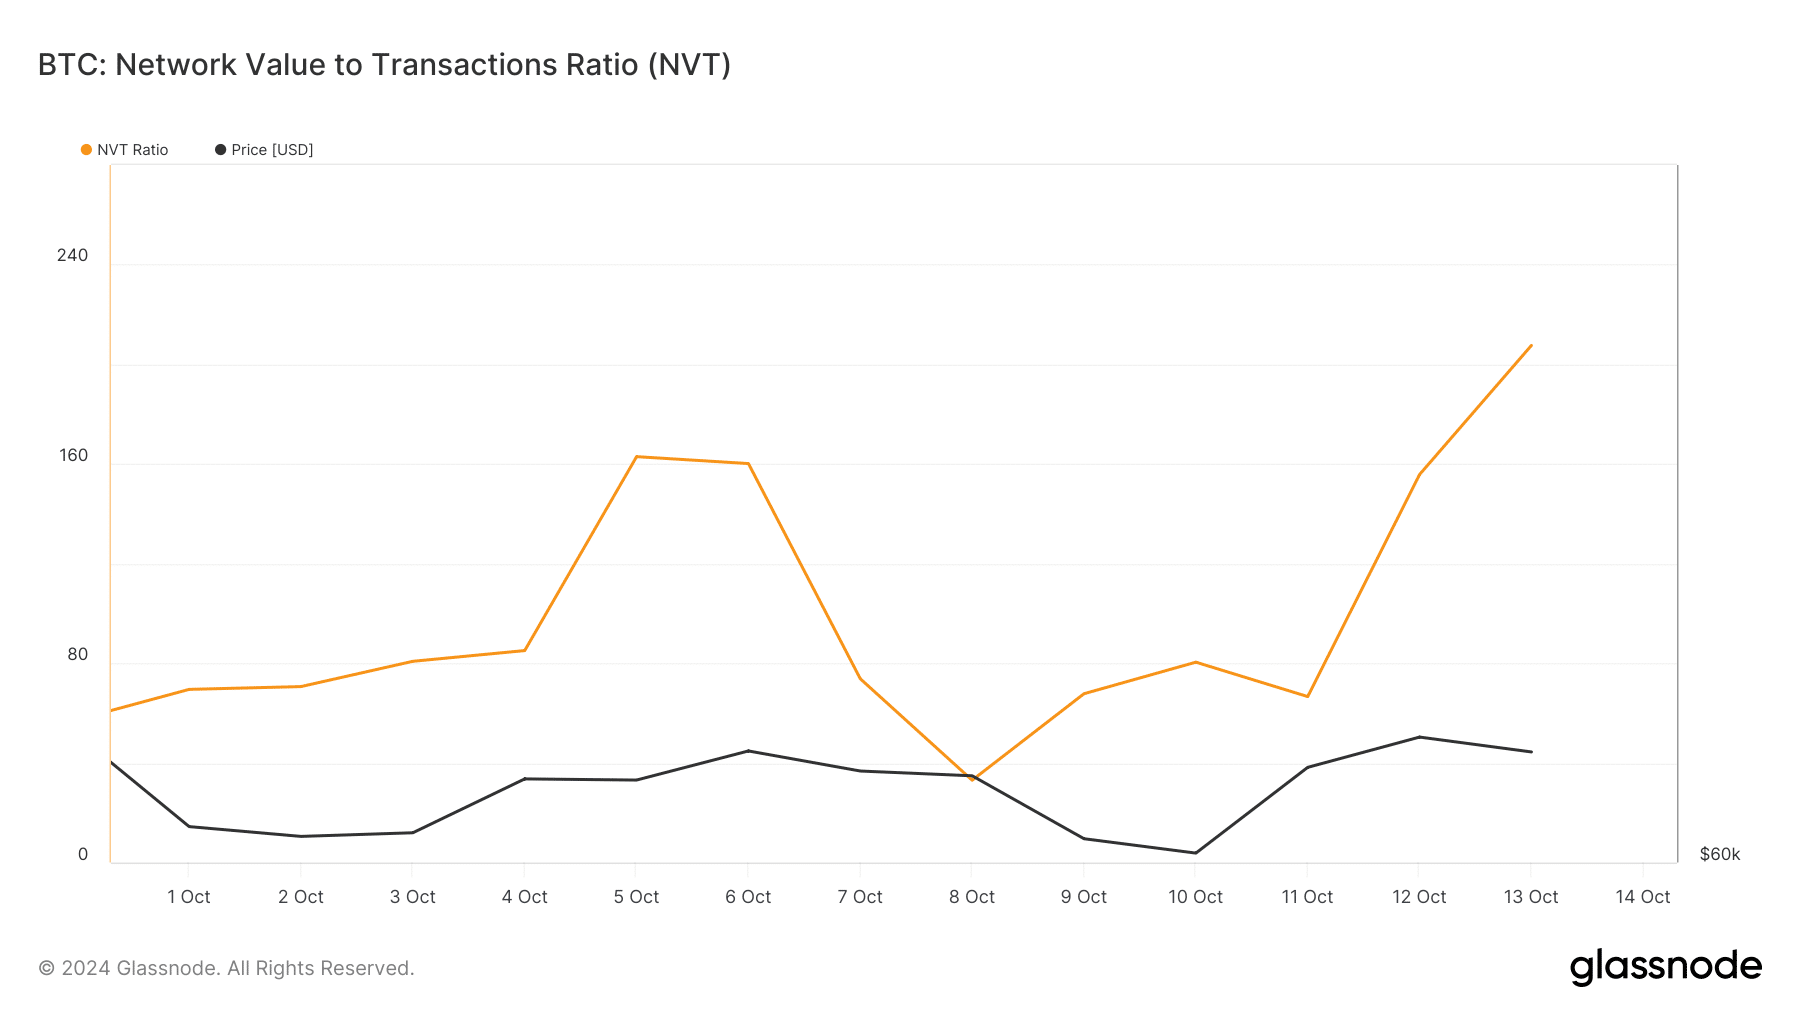
Source: Glassnode
We also found that the coin’s long/short ratio dropped. This meant that there were more short positions in the market than long positions. A rise in the number of short positions can be interpreted as a bearish signal.
However, not everything was in the bears’ favor. For example, BTC’s exchange reserve was dropping, according to CryptoQuant. A decline in this metric means that buying pressure was rising, which often results in price hikes.
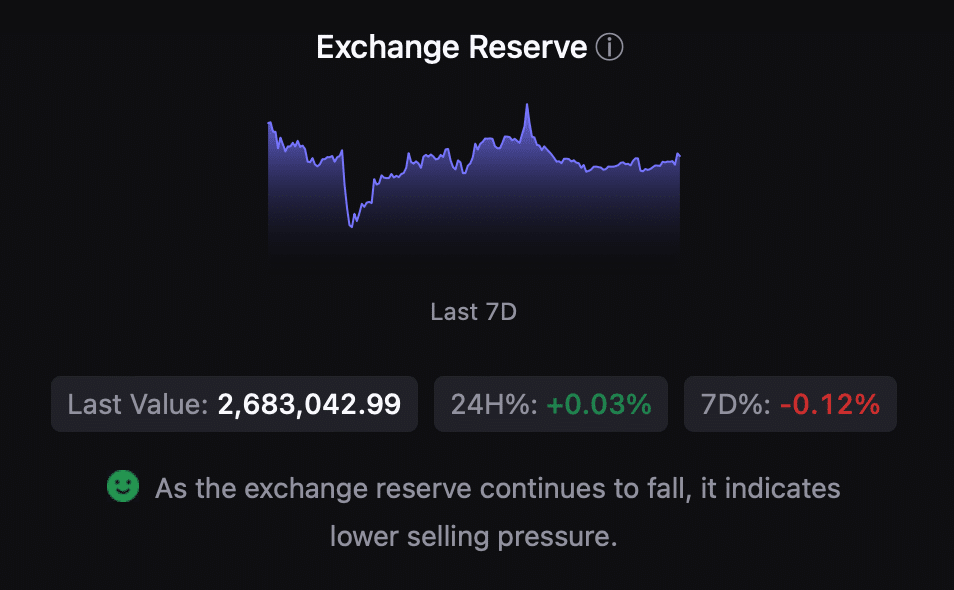
Source: CryptoQuant
To better understand what to expect from the bitcoin rally, AMBCrypto checked the coin’s daily chart. The technical indicators looked pretty bearish. BTC’s MACD displayed a bearish advantage in the market.
Read Bitcoin’s [BTC] Price Prediction 2024-25
Additionally, the coin’s Chaikin Money Flow (CMF) also registered a downtick, hinting at a price drop. If that happens, then the Bitcoin rally might end and the coin could drop to $60k again.
Nonetheless, in case of a continued price rise, BTC might test its resistance at $65.4k again.
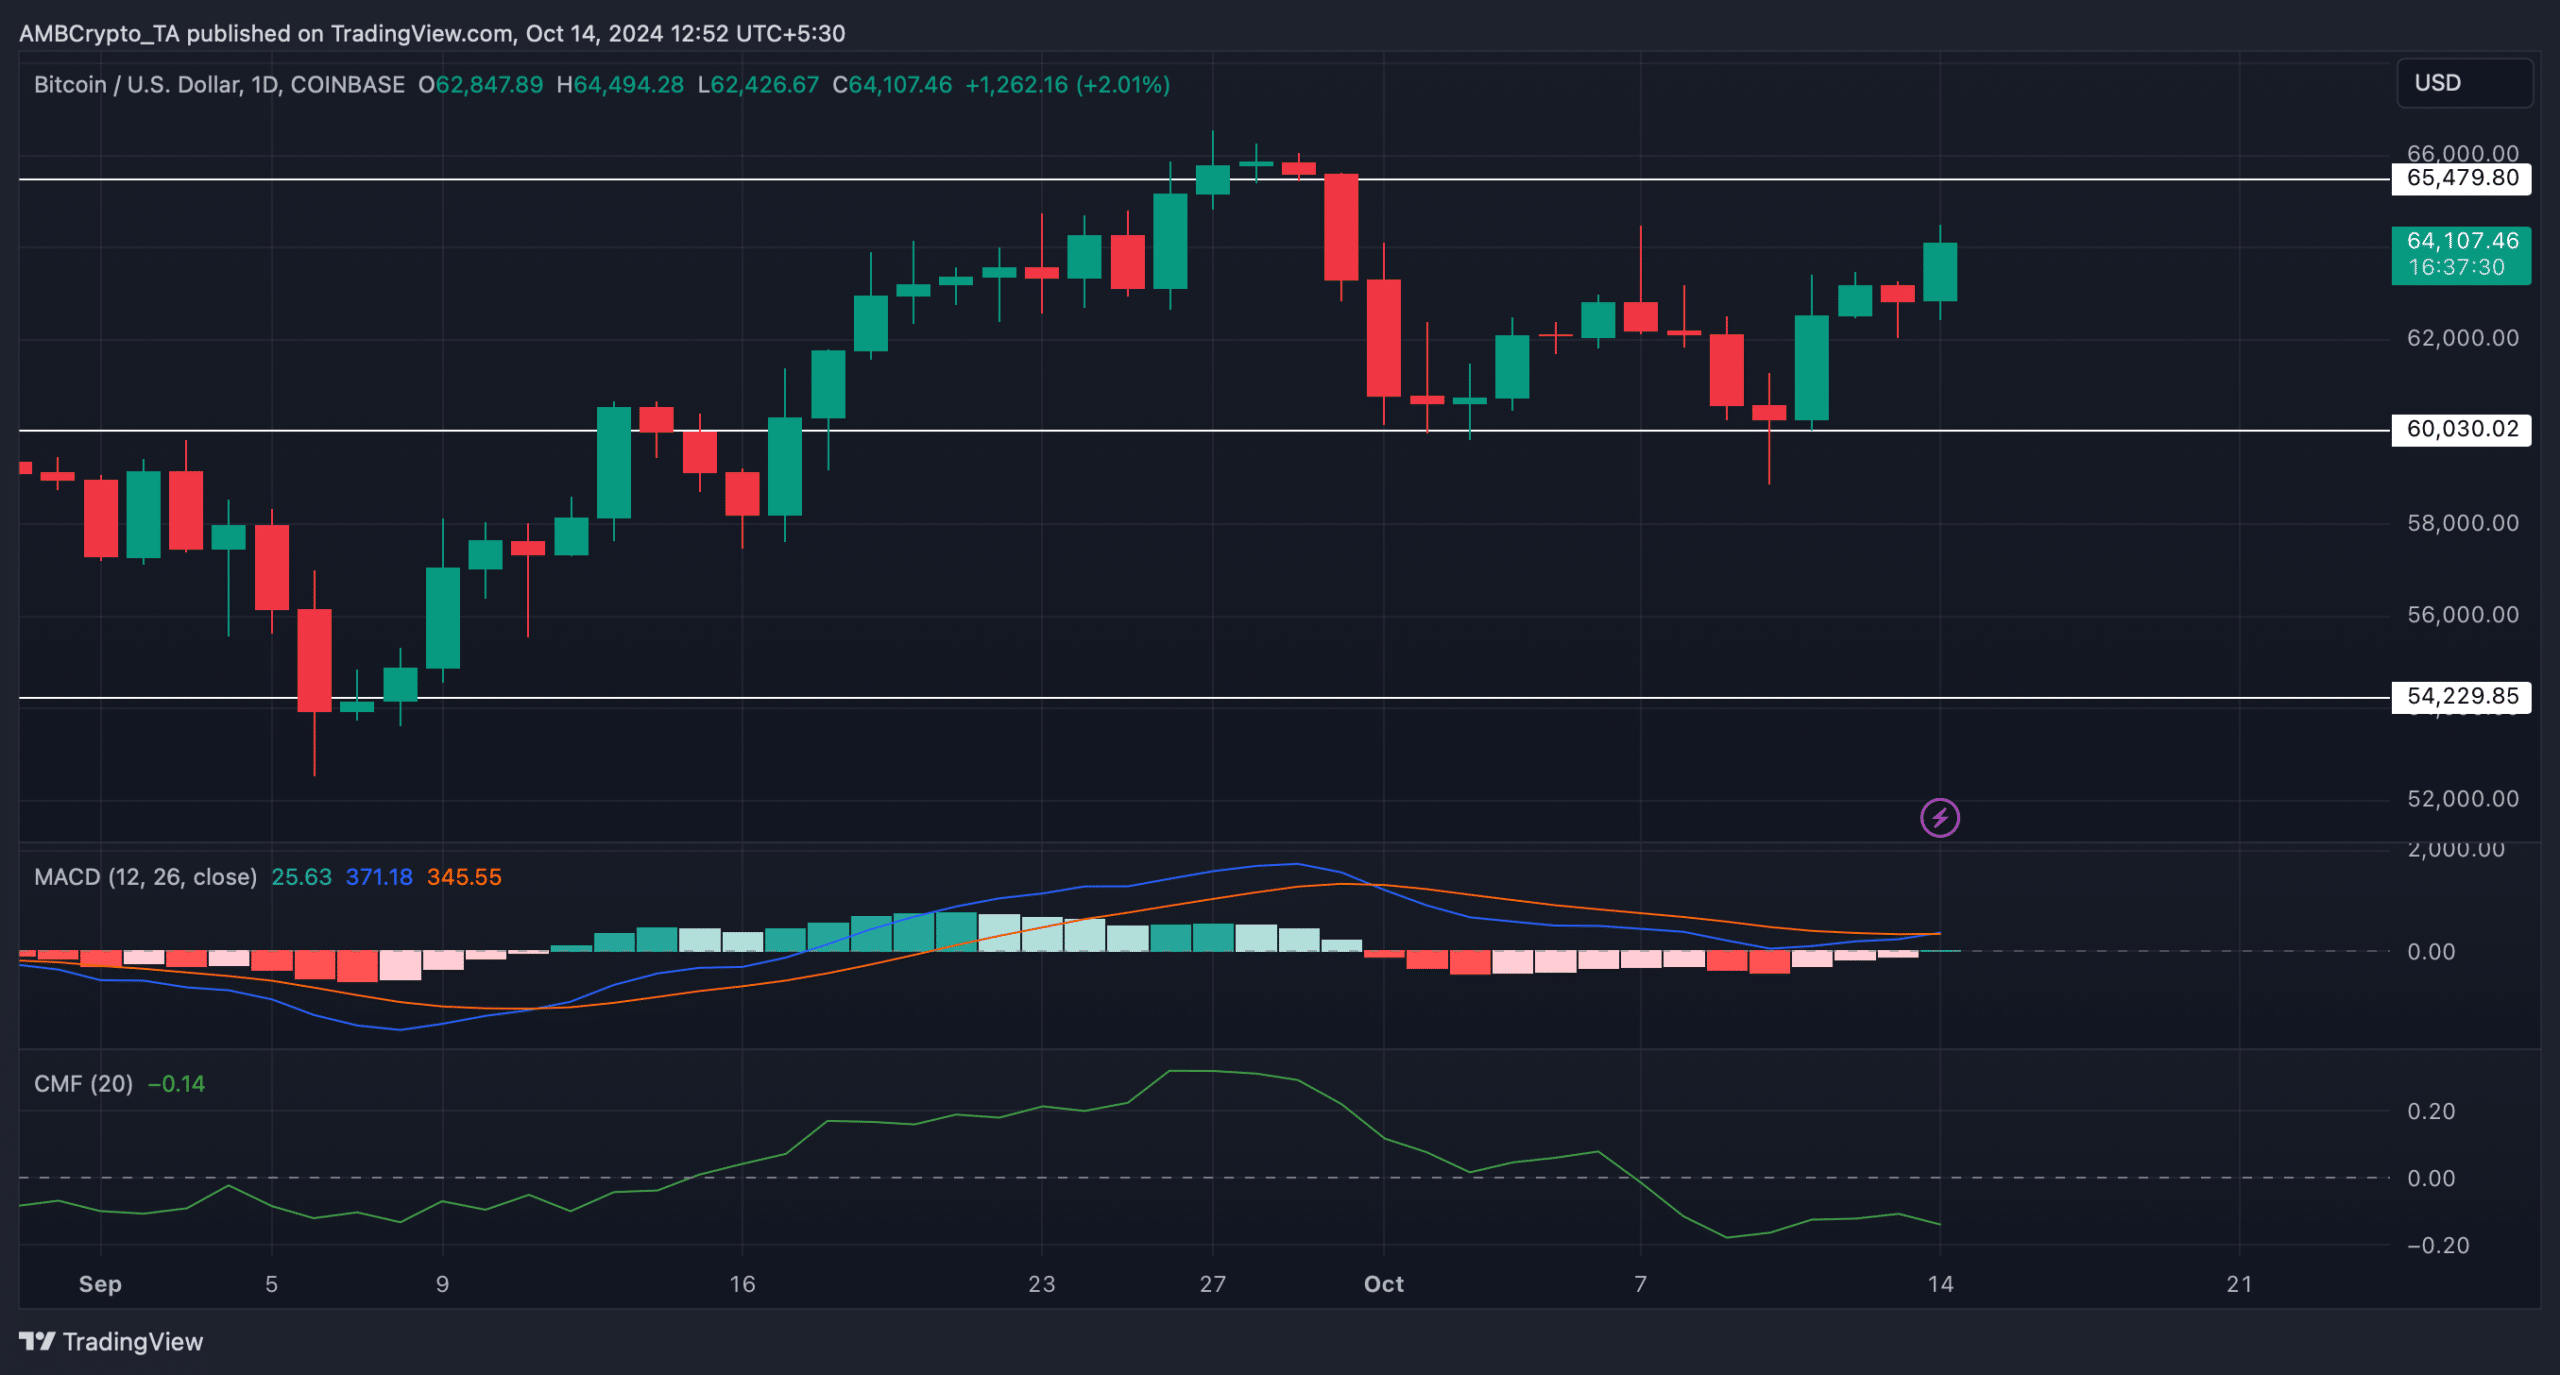
Source: TradingView