Analysis
Bitcoin rockets past local resistances, but is this the start of a bull run?
The exchange flow balance saw more BTC leave exchanges over the past week, and this and other findings from Santiment painted a bullish picture for Bitcoin

Disclaimer: The information presented does not constitute financial, investment, trading, or other types of advice and is solely the writer’s opinion.
- Bitcoin noted large gains over the past 48 hours as short-sellers faced massive liquidations
- With their liquidity dried up, it could be hard for BTC to push higher within the next few days
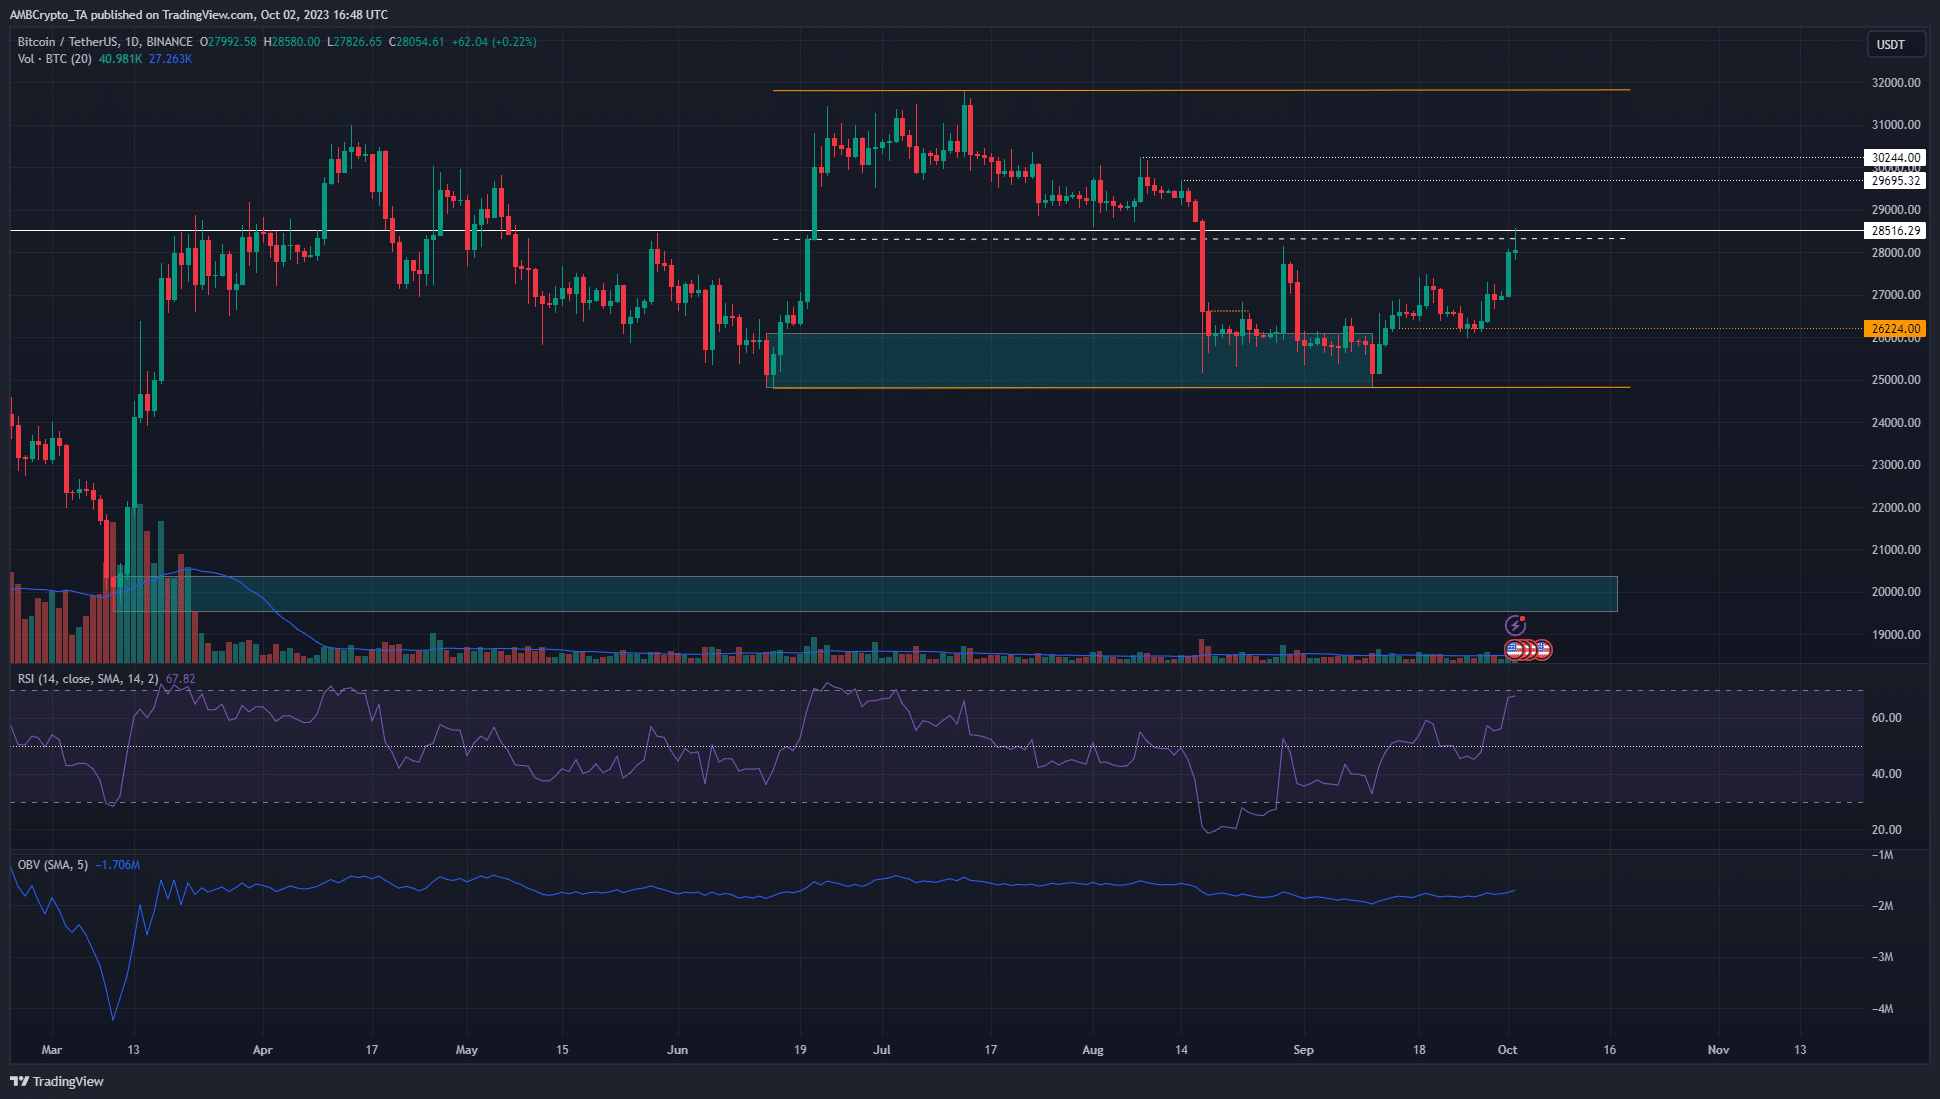
Bitcoin [BTC] pumped close to 6% over the past two days. The Open Interest (OI) surged higher alongside prices and showed bullish conviction in the near term. The higher timeframe charts showed that BTC was at a local resistance but had room for expansion northward.
Read Bitcoin’s [BTC] Price Prediction 2023-24
The local resistance was at the $28.3k-$28.5k territory. Bitcoin was trading within a range from $24.8k to $31.8k, and the mid-range resistance was $28.4k. It sat close to the $28.5k level, a long-term resistance. Could the bulls push past it soon?
The price is attracted to liquidity, and Bitcoin bears have already been forced to withdraw
Liquidation data from Coinglass showed that the past 24 hours saw $60 million worth of contracts liquidated, with $44 million being short. This was evidence that a good chunk of the short sellers had been wiped out.
Therefore, even though BTC has a bullish market structure on the daily chart, it could be hard for the bulls to drive prices higher. Instead, it makes more sense for the market to drop and hunt the enthusiastic, and possibly late, bulls.
An ideal area for this would be a revisit of the $26.9k-$27.4k region. This zone served as resistance since 18 September and was broken on 1 October. There was likely a large amount of liquidity around the $27k mark, with a deeper retracement to $26.5k also possible.
The mean coin age saw a remarkable uptick over the past month
Data from the intelligence platform showed BTC was in an accumulation phase since early August. The rise in mean coin age even as the prices dithered around the $26k level was evidence of accumulation across the network. Intense sell pressure has not set in yet, as the dormant circulation has not shown notable peaks recently. The exchange flow balance saw more BTC leave exchanges over the past week, and these findings painted a bullish picture for BTC.
How much are 1, 10, or 100 BTC worth today?
Crypto analyst CrypNuevo posted a seven-day Hyblock liquidation chart that showed close to $200 million worth of short liquidations could be achieved if BTC rose to $28.8k.
Hence, we might see another swift spike to hunt this liquidity. Thereafter, a reversal toward $27.5k or lower could commence, where the next batch of huge liquidations from long positions could be triggered.


