Bitcoin short sellers are going to go gaga after reading this

The king of cryptocurrency, Bitcoin [BTC], suffered a massive plunge in its price in June when the crypto market crashed, marking 2022 lowest of $18,154.
However, soon after, the coin gained a steady uptrend for the next two months. BTC also managed to cross the $24,000 mark, giving hope for a massive bull run soon.
But with recent developments, the situation may witness a change.
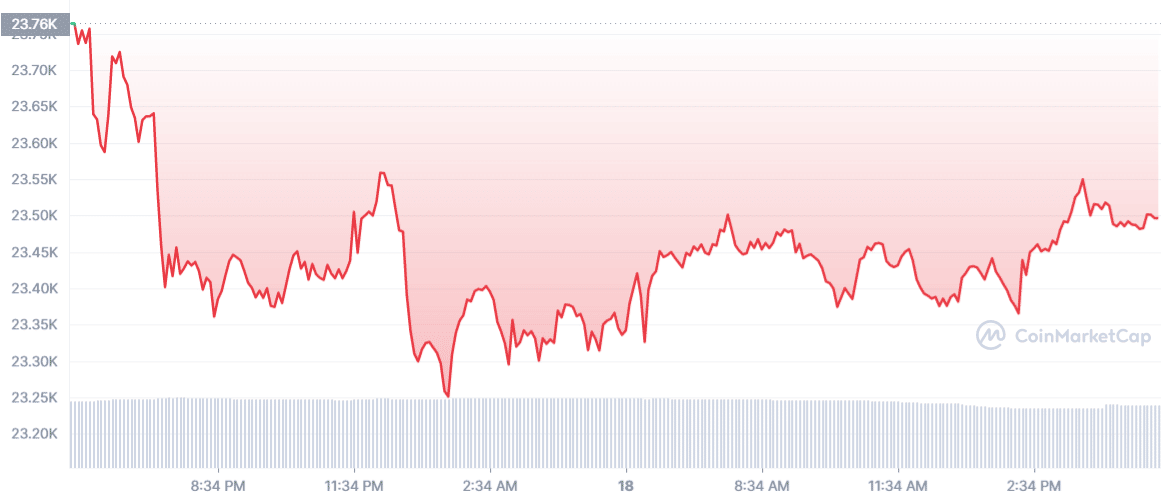
At the time of writing, BTC was trading below the $24,000 mark, at $23,491, with a market capitalization of $449,275,521,406.
What’s going on?
A Chicago-based investor CryptoWhale with 533.8k followers on Twitter, recently tweeted that it expects a Bitcoin market crash.
According to the Twitter handle, a bearish divergence formed on BTC’s charts, indicating a plunge in its price was around the corner.
While many had different opinions, most Twitter users seemed to agree with CryptoWhale.
https://twitter.com/CryptoWhale/status/1559951966465392640
But, interestingly, a few metrics highlighted just the opposite of CryptoWhale’s prediction.
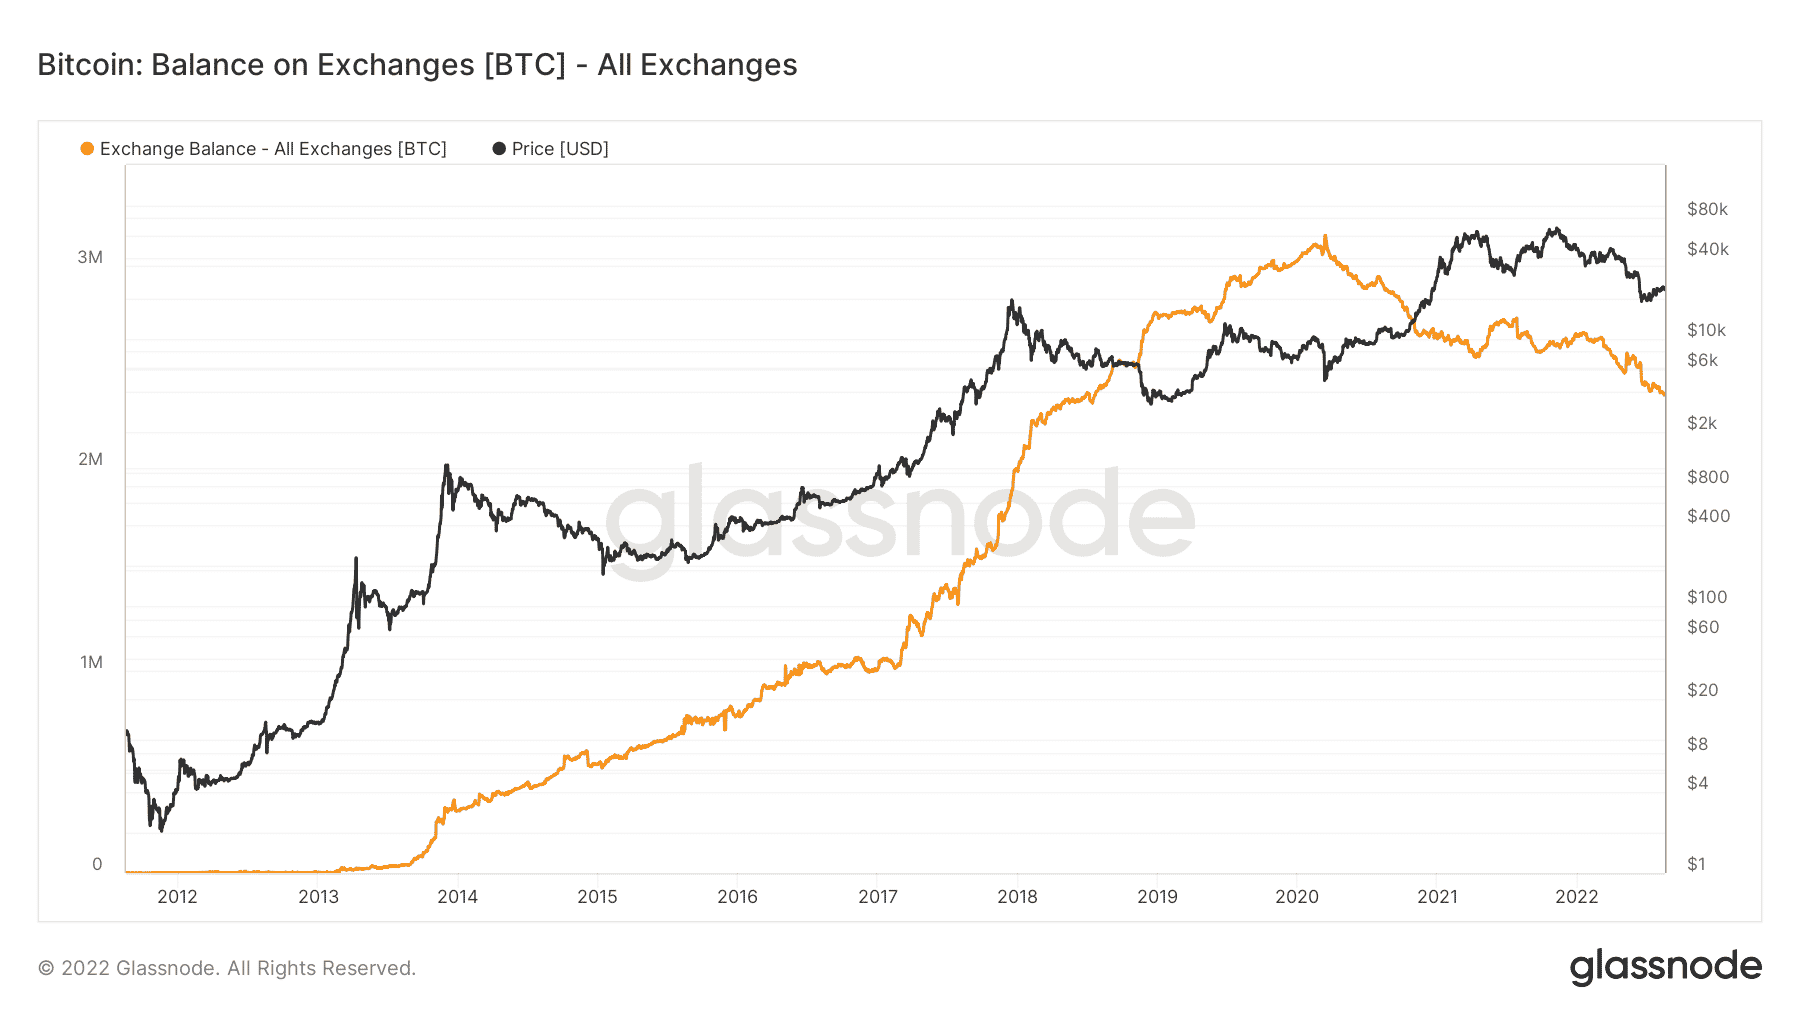
Glassnode’s data showed that Bitcoin’s balance on exchanges reached a four-year low, indicating investors’ conviction to HODL.
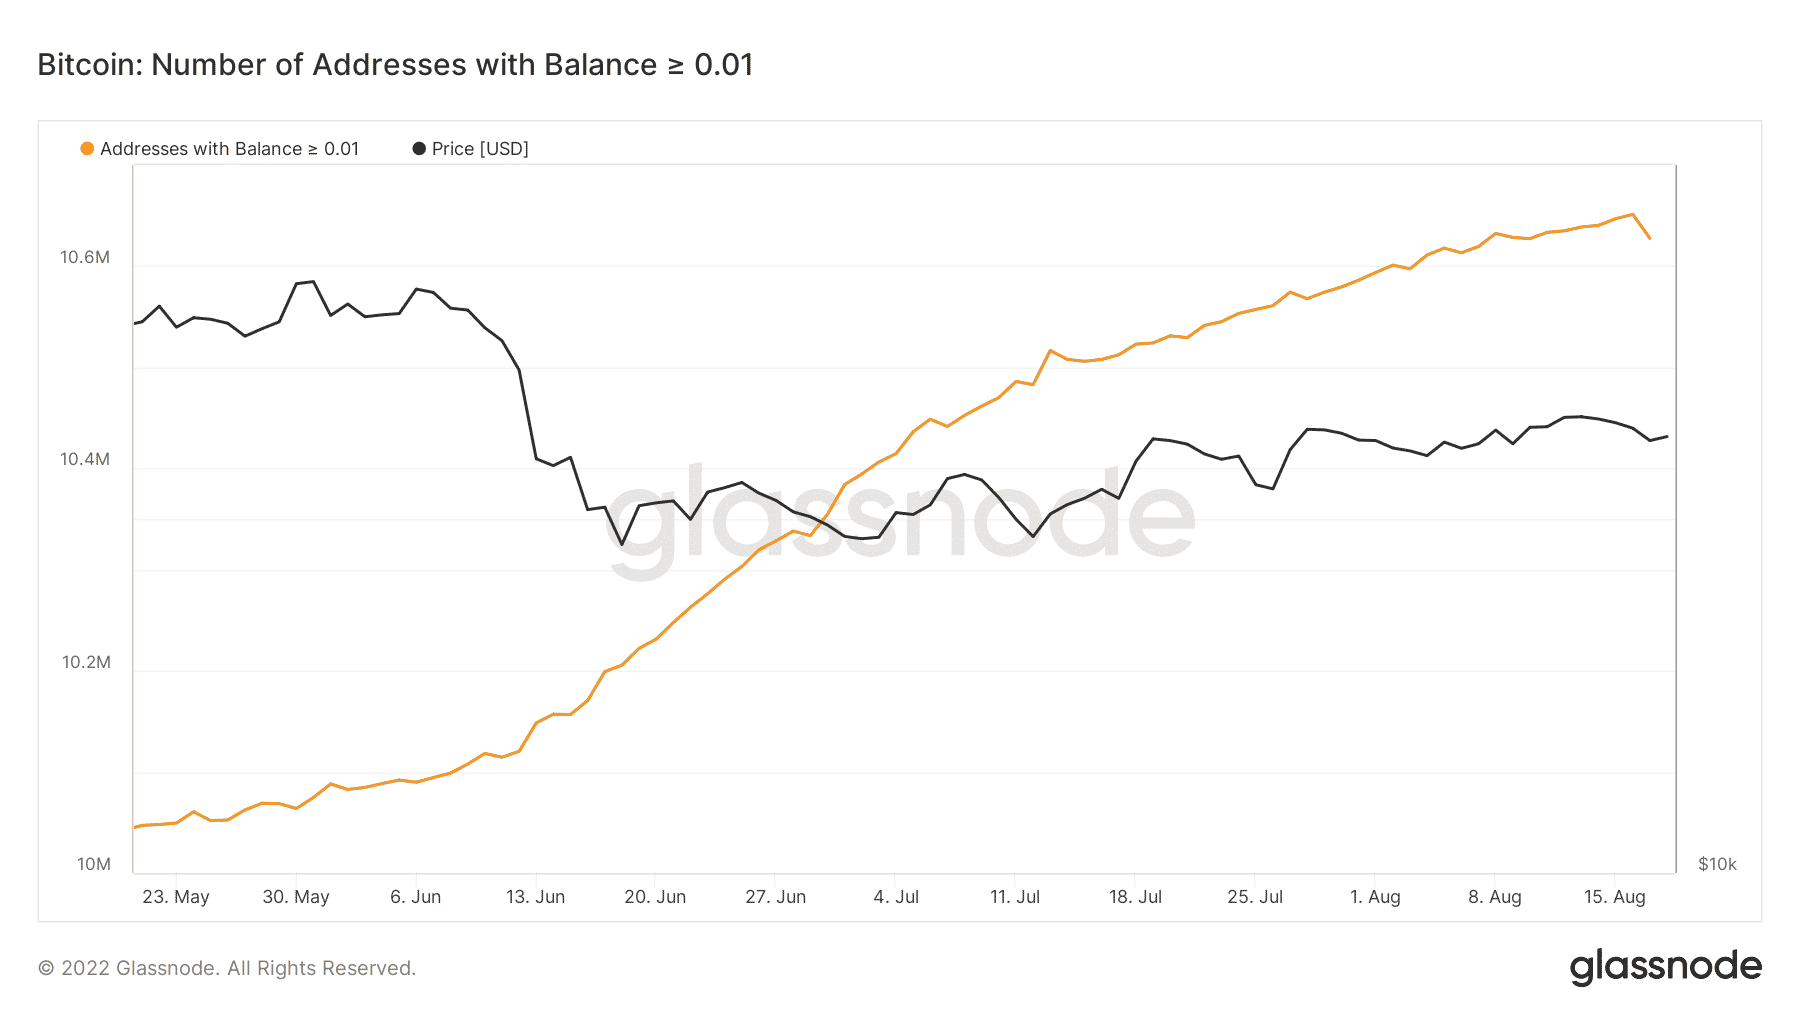
However, Bitcoin’s number of addresses with a balance ≥ 0.01, which was on a constant uptrend, showed a decline lately.
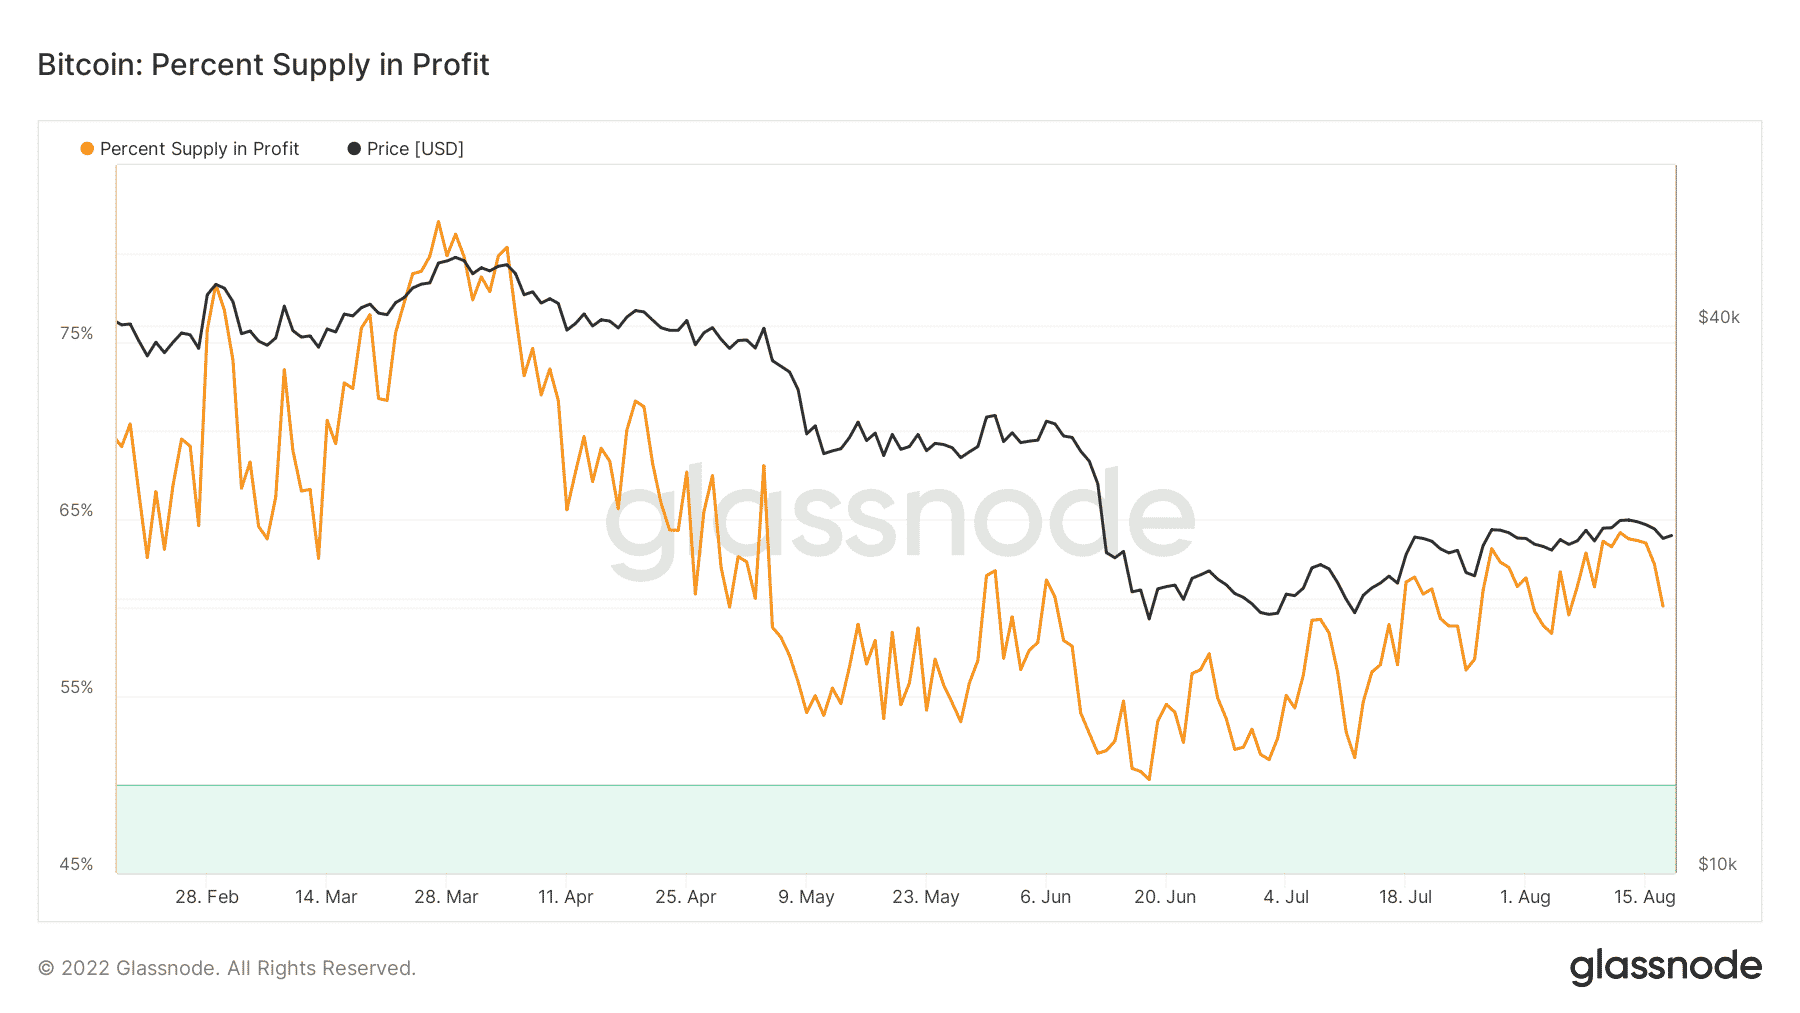
To add to the aforementioned data, last week, the percentage supply of Bitcoin profit also started to increase, giving hope to investors.
BTC’s percent supply in profit reached a three-month high of 62.03% on 12 August.
Well, a look at BTC’s chart showed that after being on a gradual uptrend, the coin was following the sell-pressure post 15 August as it was unable to break its resistance at the $24,000 mark.
Multiple indicators, including the Relative Strength Index (RSI), Chaikin Money Flow (CMF), and Exponential Moving Average (EMA) ribbons, suggested bearish market conditions, further increasing the possibility of a downtrend in the coming week.
While Bitcoin’s price increased during the last week, a bearish divergence was seen on CMF (blue trend line).

Moreover, a bearish wedge pattern formed on BTC’s chart, indicating a downfall. Therefore, considering the chart and on-chain metrics traders need to be careful before making any moves.