Bitcoin: Should you be bullish after the losses of the past two weeks?

Disclaimer: The information presented does not constitute financial, investment, trading, or other types of advice and is solely the writer’s opinion.
- The structure was bullish on the daily timeframe.
- Losses of 12% in under two weeks highlighted bearish strength.
Analysts who compared the on-chain metrics of Bitcoin in 2023 to that in the 2018-2019 cycle found that Bitcoin could have formed its long-term bottom back in January. Investors with high time horizons could be rewarded later this year.
Read Bitcoin’s [BTC] Price Prediction 2023-24
Analysis of the price action showed that, although there was significant sell pressure recently, bulls still have strength in the market. The confluence of support in the $21.6k-$22k area underlined the possibility of a bounce in prices across the market.
The bullish breaker from September was retested
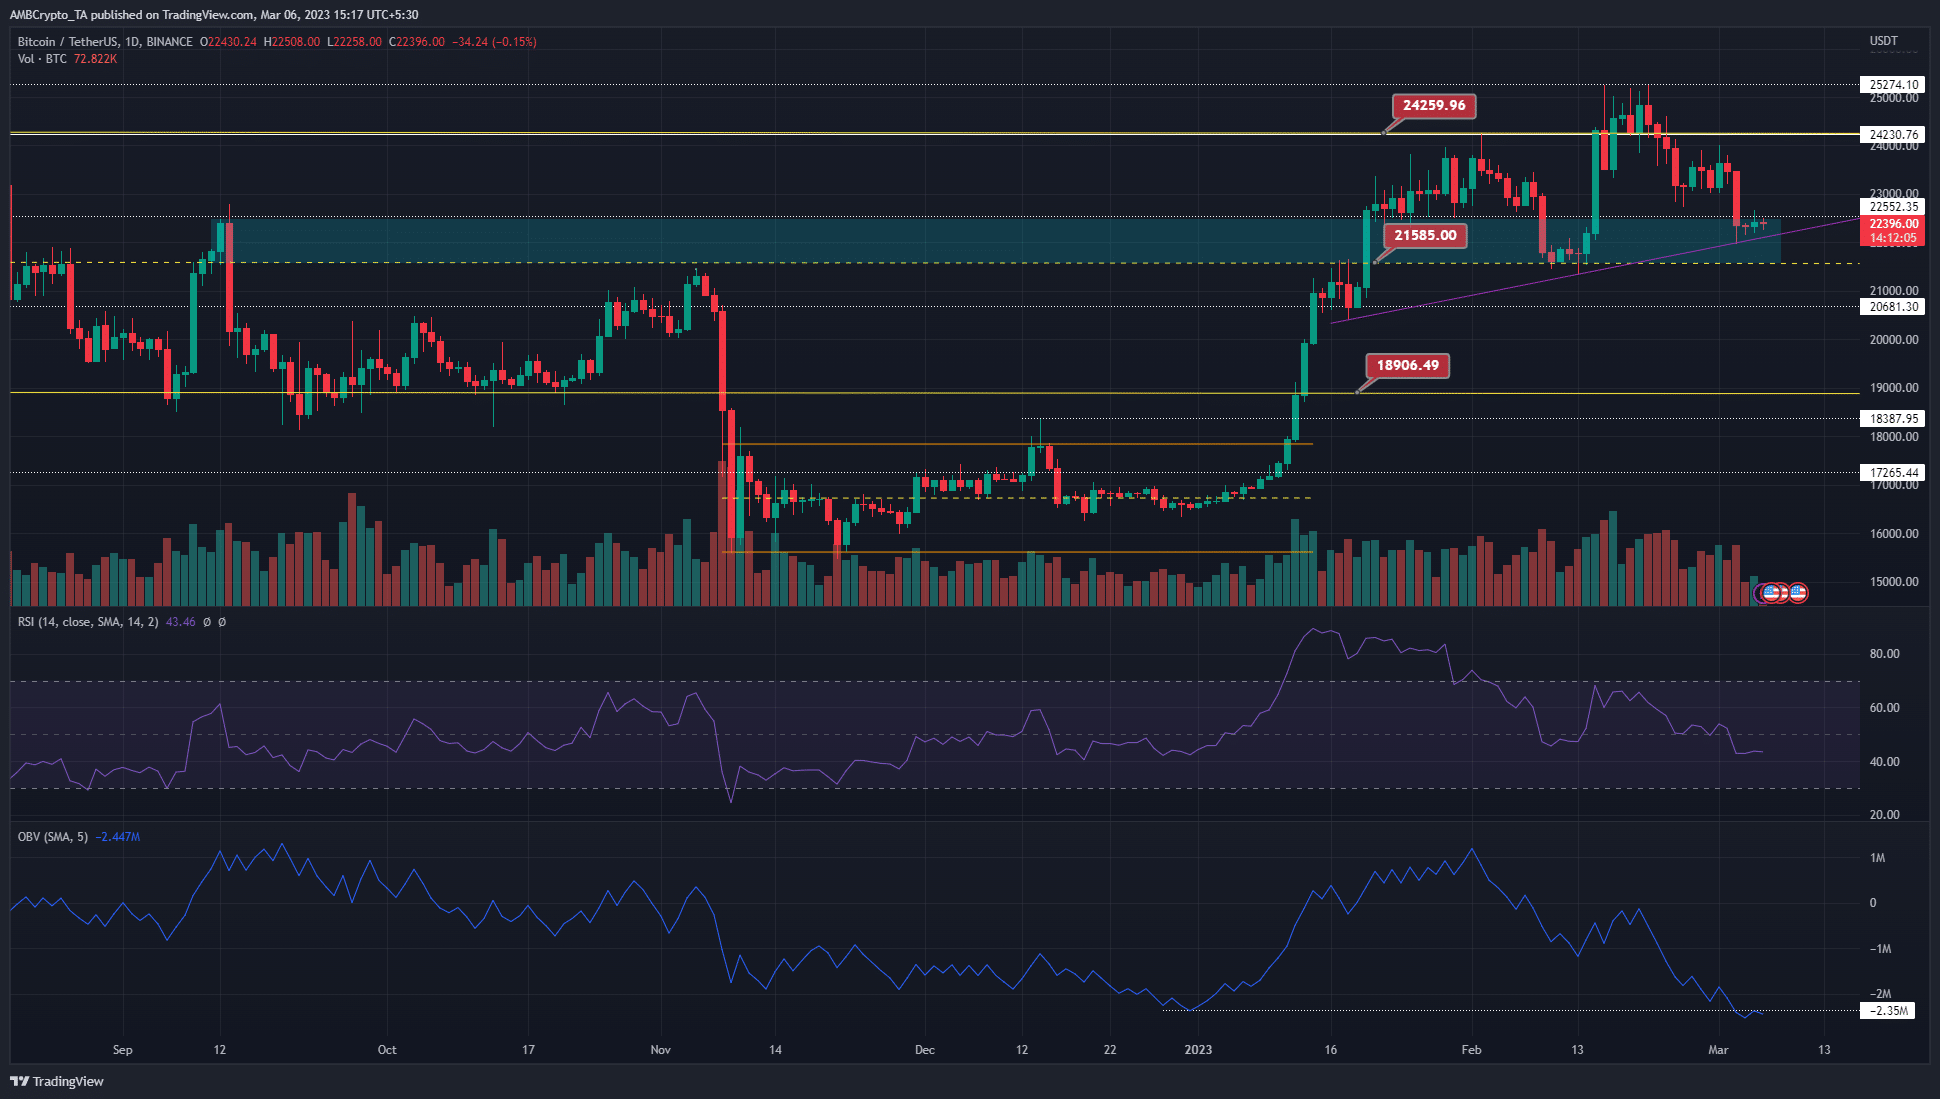
From June to November, Bitcoin traded within a range that extended from $18.9k to $24.2k. The mid-point of this range lay at $21.6k and was previously tested as support in mid-February. The price has sunk to this region once again after a rejection at $25.2k.
Even though the king of crypto was able to breach the range highs, the bulls were unable to defend their gains. This showed strong profit-taking tendencies across the market, and also highlighted the importance of $24.8k-$25.2k as resistance.
The structure on the daily chart showed a series of higher lows, marked by the purple trendline support. While lower timeframe momentum was strongly bearish (lower lows since 23 February) the retest of the bullish breaker from September could be crucial.
Is your portfolio green? Check the Bitcoin Profit Calculator
Invalidation of the bullish idea would be a descent back below the $21.6k mark. A daily session close would break the structure and flip the bias to bearish.
The OBV sank to a new low in 2023, even though the prices are much higher. This supported the idea that selling pressure was dominant and the rally was near an end. The RSI showed weak bullish momentum in late February and recently fell below the neutral 50 mark to hand the reins to the bears.
There were signs of accumulation but holders continued to take profits
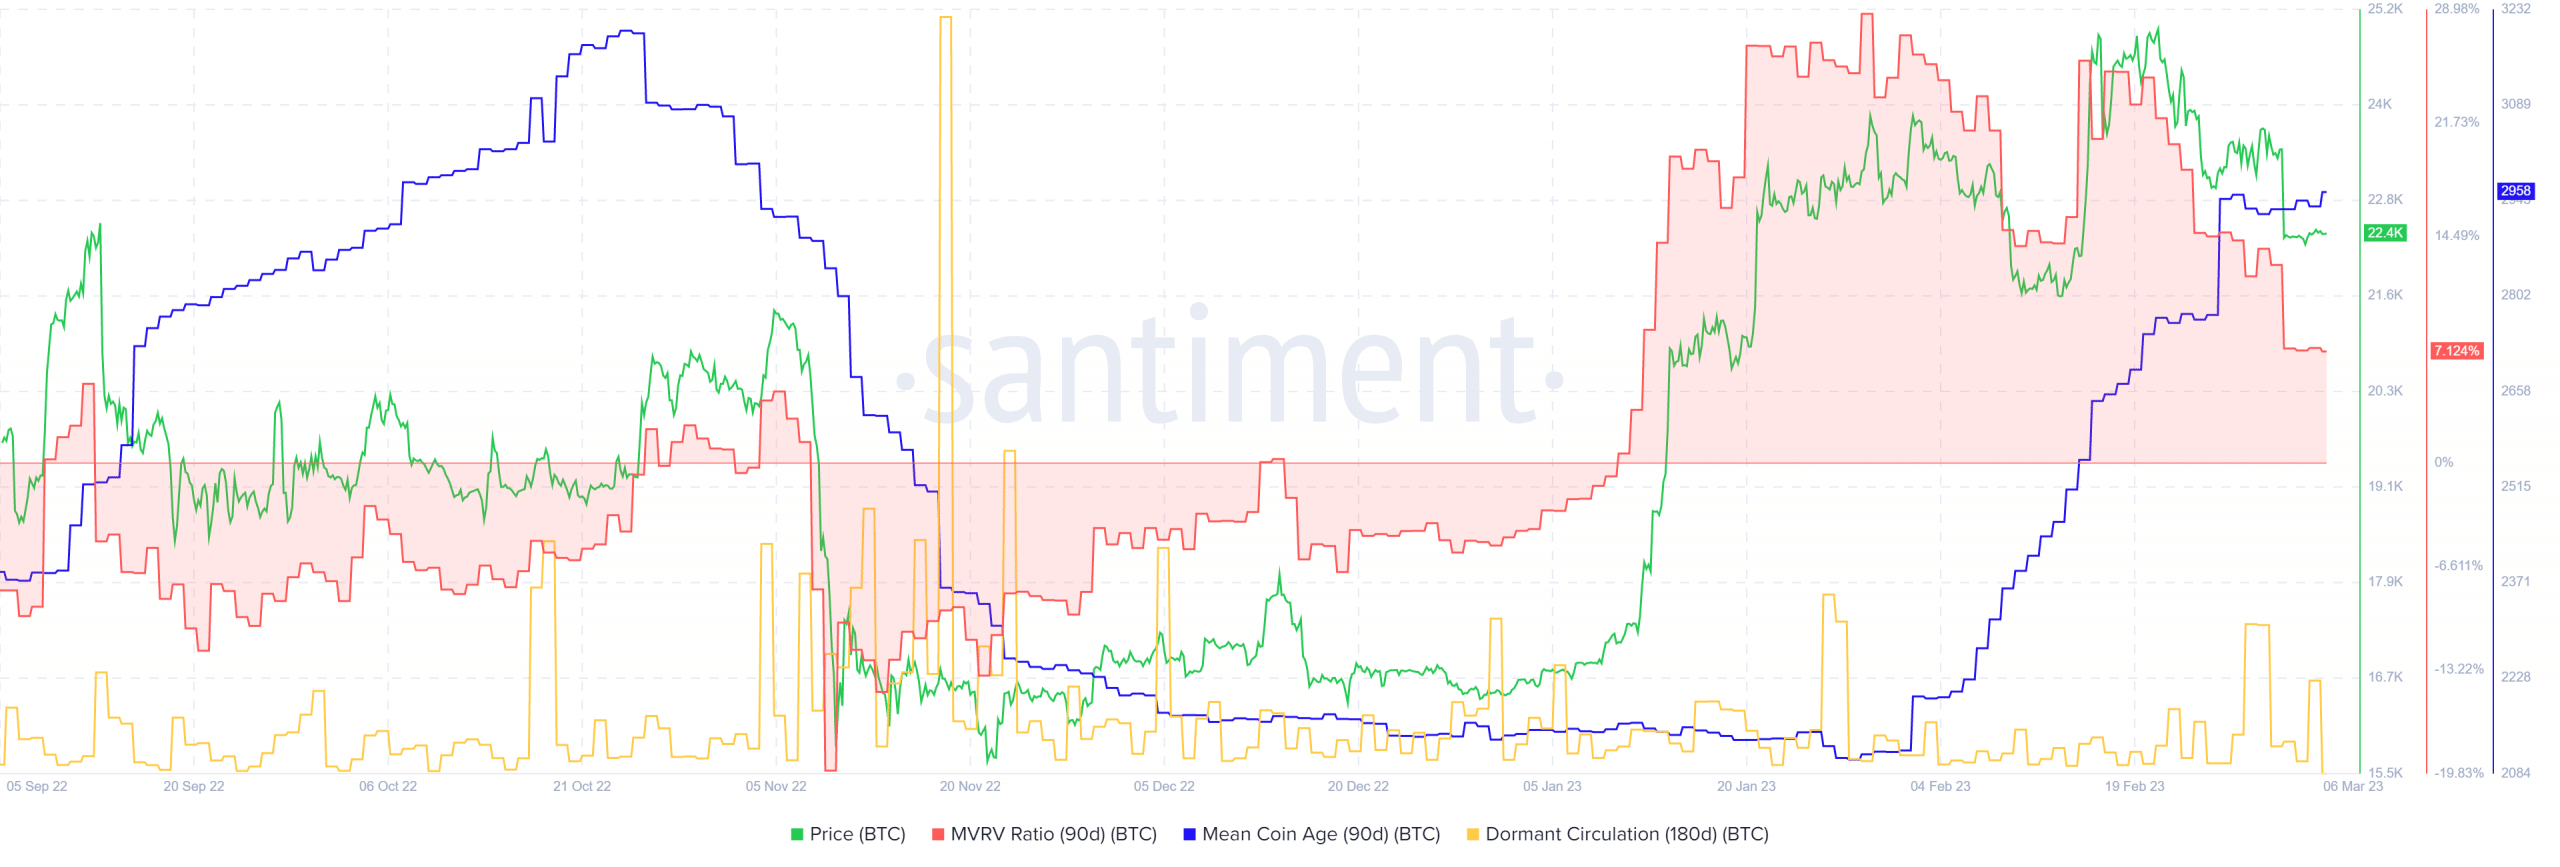
The 90-day mean coin age was on the rise and showed BTC accumulation across the network. The last time this happened was in October. The metric began to fall before the prices did, and a similar movement in the coming weeks could be an early sign to sell Bitcoin.
The dormant circulation showed noticeable spikes since early December, which highlighted how fear dominated the market.
The 90-day MVRV ratio was sliding southward but remained positive, which indicated the profit-taking might not be over yet.