Bitcoin: Should you expect more volatility ahead of the halving?
Bitcoin expects significant price swings in the short term as Implied Volatility spikes.

- Bitcoin’s Implied Volatility saw a surge last weekend.
- Bearish sentiments overrun the market as the halving nears.
The implied volatility for Bitcoin [BTC] options contracts expiring in April increased significantly from 62% to 75% over the weekend, Kaiko noted in a recent post on X (formerly Twitter).
Implied Volatility measures the expected future swings in a coin’s price.
Such a sharp rise in an asset’s Implied Volatility over a short period suggests a notable shift in market sentiment regarding where the asset’s price may be headed in the short term.
The surge in BTC’s implied volatility suggests that market participants expect increased price fluctuations or “turbulence” in the short term.
BTC in the spot market
An assessment of key volatility markers on BTC’s daily chart confirmed that the coin remains at risk of significant price swings in either direction.
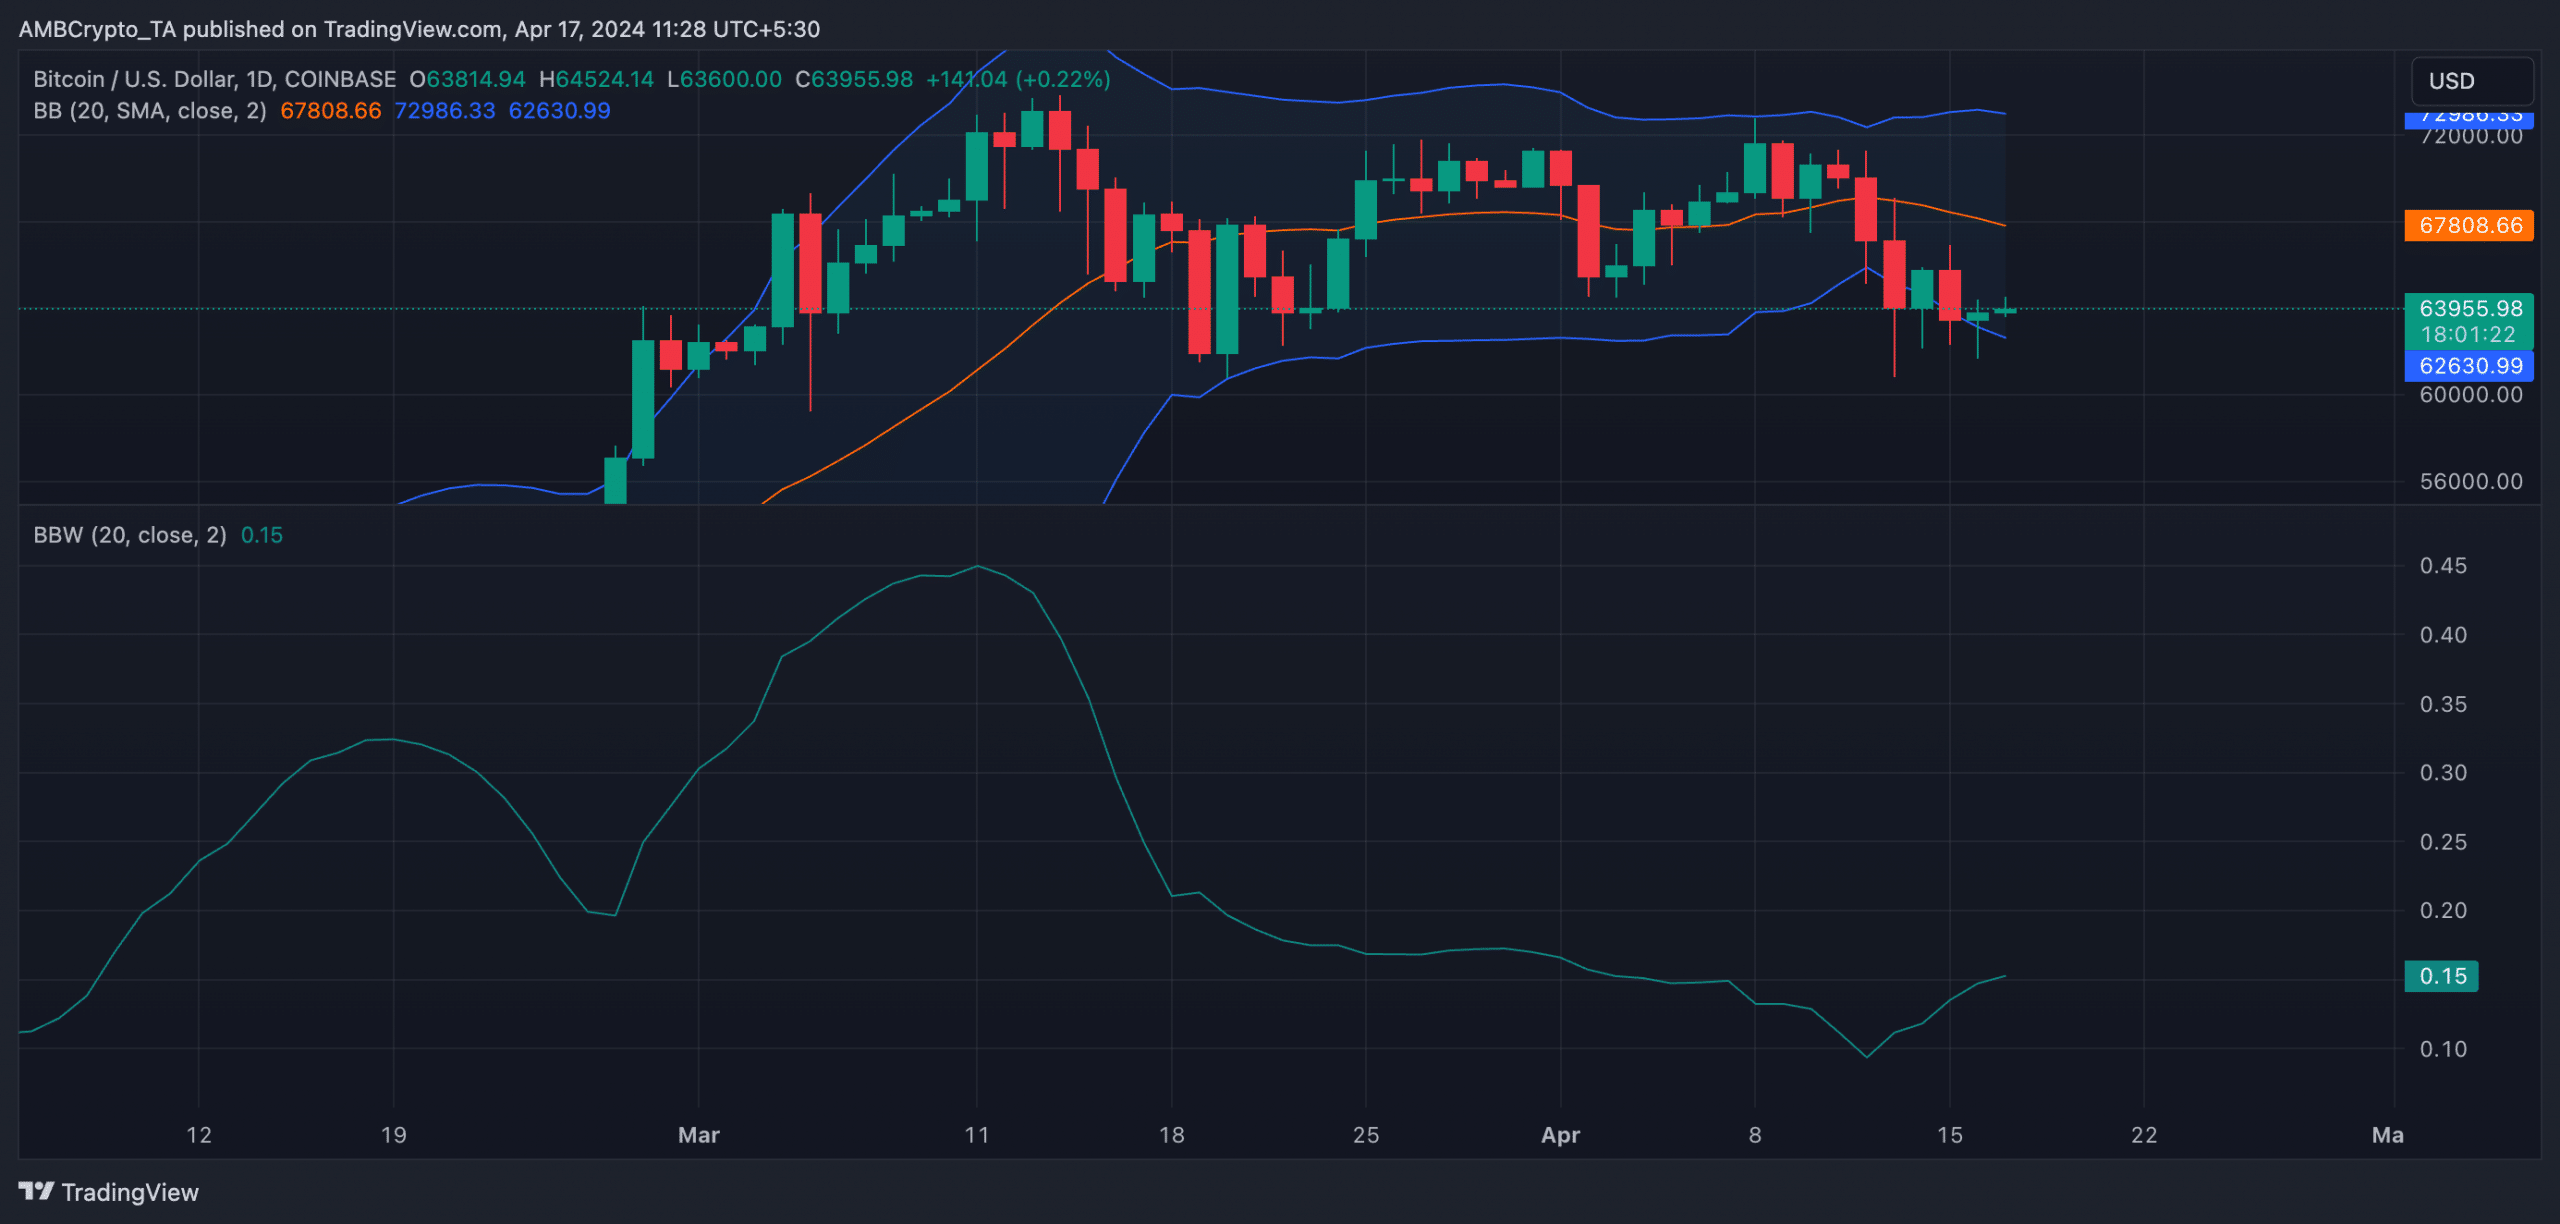
For example, the gap between the upper and lower bands of the coin’s Bollinger Bands (BB) indicator has widened. This indicator assesses market volatility and an asset’s potential price movements.
When the gap between its upper and lower bands widens, the asset’s price becomes more volatile and may break out in an uptrend or a downtrend.
Confirming the rising volatility, BTC’s Bollinger Bandwidth was in an uptrend as of this writing. At 0.15, the indicator’s value has risen by 67% in the past four days.
This indicator measures the width of the Bollinger Bands relative to each other. When it rises (as in BTC’s case), it confirms a rise in market volatility.
Amid rising volatility and the upcoming halving event on the 20th of April, bearish sentiments remained significant in the BTC market.
Readings from the coin’s Moving Average Convergence Divergence (MACD) indicator showed its MACD line resting below its signal and zero lines.
These lines have been so positioned since the 15th of March, when the coin fell from its all-time high of $73,750.
This indicated that BTC’s short-term moving average is below its longer-term moving average. This is often interpreted as a bearish signal.
Also, its positive directional index (green) was pegged below its negative index (red). This showed that the coin’s bear power significantly outpaced its bull power.
Is your portfolio green? Check out the BTC Profit Calculator
At press time, BTC’s Relative Strength Index (RSI) and Money Flow Index (MFI) were 43.29 and 35.45, respectively, suggesting a decline in daily demand.
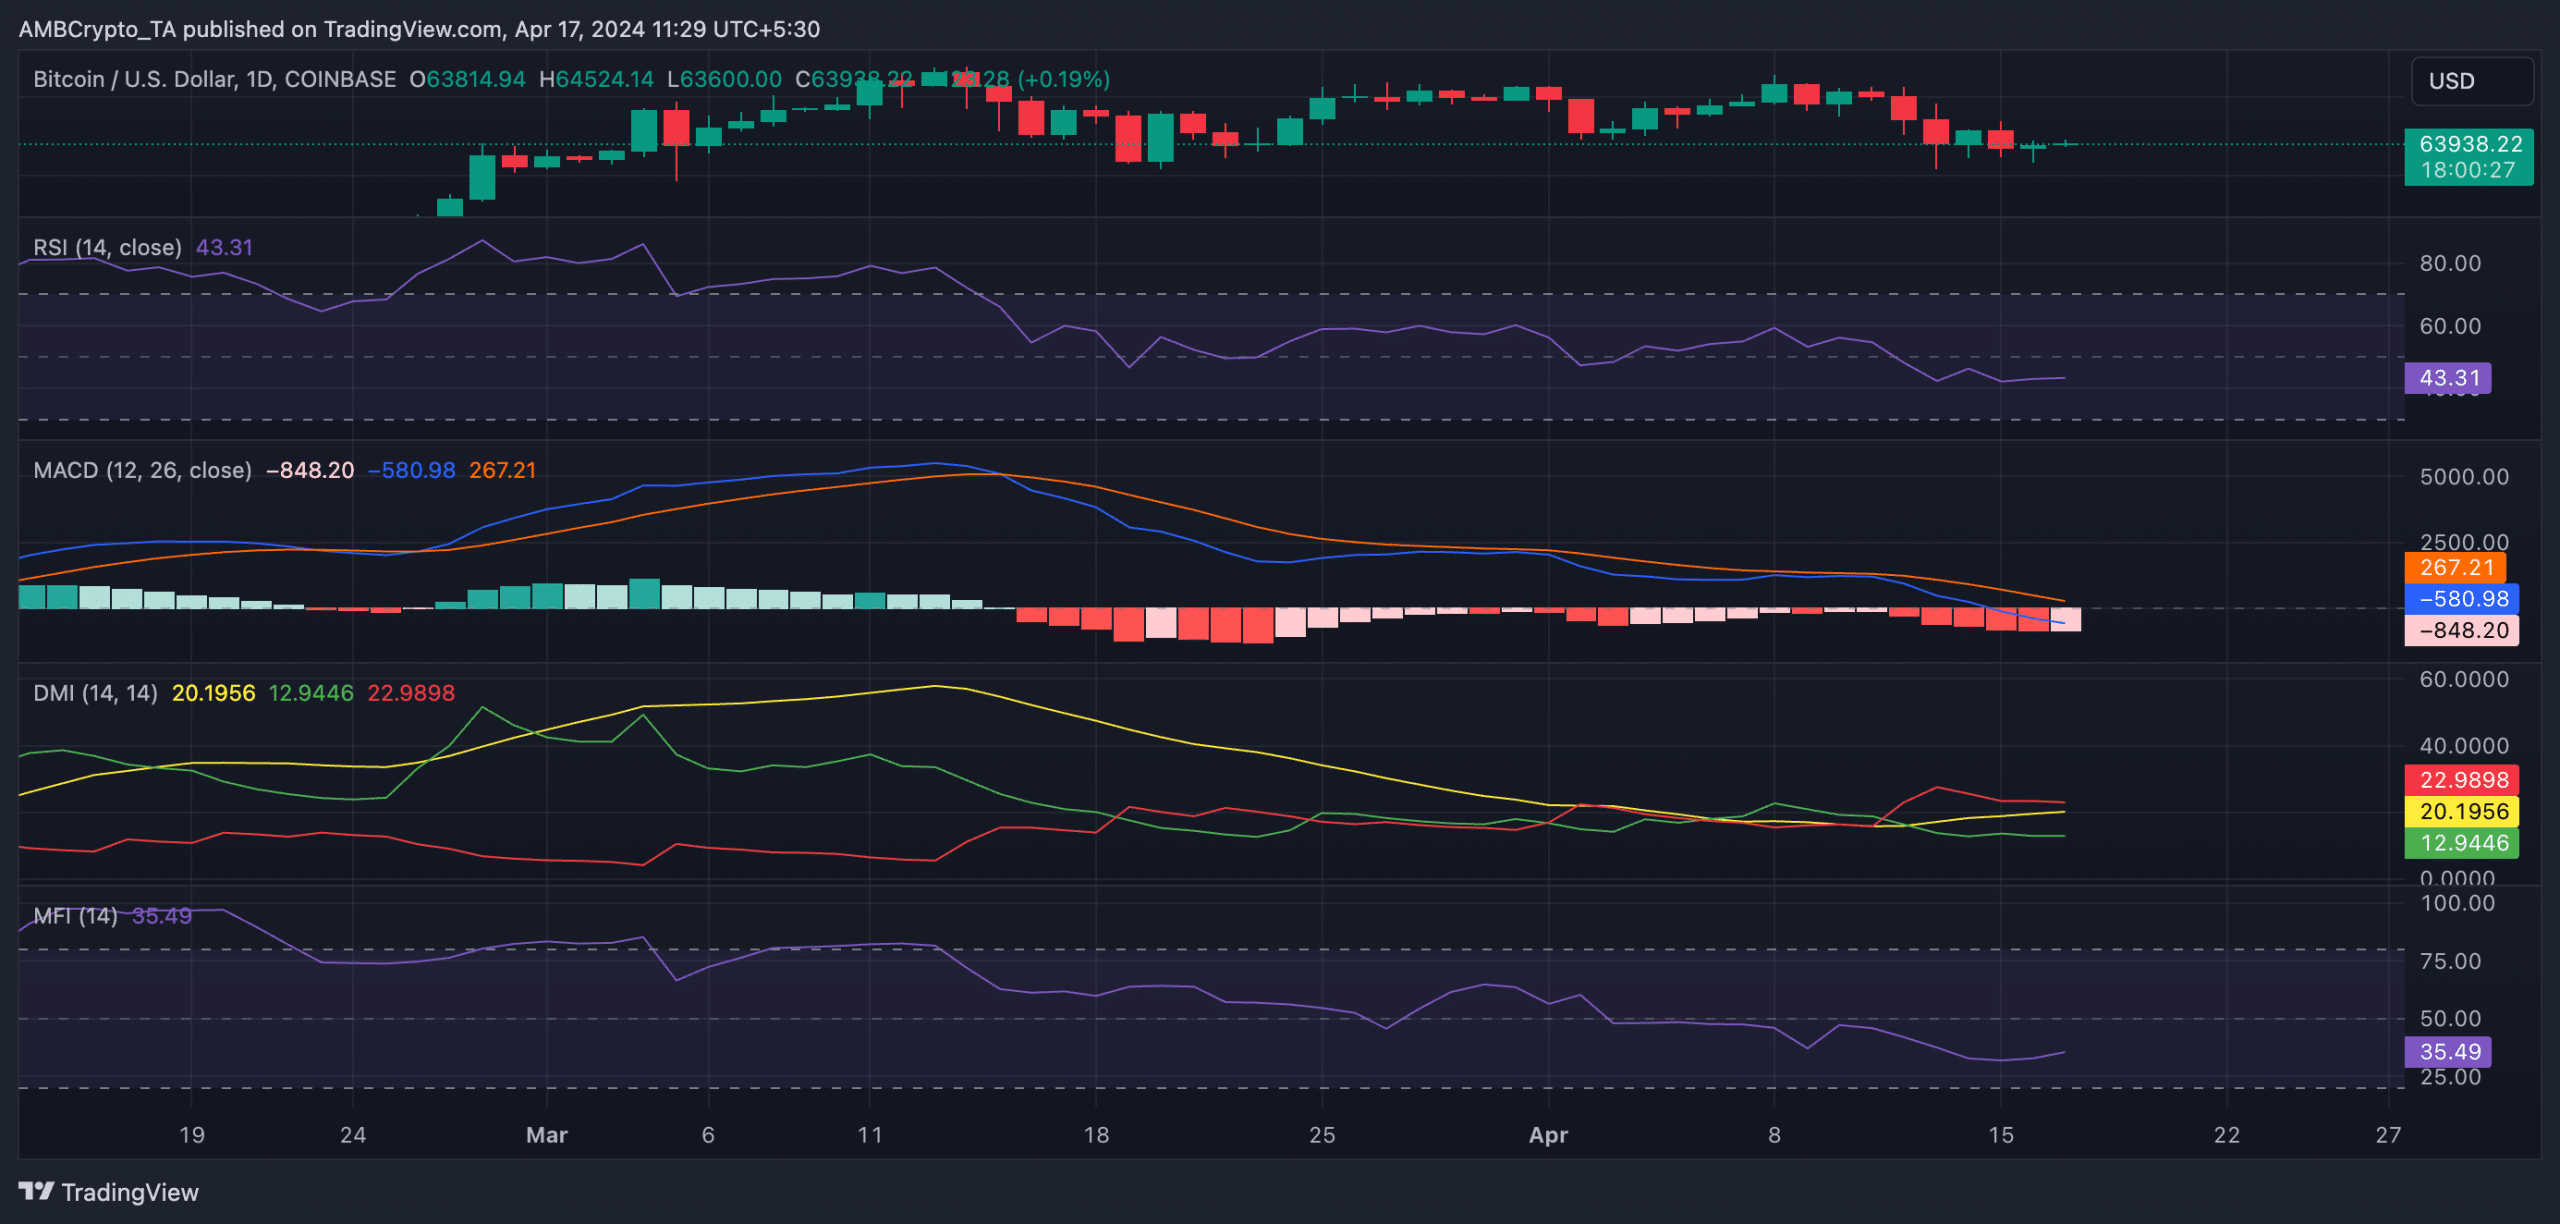
These values showed that market participants preferred to sell their coins rather than accumulate more.