Bitcoin stalls at $26k as supply in profit declines

- BTC’ s supply in profit has declined, while its supply in loss has rallied.
- As the price lingers at $26,000, a good buying opportunity might have availed itself.
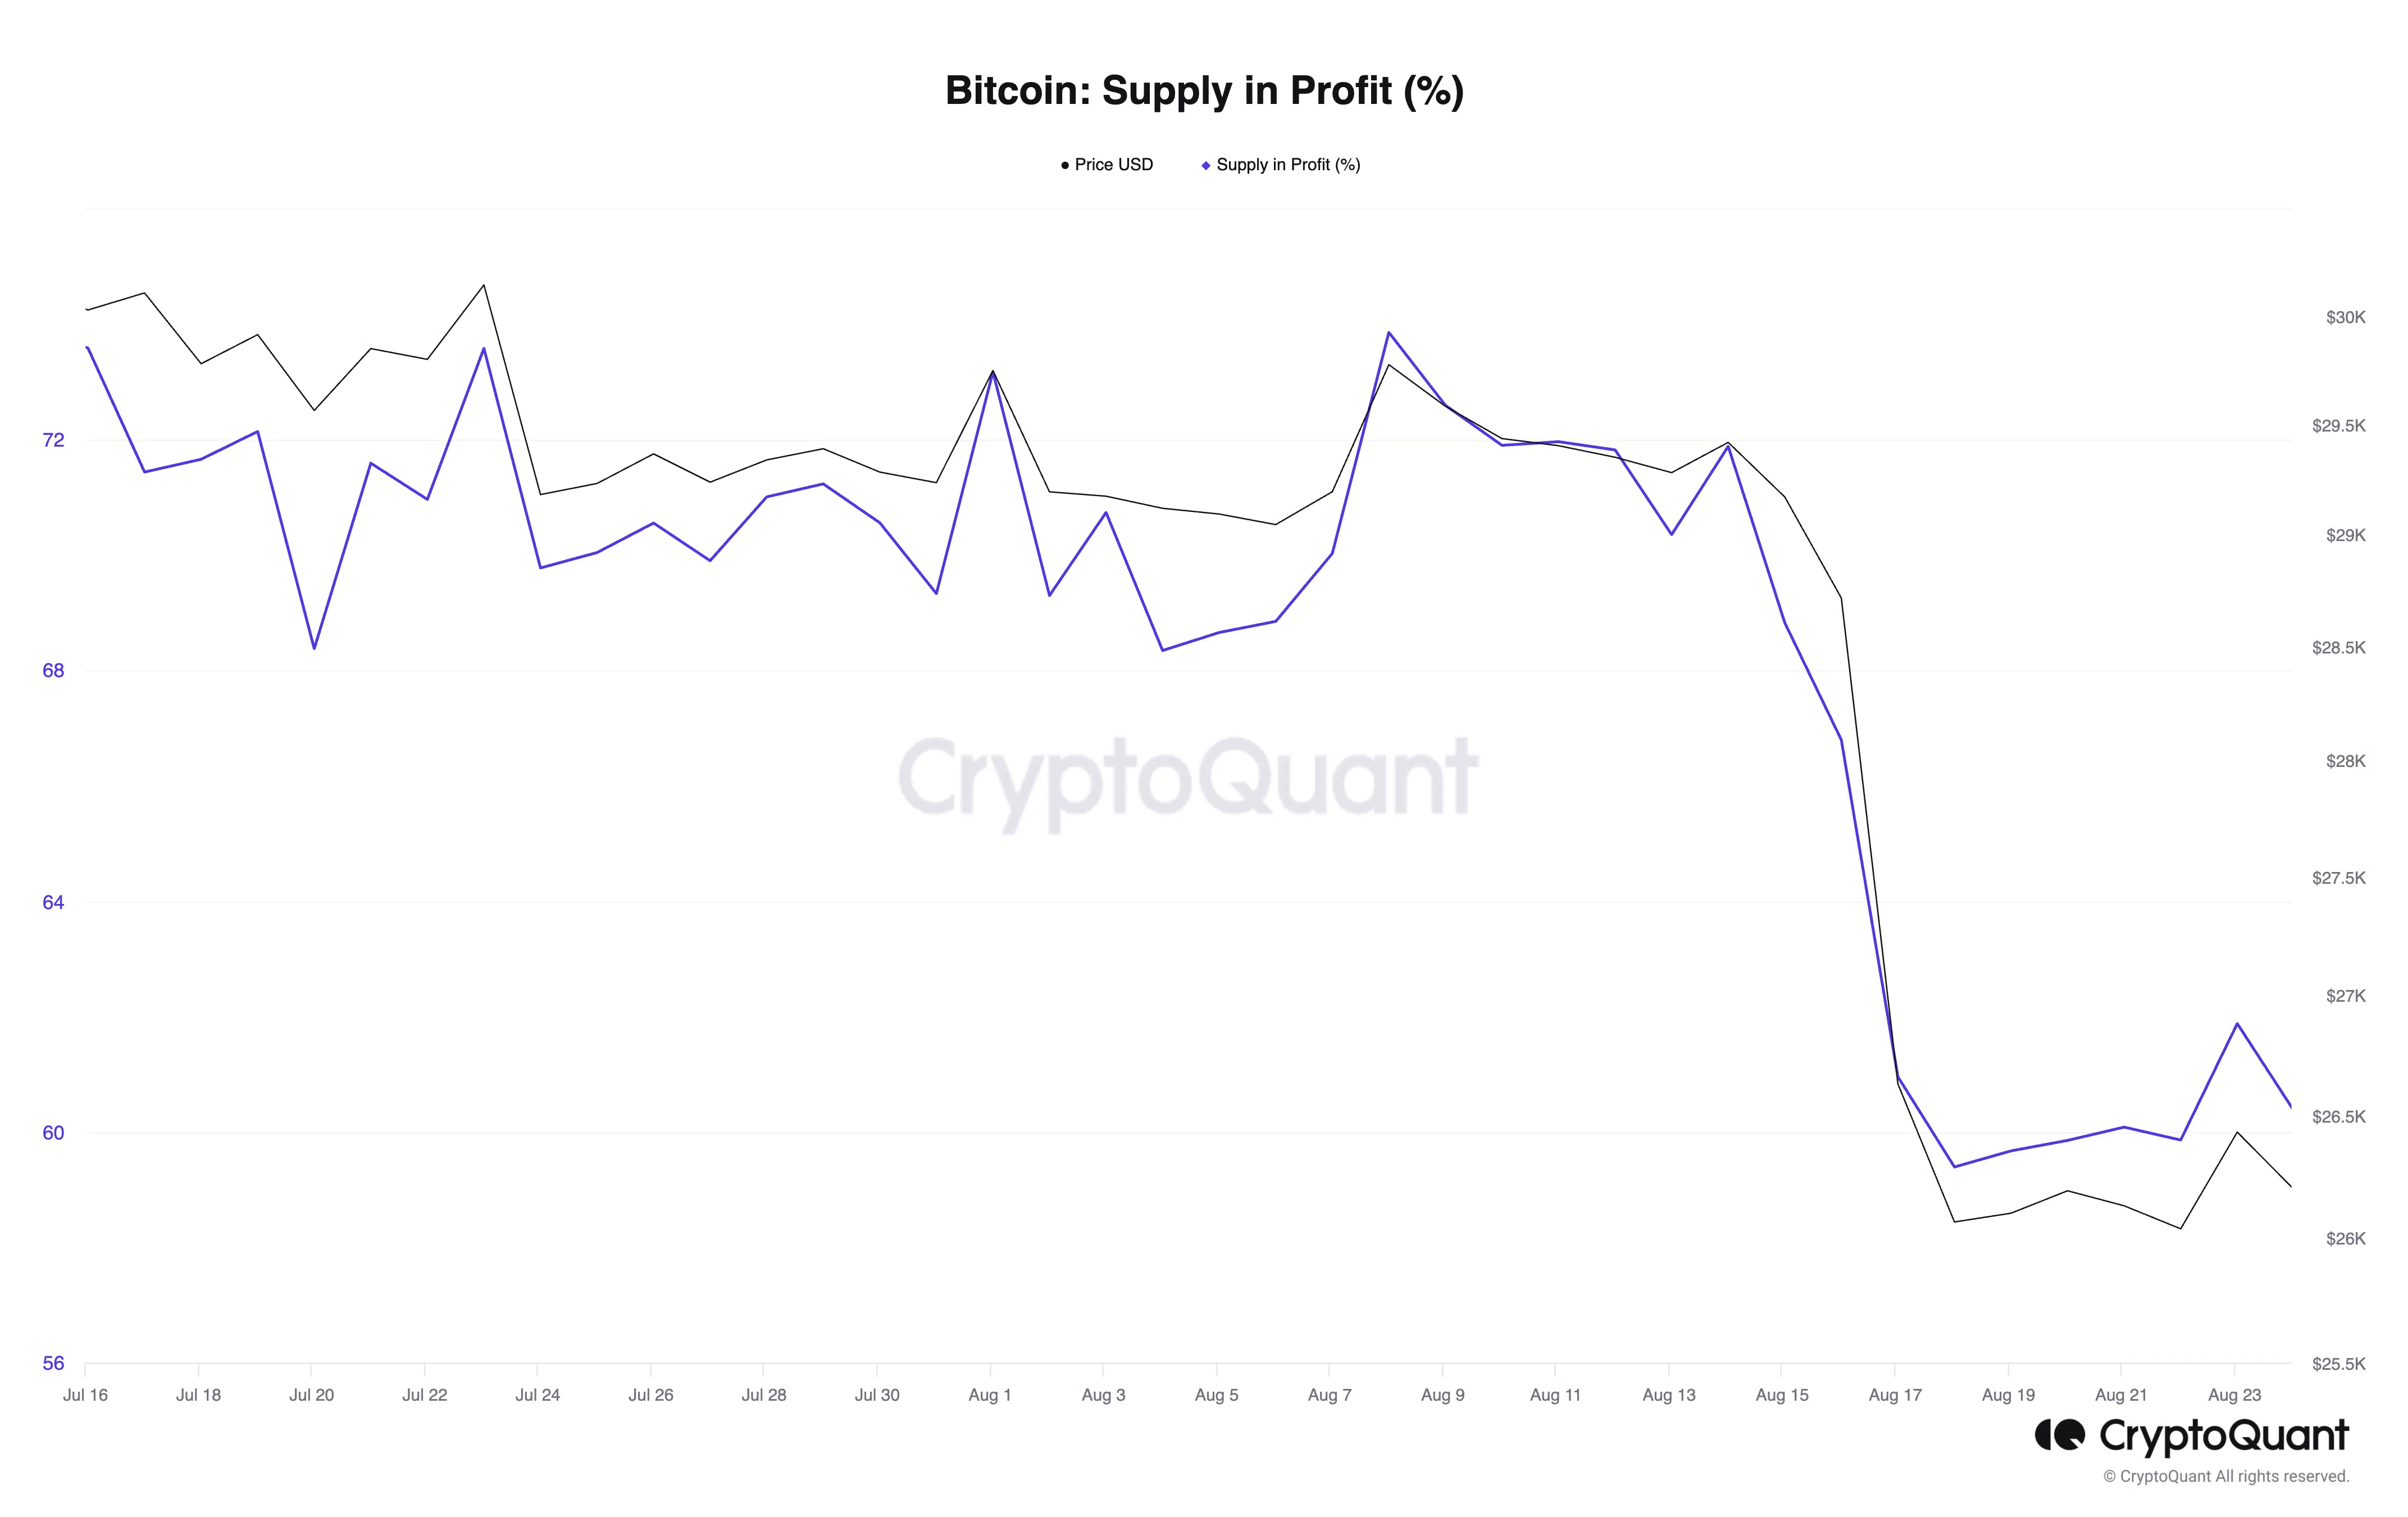
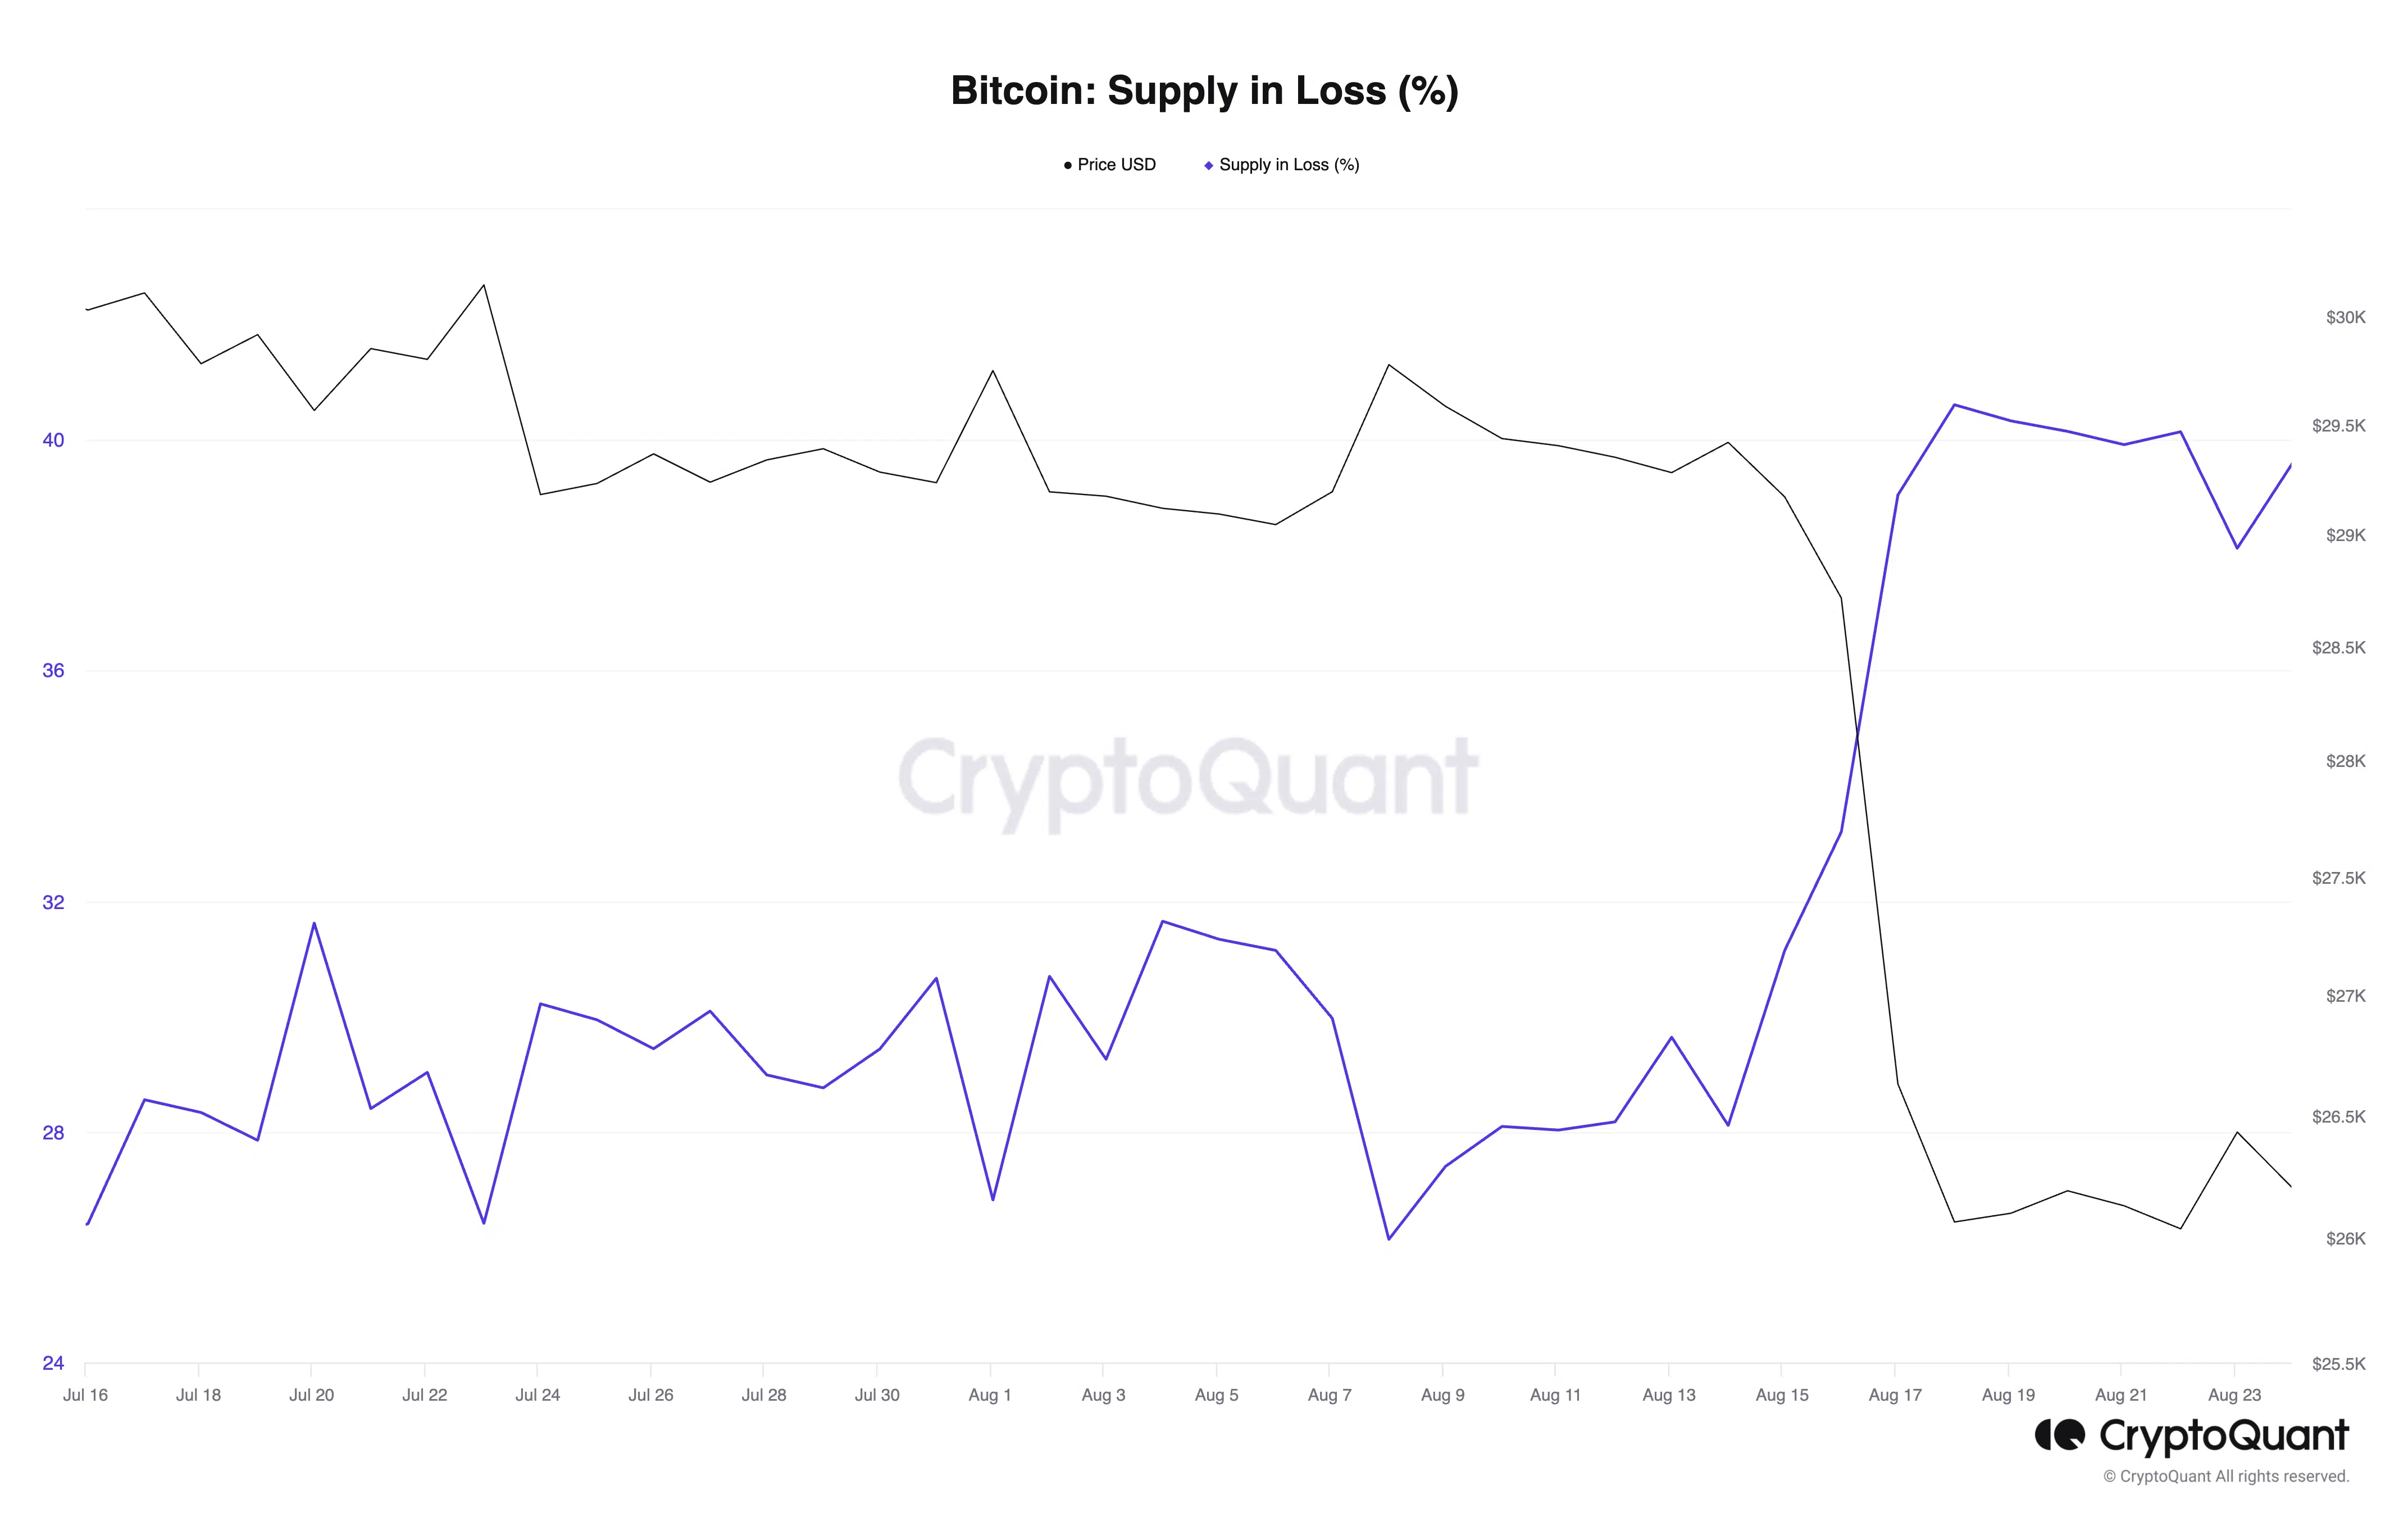
As Bitcoin’s [BTC] price stalled at $26,000 following the recent capital exodus, its price plunged to lows last seen in June. The coin’s supply in profit has declined, while its supply in loss has increased, pseudonymous CryptoQuant analyst Onchained revealed in a new report.
Read Bitcoin’s [BTC] Price Prediction 2023-24
The analyst assessed BTC’s Supply in Profit and its Supply in Loss metrics. These metrics measure the percentage of BTC currently held in profit and loss.
Typically, a high percentage of BTC’s Supply in Profit suggests that most coin holders are in profit and have refused to sell their holdings in anticipation of more profits. Onchain noted,
“This often points towards market optimism and is usually observed during bullish trends.”
Conversely, when the percentage of BTC’s Supply in Loss is high, a lot of coin holders hold at a loss and are willing to distribute their holdings below their cost basis. The analyst further pointed out,
“This can act as a precursor to a bearish phase or a prolonged period of consolidation, especially if combined with other bearish indicators.”
As of this writing, BTC’s Supply in Profit stood at 62%, having fallen by 15% since the month began. According to Onchained, this:
“Indicates that a significant fraction of holders who were previously in profit are now in a state of diminished returns or potential losses.”
On the other hand, the percentage of BTC’s Supply in Loss has gone by 46% since the beginning of the month, according to data from CryptoQuant.
Noting that the combination of these two metrics hinted at a significantly bearish market, the analyst concluded:
“This… strengthens the notion of a bearish sentiment. Such a sharp turn in metrics can signify a crucial pivot in market dynamics.”
A good buying opportunity?
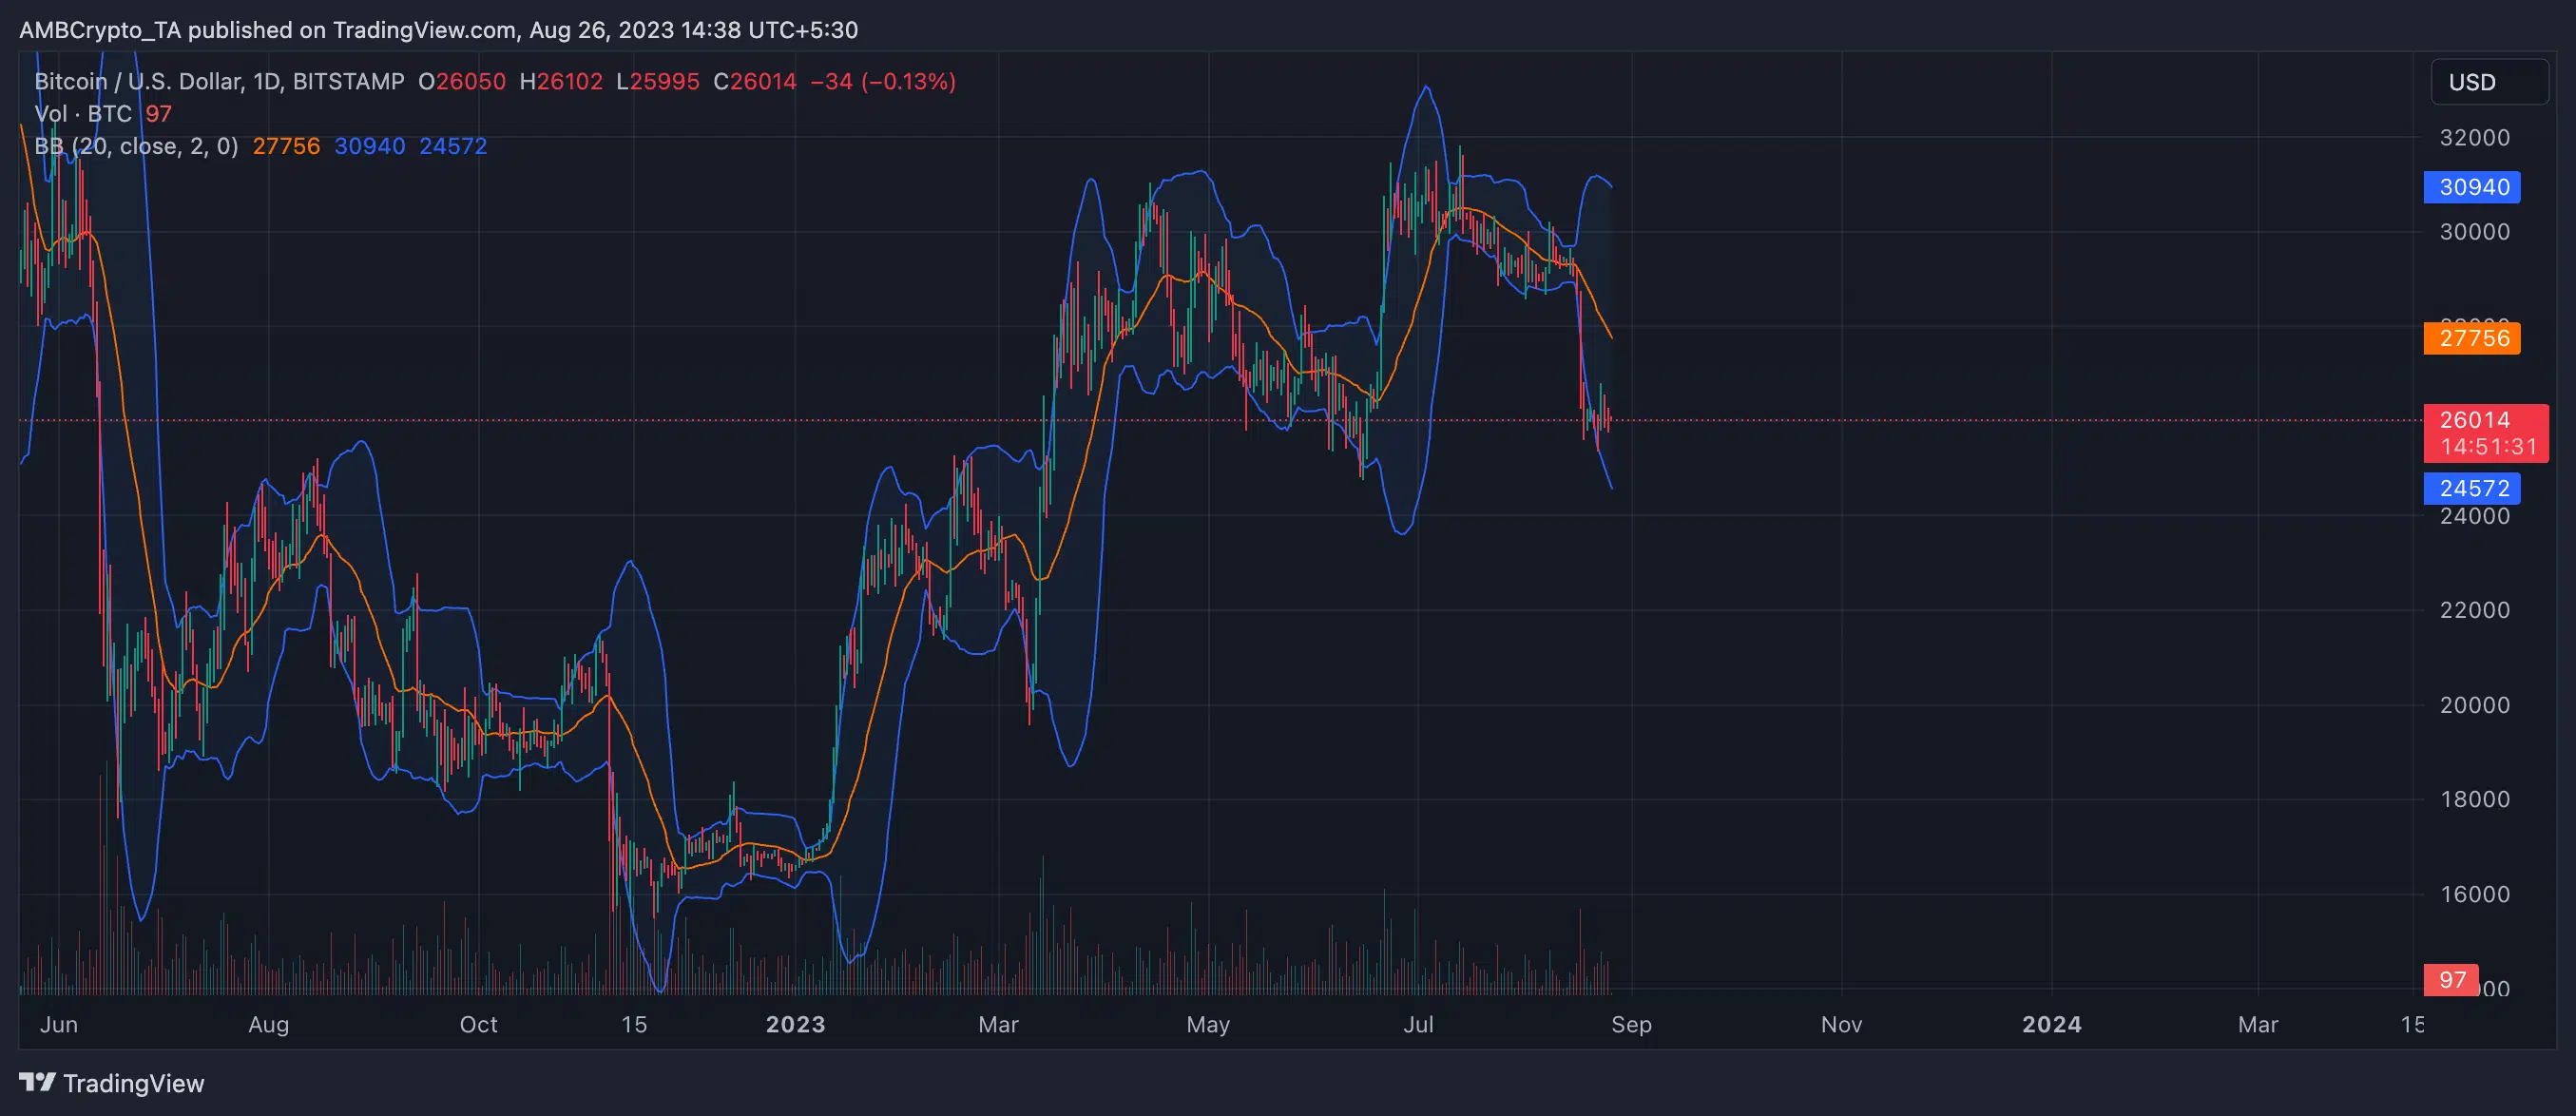
At press time, BTC traded at $26,008.79, according to data from CoinMarketCap. While its price appears to have stagnated at $26,000 following the 17 August deleveraging event, its Bollinger Bands (BB), on a daily chart, showed that the price remained severely volatile and prone to swings in either direction.
On a D1 chart, a wide gap existed between the upper and lower bands that make up the BB indicator, suggesting that market volatility remained high.
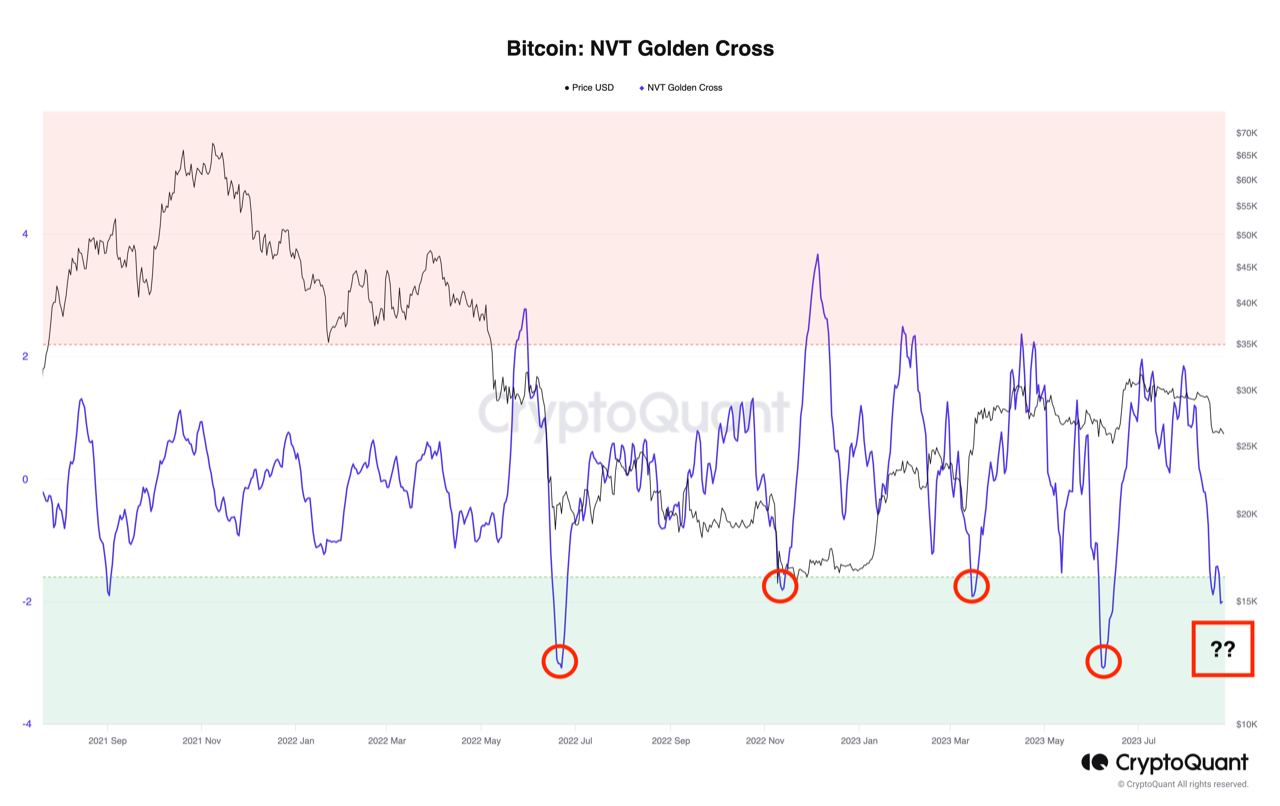
The CryptoQuant analyst also opined that a good buying opportunity might have presented itself despite current market conditions. Onchained assessed BTC’s NVT Golden Cross – an indicator that uses the Network Value to Transactions (NVT) ratio to identify potential price reversals.
According to Onchained, the indicator generates a long signal when it returns a value less than 1.6, suggesting that,
“Traders might consider opening long positions.”
Is your portfolio green? Check out the Bitcoin Profit Calculator
When the indicator returns values above 2.2, a short signal is generated, “suggesting traders could consider opening short positions.”
Considering BTC’s current NVT Golden Cross, the analyst concluded:
“Recently, the (NVT Golden Cross) indicator crossed below the -1.6 threshold, indicating a long signal. This suggests that the long-term trend of the NVT ratio was significantly higher than the short-term trend. According to the indicator’s logic, this would imply that the cryptocurrency network (Bitcoin) could be underpriced and poised for a potential price increase.”


