Bitcoin stalls under $64K, but THIS signals an uptrend: What now?
Bitcoin’s metric suggests that it is undervalued, but market indicators show more slow-moving days ahead.

- Bearish sentiment around BTC was dominant in the market.
- Selling pressure on the coin was high.
Bitcoin’s [BTC] price action remained underwhelming, as it has failed to move above $64k in the last few days. In the meantime, a key BTC metric entered a zone of indecisive direction.
Does this mean investors have to wait longer to see BTC rise again?
What’s going on with Bitcoin?
CoinMarketCap’s data revealed that BTC was down by more than 2% in the last seven days.
This pushed BTC’s price under $64k, as at press time it was trading at $63,843.66 with a market capitalization of over $1.26 trillion.
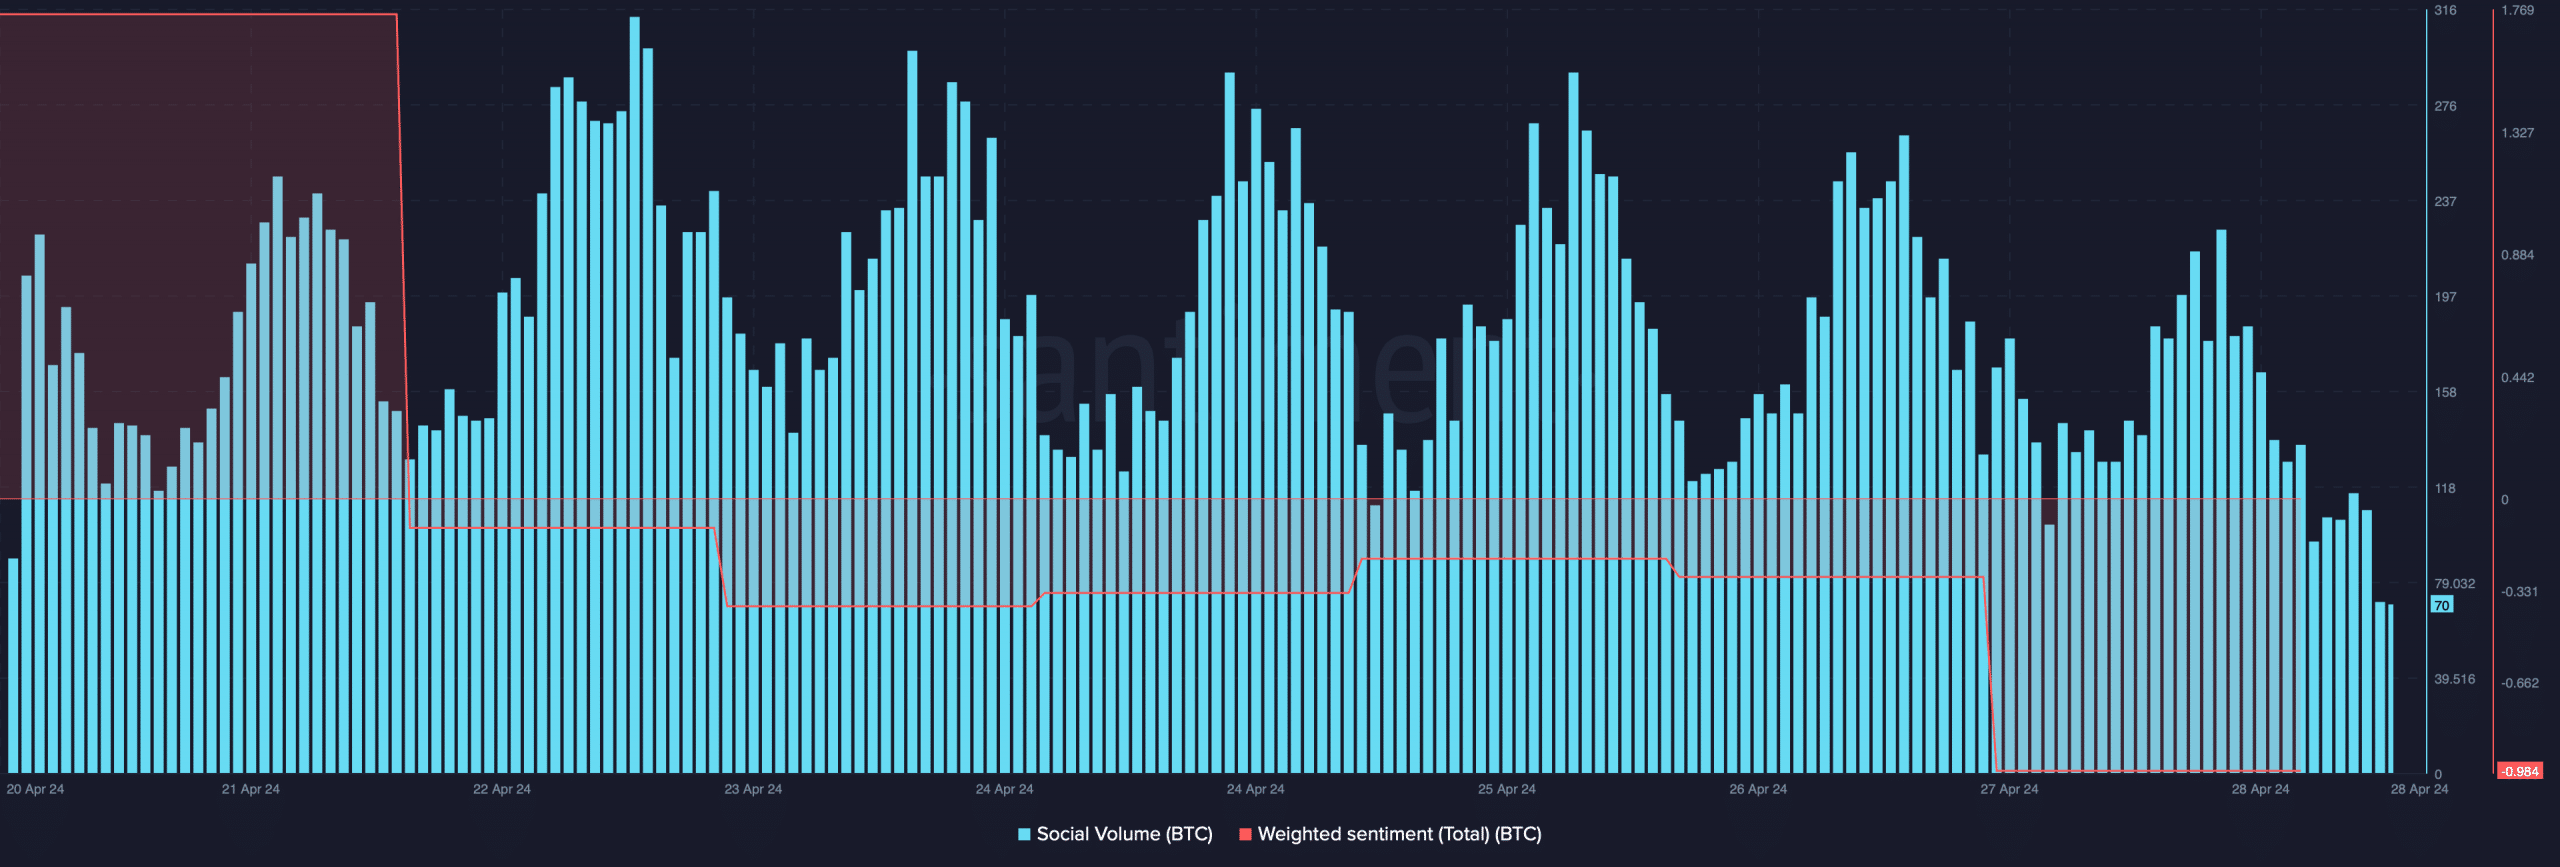
Because of the negative price action, Weighted Sentiment around the king of cryptos turned bearish on the 27th of April.
Its Social Volume also dropped slightly last week, reflecting a decline in BTC’s popularity in the crypto space.
Meanwhile, Phi Deltalytics, an author and analyst at CryptoQuant, posted an analysis using a key BTC metric.
As per the analysis, the adjusted Spent Output Profit Ratio (SOPR) of Bitcoin continued to move in a bullish direction, while the short-term SOPR has entered a zone of uncertainty.
This discrepancy highlighted a complex environment where short-term investors faced losses.

The analysis mentioned,
“While fluctuations of this nature are not uncommon, particularly during periods of price exploration toward new all-time highs, heightened vigilance is warranted.”
AMBCrypto’s analysis of Glassnode’s data also pointed out an interesting development related to short-term holders. We found that BTC’s STH MVRV dropped over the past few weeks.
For the uninitiated, a low MVRV suggests that the current price of Bitcoin is relatively lower compared to the last transaction prices.
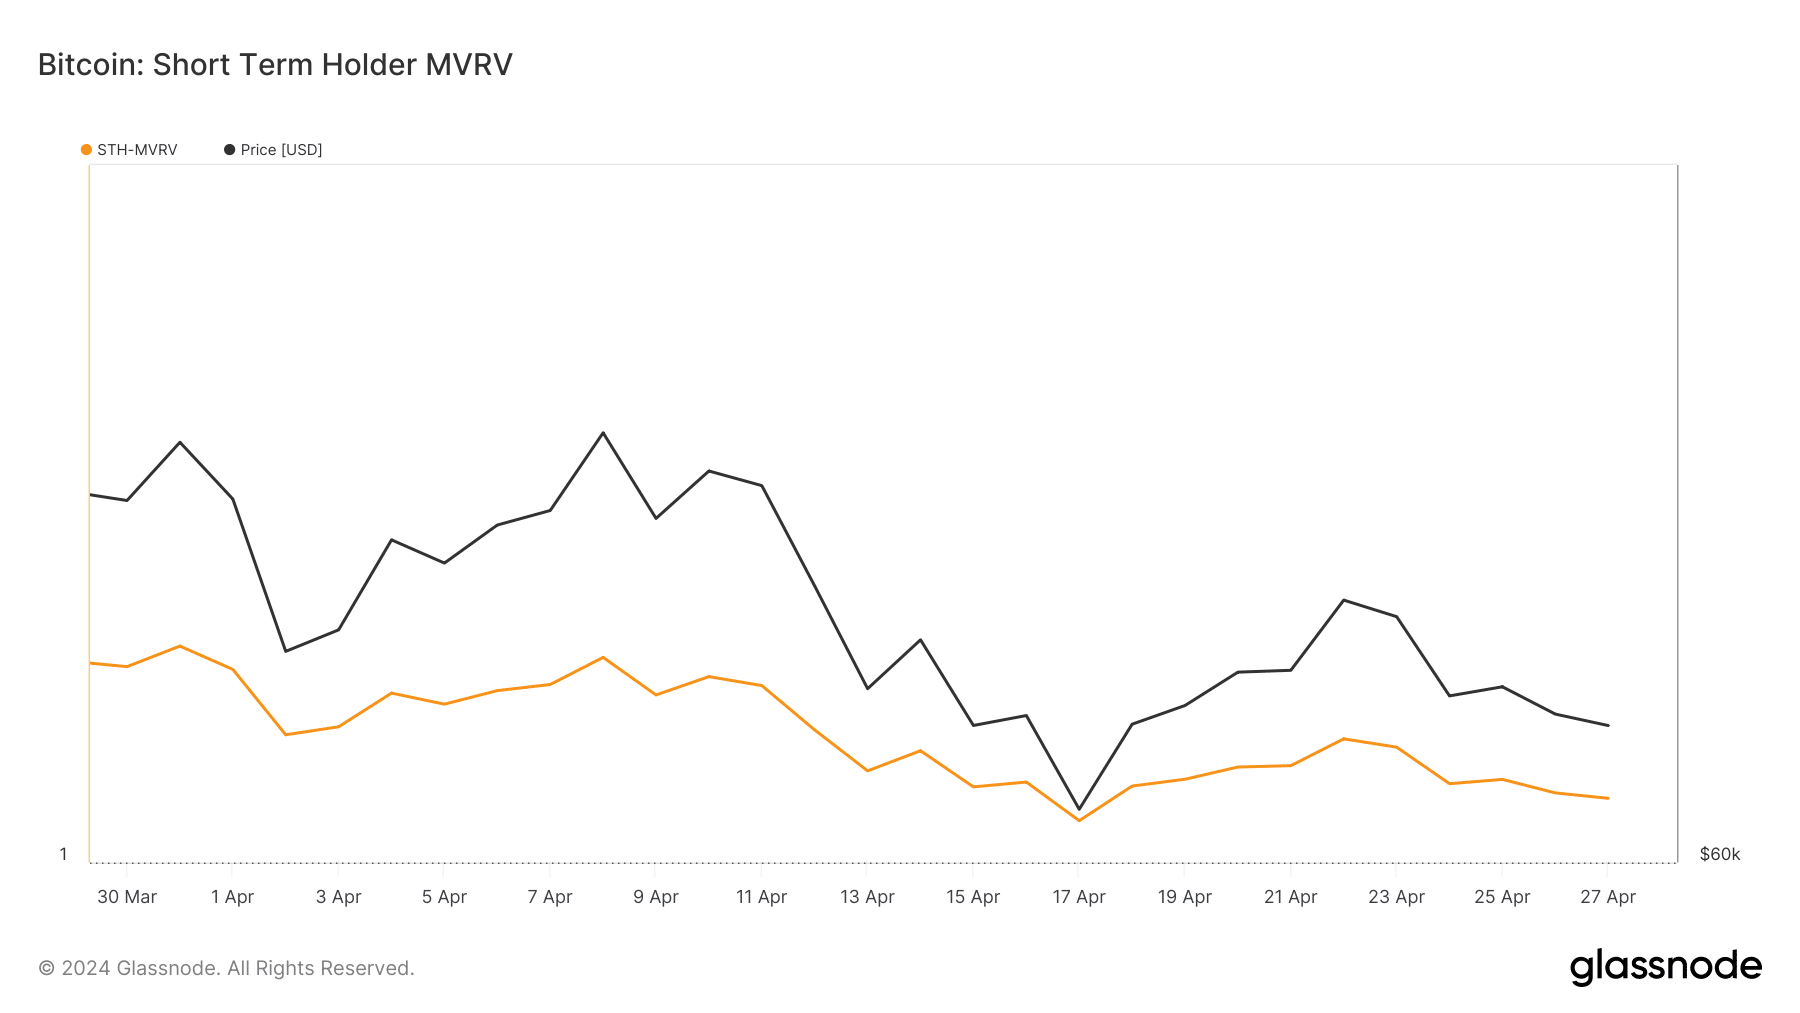
Does this hint at a price uptick?
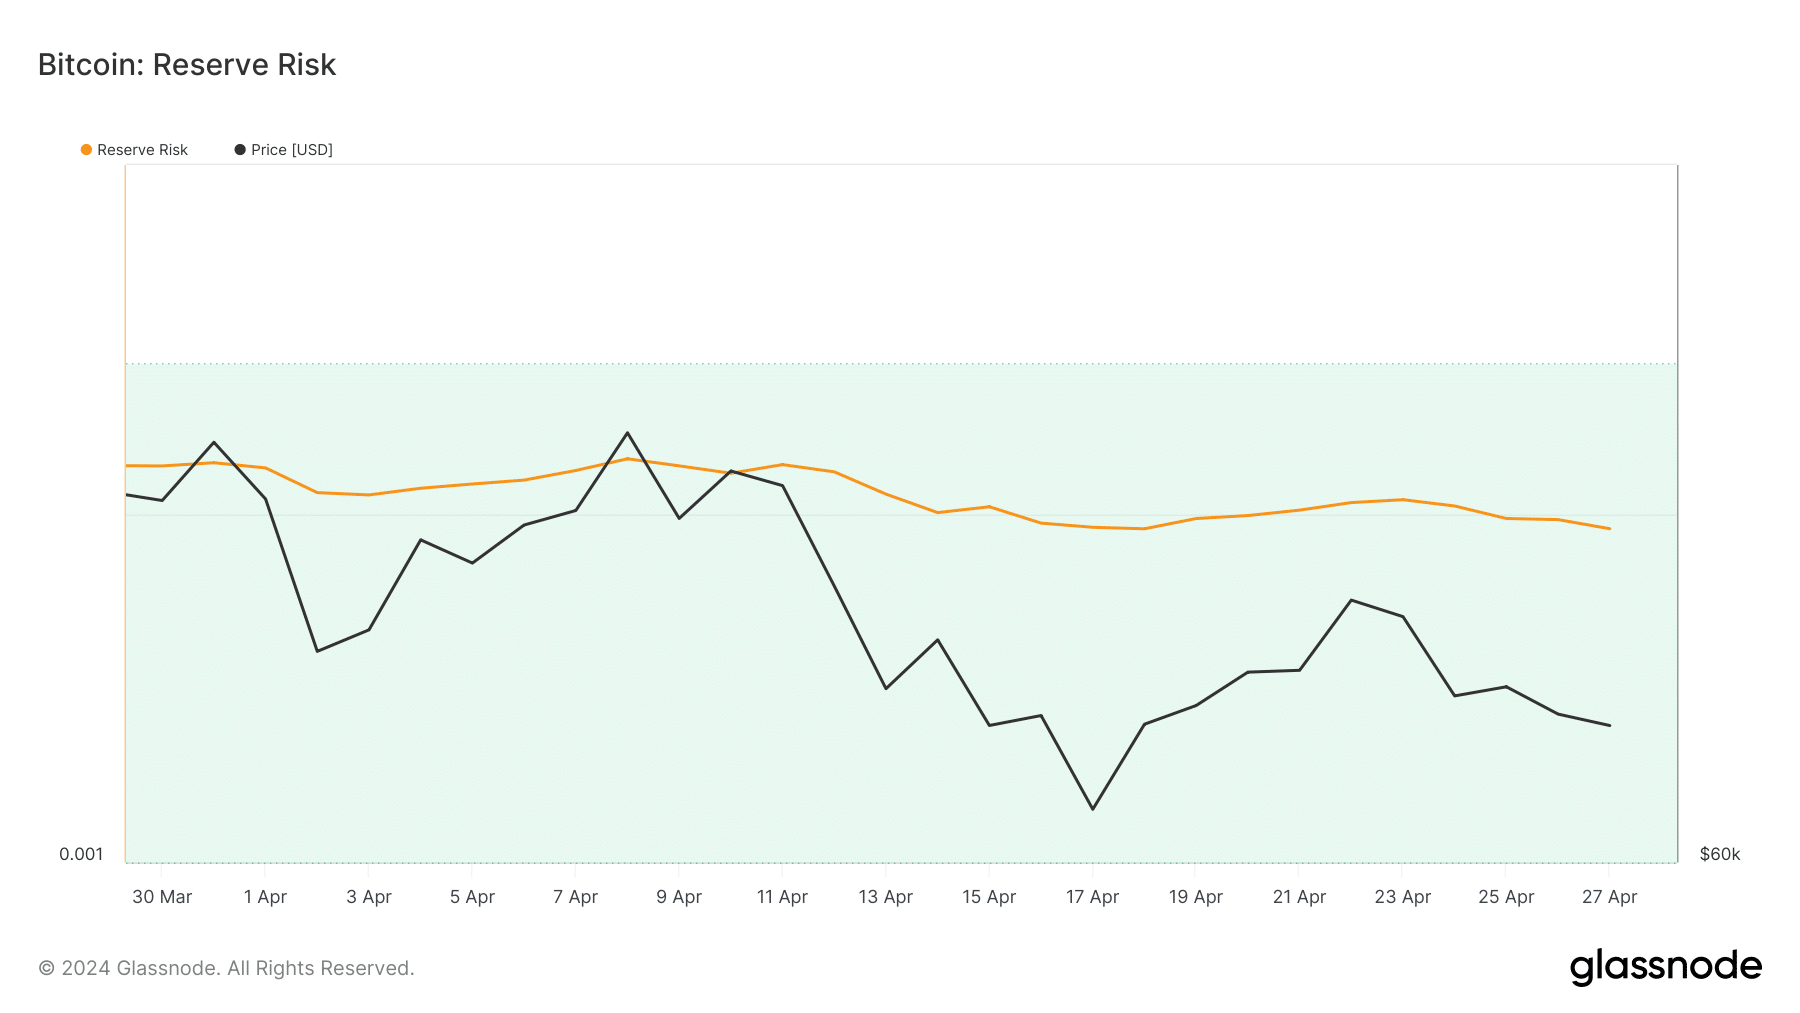
Since BTC seemed to be undervalued, AMBCrypto took a closer look at its state to better understand whether a price rise was around the corner. As per our analysis, BTC’s reserve risk was low.
This metric indicated that confidence in BTC was high. However, its price lay low at press time, which could be inferred as a bullish signal.
Not everything looked optimistic for BTC. For instance, AMBCrypto’s look at CryptoQuant’s data revealed that selling pressure on BTC was high as its exchange reserve was increasing.
Its net deposit on exchanges was also high compared to the last seven days’ average.

Read Bitcoin’s [BTC] Price Prediction 2024-2025
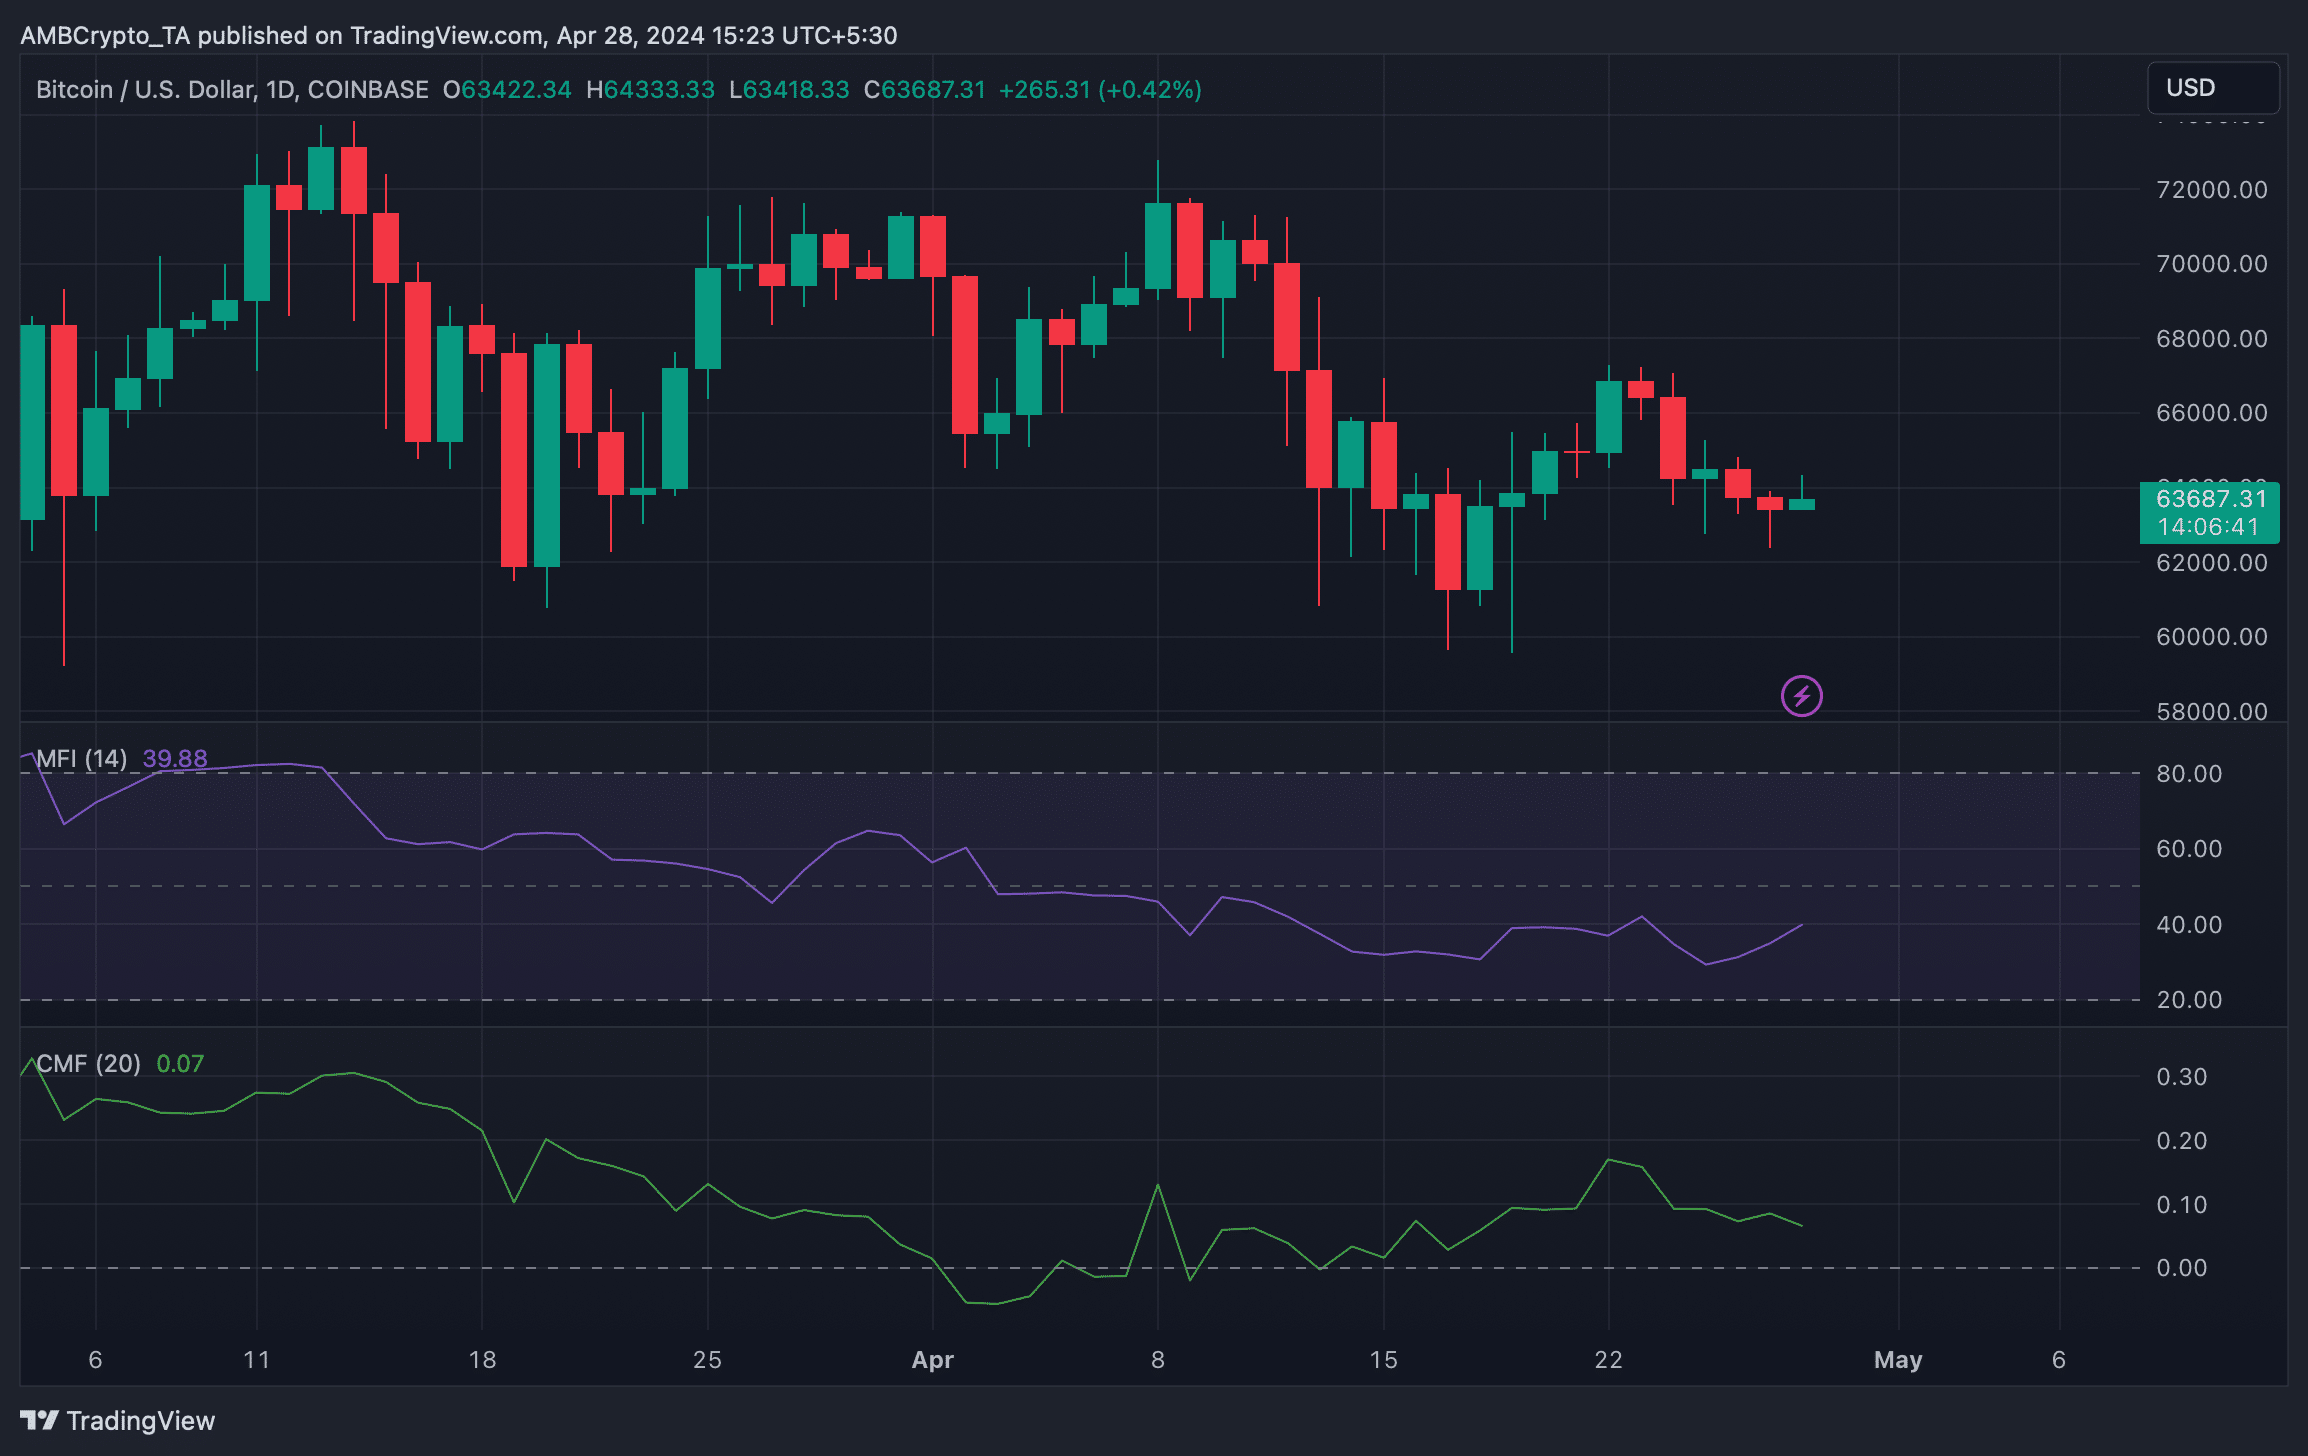
We then took a look at BTC’s daily chart to see what market indicators had to suggest regarding BTC’s upcoming price movement.
As per our analysis, the Money Flow Index (MFI) hinted at a price uptick as it moved upwards. However, the Chaikin Money Flow (CMF) remained bearish.