Bitcoin
Bitcoin struggles to maintain momentum as bears block its path
Bitcoin was evaluated at $10,342.89 as its price hiked by 0.70% over the 24-hour cycle. With a market cap of $185.48 billion, BTC recorded $14.93 billion exchanging volume in the course of recent 24 hours, at press time. The dominant part of the exchanging volume was produced over the BKEX trade exchange utilizing BTC/USDT pair, as per CoinMarketCap.
1-Hour BTC
In the 1-hour chart, BTC faced resistance at $10,899.51 and $10,426.74 respectively, in addition to getting support at $10,286.66. The digital gold saw a steep downtrend from $10,899.51262 and ended at $10,432.58.

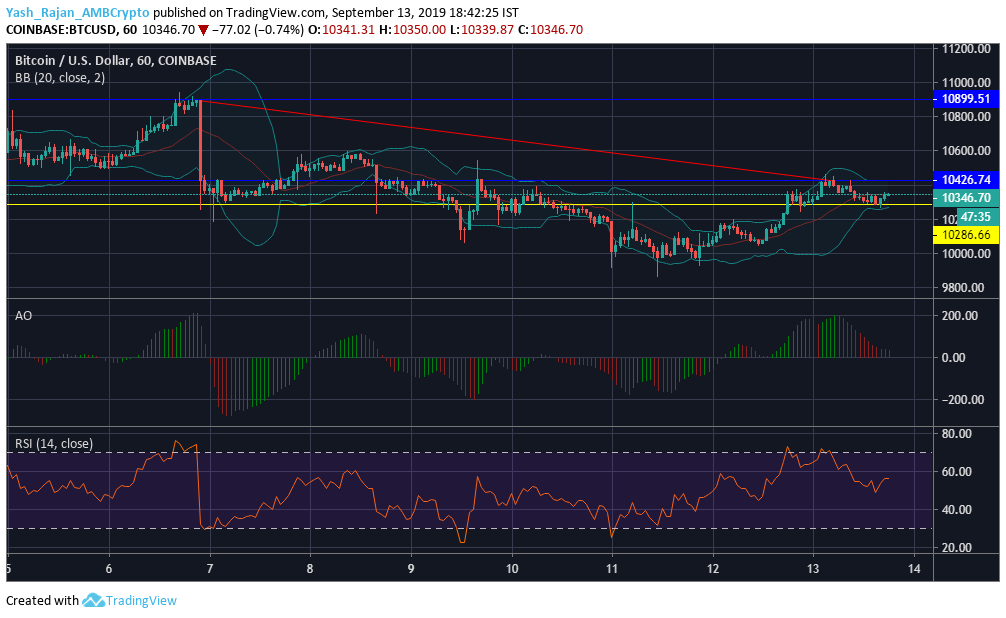
Source: TradingView
Bollinger Bands were squeezing, displaying that volatility reduced in the market.
Awesome Oscillator presented a bullish buying opportunity as the short-term momentum was greater than the long-term momentum. The green lines appearing at the end indicated the possibility of a bullish market latterly.
The RSI indicator stood at 56.23, exhibiting that buying pressure was high.
1-Day BTC
In the one-day chart, BTC formed support at $9,987.86. The king coin faced resistance at $12,941.31 and $10,775.34. BTC recorded a sharp downtrend from $12,068.78 to $10,601.86. Previously, digital gold recorded an uptrend from $3,876.56 to $12,927.91.
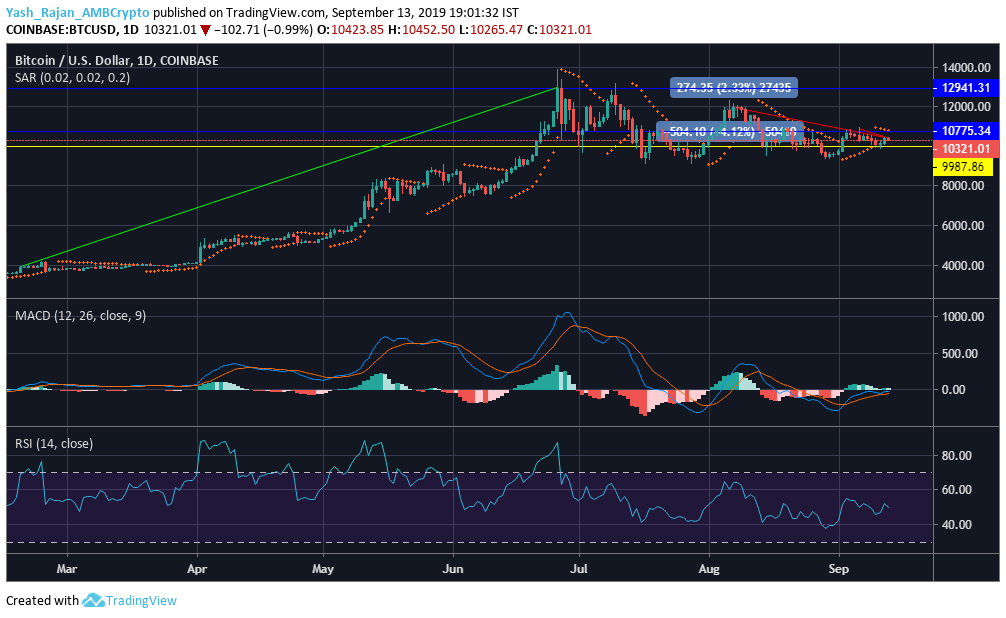
Source: TradingView
Parabolic SAR revealed a bearish trend as the dotted markers were present above the candles.
The MACD line crossed above the signal line, revealing a bullish trend with a slight chance of a reversal in the offing.
The RSI indicator stood at 49.97, displaying that selling pressure was high.
Conclusion
The indicators exhibited that BTC was in the bearish zone.

![Notcoin's [NOT] 'rocky' launch - How a $1 billion start ended with a major sell-off](https://ambcrypto.com/wp-content/uploads/2024/05/Notcoin-drops-by-over-50-400x240.webp)