Bitcoin surges past $60,000 – How long before $100k falls?

As cliché and repetitive as it sounds, once again, it’s “another day, another ATH.” On the back of an over 5% hike over the last few hours, Bitcoin, the world’s largest cryptocurrency, breached the much-anticipated $60,000-mark, with the crypto building on 2021’s gains yet again.
As expected, BTC’s breach of $60k was welcomed and celebrated by many in the community, especially since just recently, Bitcoin’s market cap passed the value of $1 trillion once again.

Source: BTC/USD on TradingView
Understandably, the scale and pace of BTC’s price movement have taken many by surprise, especially since for long periods over the past 2-3 weeks, the cryptocurrency was rangebound, whether under $47,000 or under $54,000.
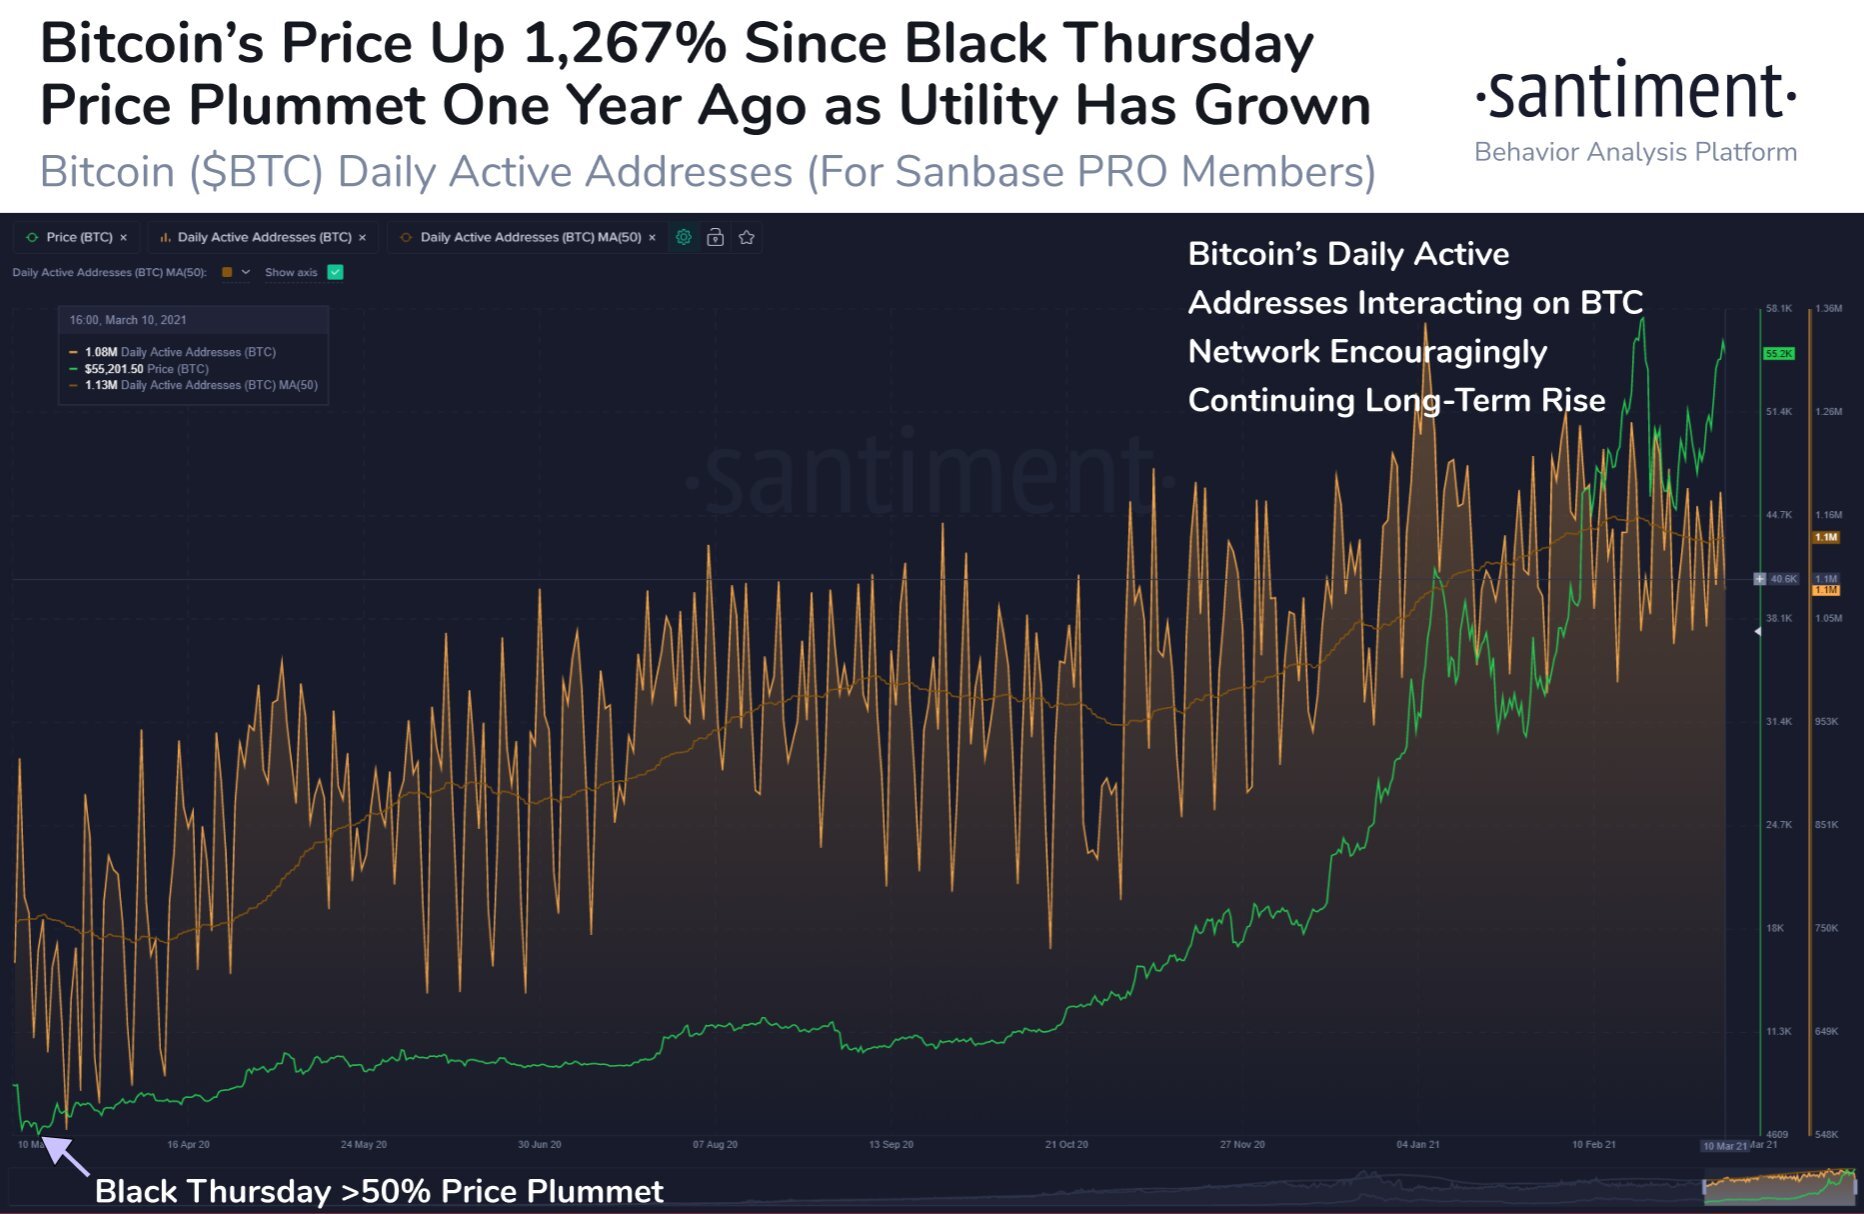
Curiously, Bitcoin’s latest ATH came just over a year after the infamous Black Thursday event, a day that saw the cryptocurrency fall to as low as $4,000 on the charts. Since then, BTC has hiked, with a spurt in DAA helping the cryptocurrency rise on the charts.

Source: Santiment
Here, it’s worth noting that Bitcoin’s breach of $50k and later, $55k, were precipitated by important developments, including MicroStrategy’s decision to purchase more Bitcoin by offering $600M worth of senior convertible notes.
While organic developments such as these have obviously helped, on-chain metrics have also contributed to Bitcoin’s bullish case over the past few weeks and months as well.
Bitcoin’s supply on crypto-exchanges, for instance, has continued to fall on the charts, with the same recently touching levels last seen in early-December. At the time, BTC was priced at just over $16,000, with the cryptocurrency then yet to go on the bull rally that saw it surge past its 2017-ATH and double its value in less than a month. Ergo, with the supply continuing to fall, the cryptocurrency can be expected to hike even more in the near-term.
In fact, until a few days ago, Bitcoin’s Network Realized Profit or Loss hadn’t hit a peak yet either, suggesting that many holders were yet to sell their bags at significant profits. This also indicated that these holders are hopeful of more upside on the price charts, at least in the short-term.
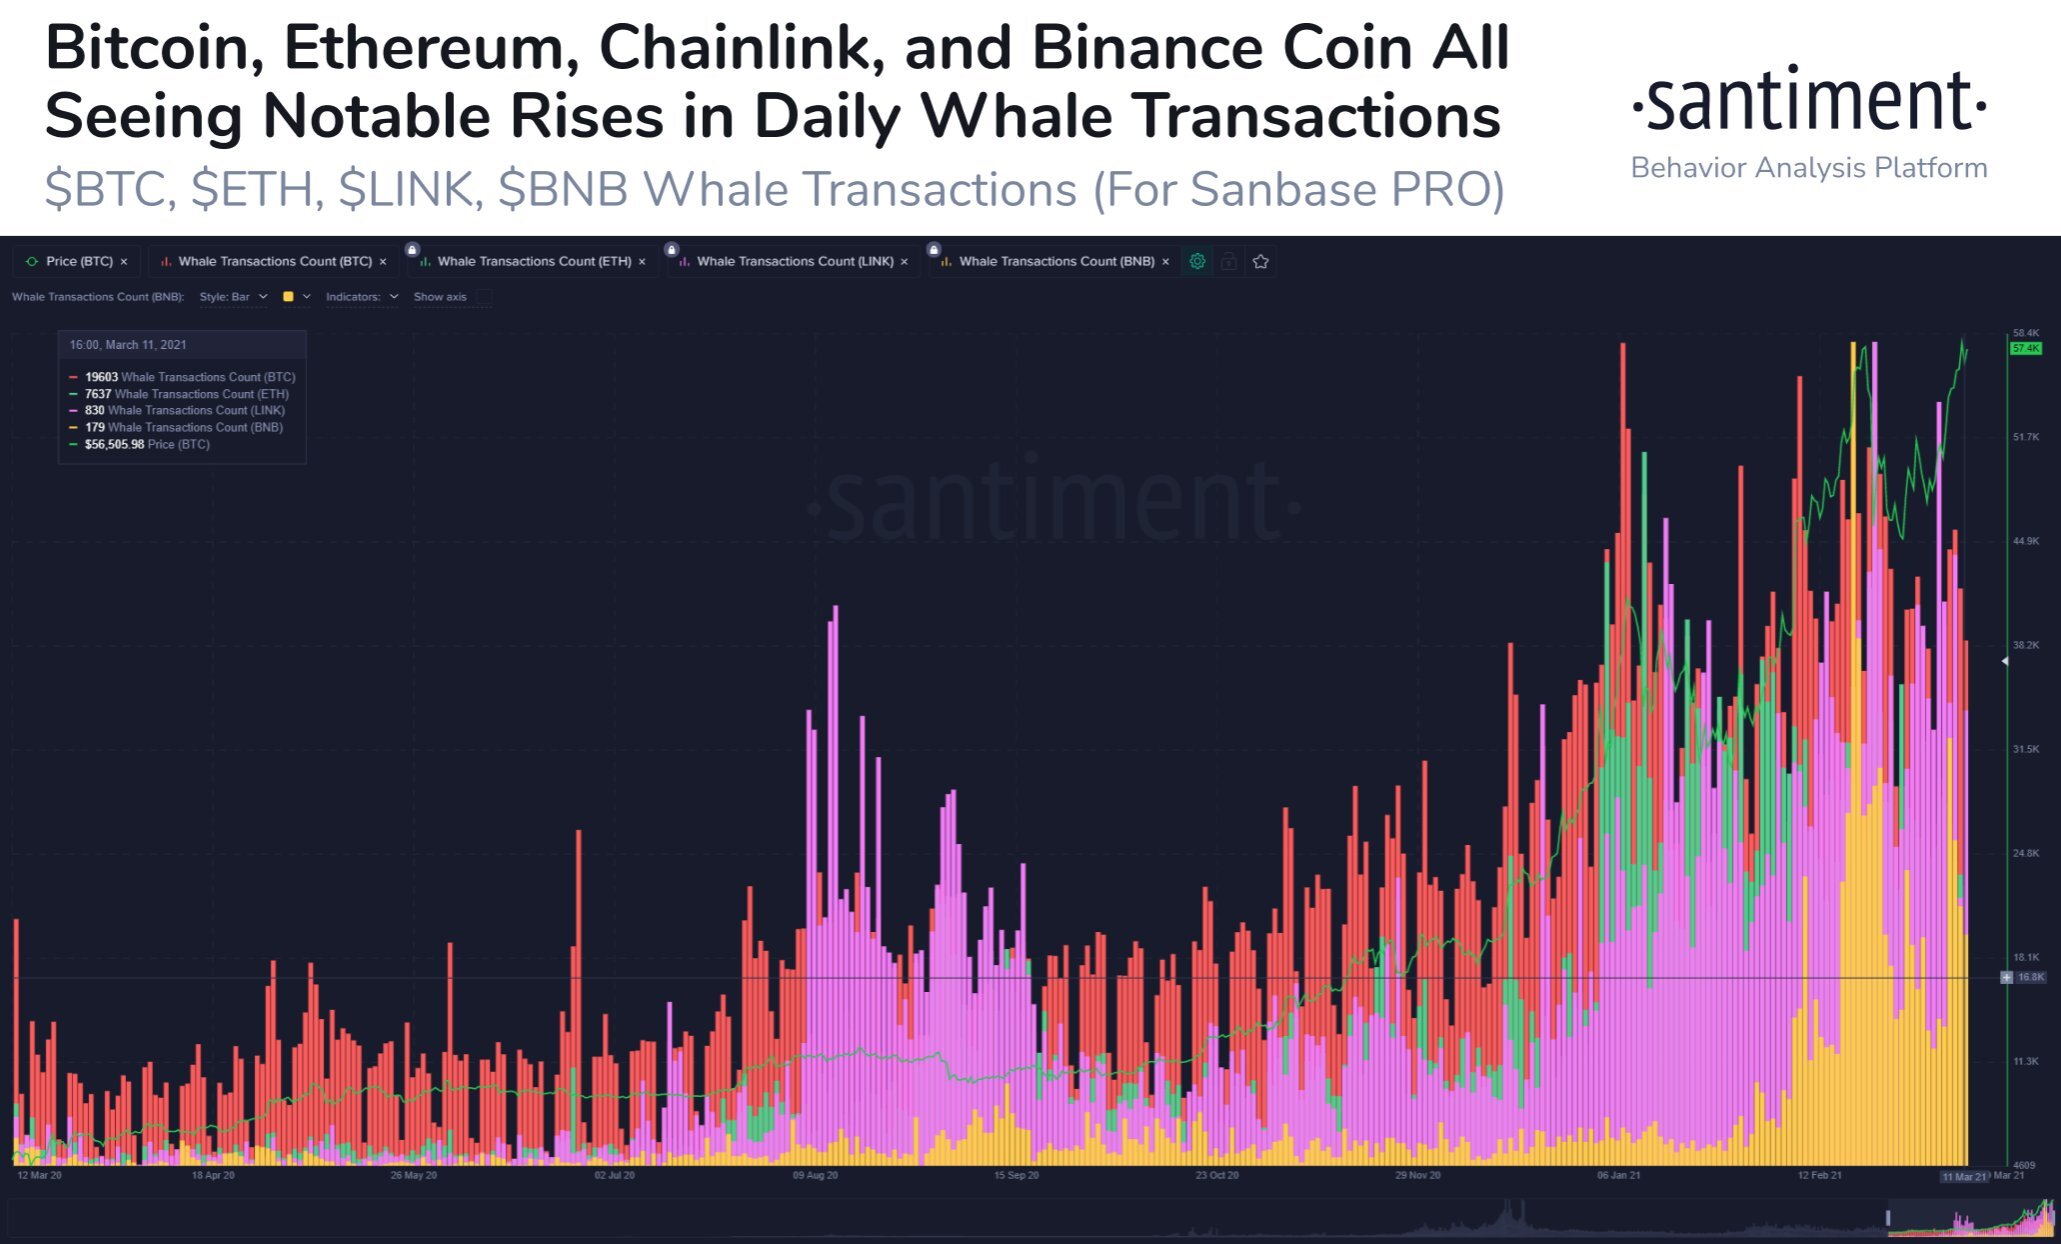
Further, Whale Transaction Counts have risen too, with the same highlighted by Santiment recently.

Source: Santiment
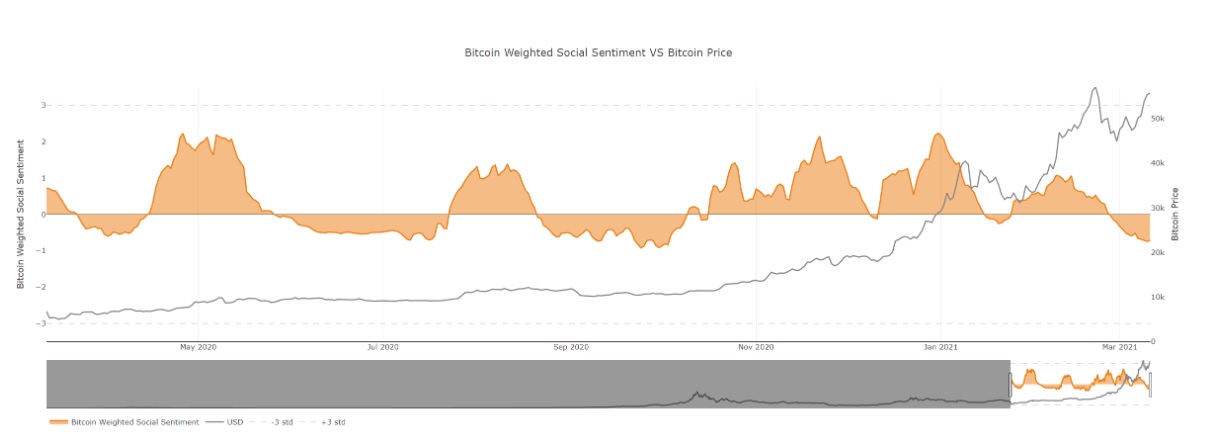
A few bearish signs can be seen here too, however. Consider Bitcoin’s Weighted Social Sentiment metric, for instance. Until a few hours ago, the same was at its lowest in 5 months, despite the asset’s price pushing and breaching its previous ATH of over $58,500.

Source: Santiment
In light of all these findings, what is clearly evident is that while the world’s largest cryptocurrency’s movement in the near-term has been primarily bullish (As evidenced by its price movement), a few bearish signs can be found on its charts. Ergo, a major movement in either direction would not be unexpected. Then again, this might be a discussion for naught. After all, we have seen recent instances where BTC has hiked, risen exponentially, unbacked by on-chain metrics. Perhaps, all it takes is a Twitter update these days.
Right now, the important question is this – How long before $100k falls?


