Bitcoin SV, Cosmos, Crypto.com Price Analysis: 26 December

The plummeting ETH/BTC pair was proof that Ethereum was unable to keep up with Bitcoin’s price rise on the charts. The altcoin market, as a whole, recovered somewhat after the dramatic drop before Christmas, but it began to shed value once more soon after. Bitcoin SV registered a hidden bearish divergence and could be driven to seek support around the $152-level, while Cosmos’ bulls attempted to defend the $4.8-level of support in the face of increasing selling volume. Crypto.com Coin was also heading lower on the charts.
Bitcoin SV [BSV]
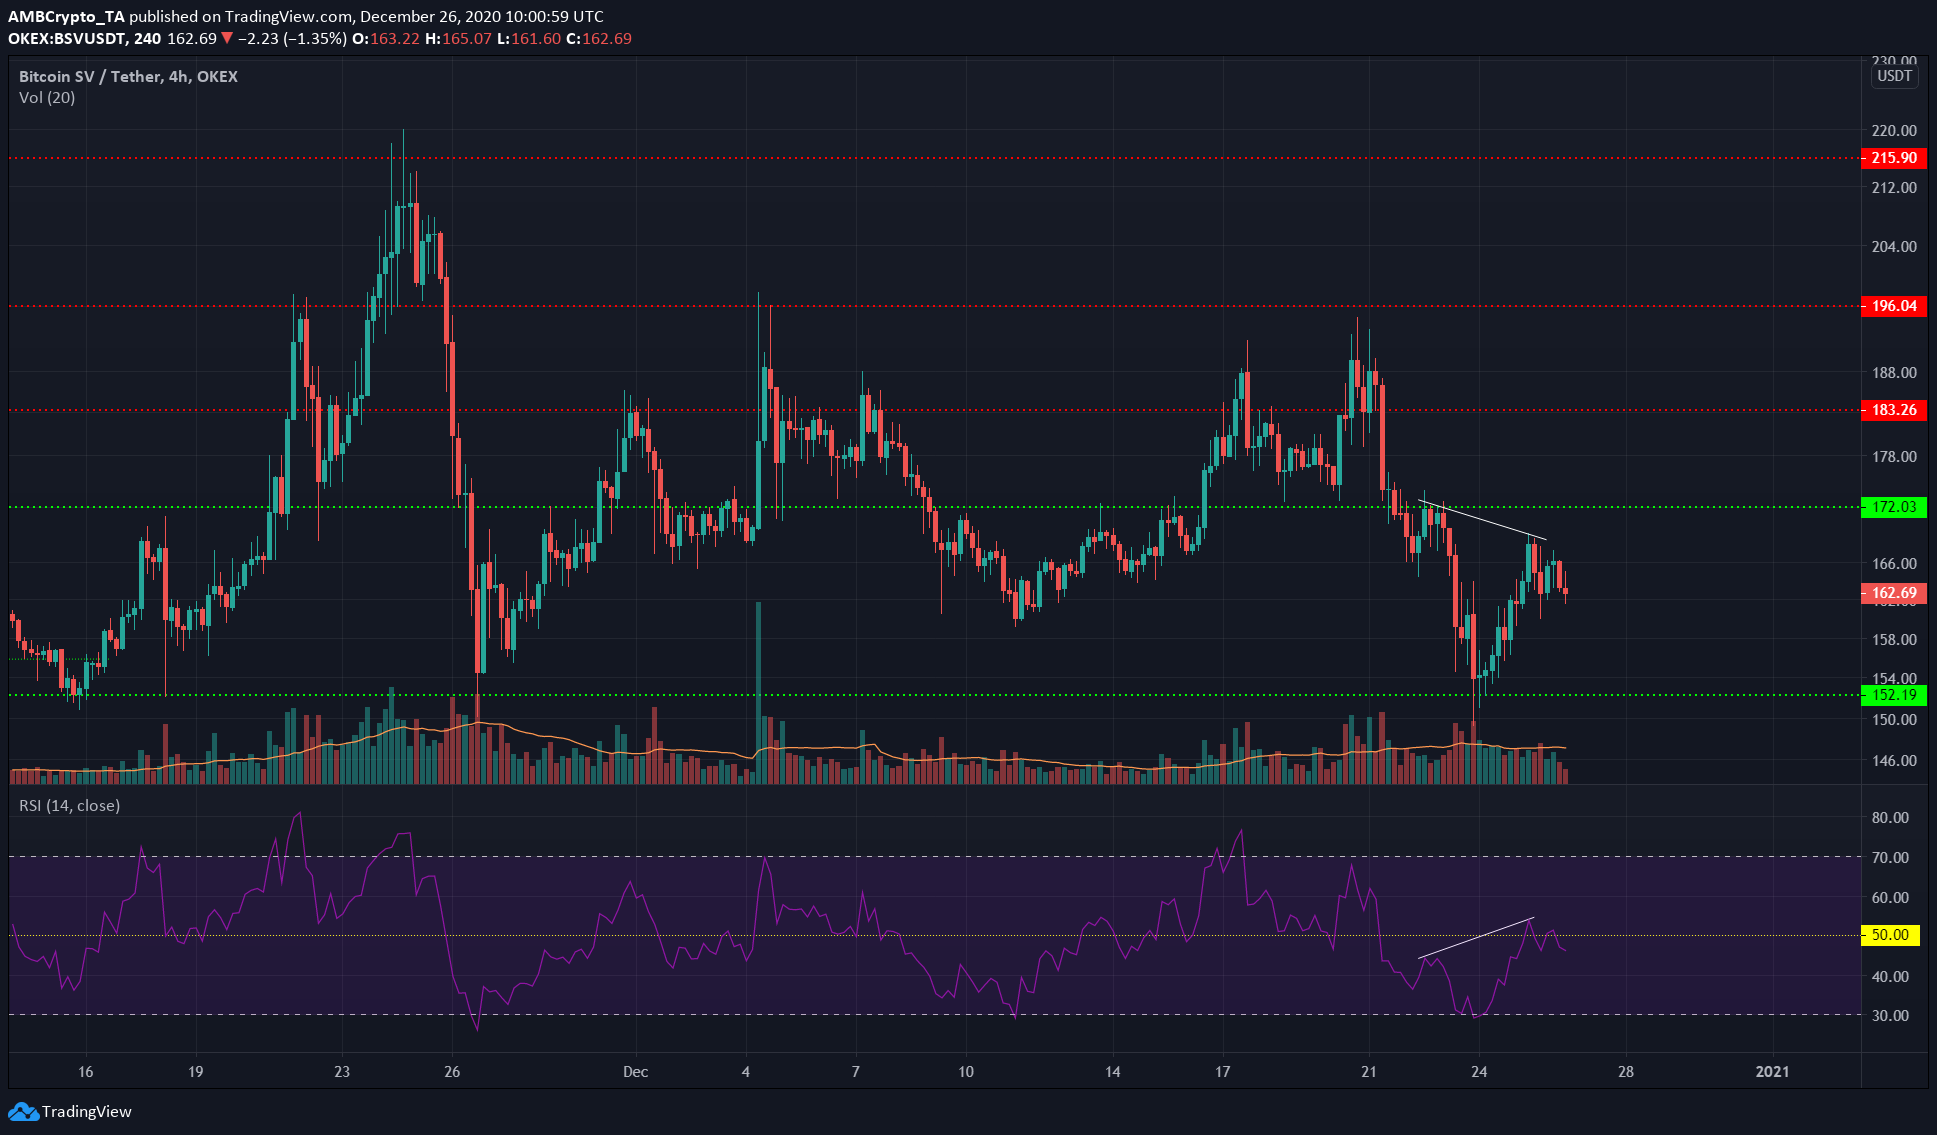
Bitcoin SV exhibited a hidden bearish divergence, one where the price formed a lower high even as the momentum indicator (RSI) formed a higher high.
The RSI retested the 50-mark as resistance and stayed under the same to indicate that a bearish trend was in play in the short-term. Combined with the hidden divergence, it was likely that the price was heading back toward the $152-level of support.
Cosmos [ATOM]
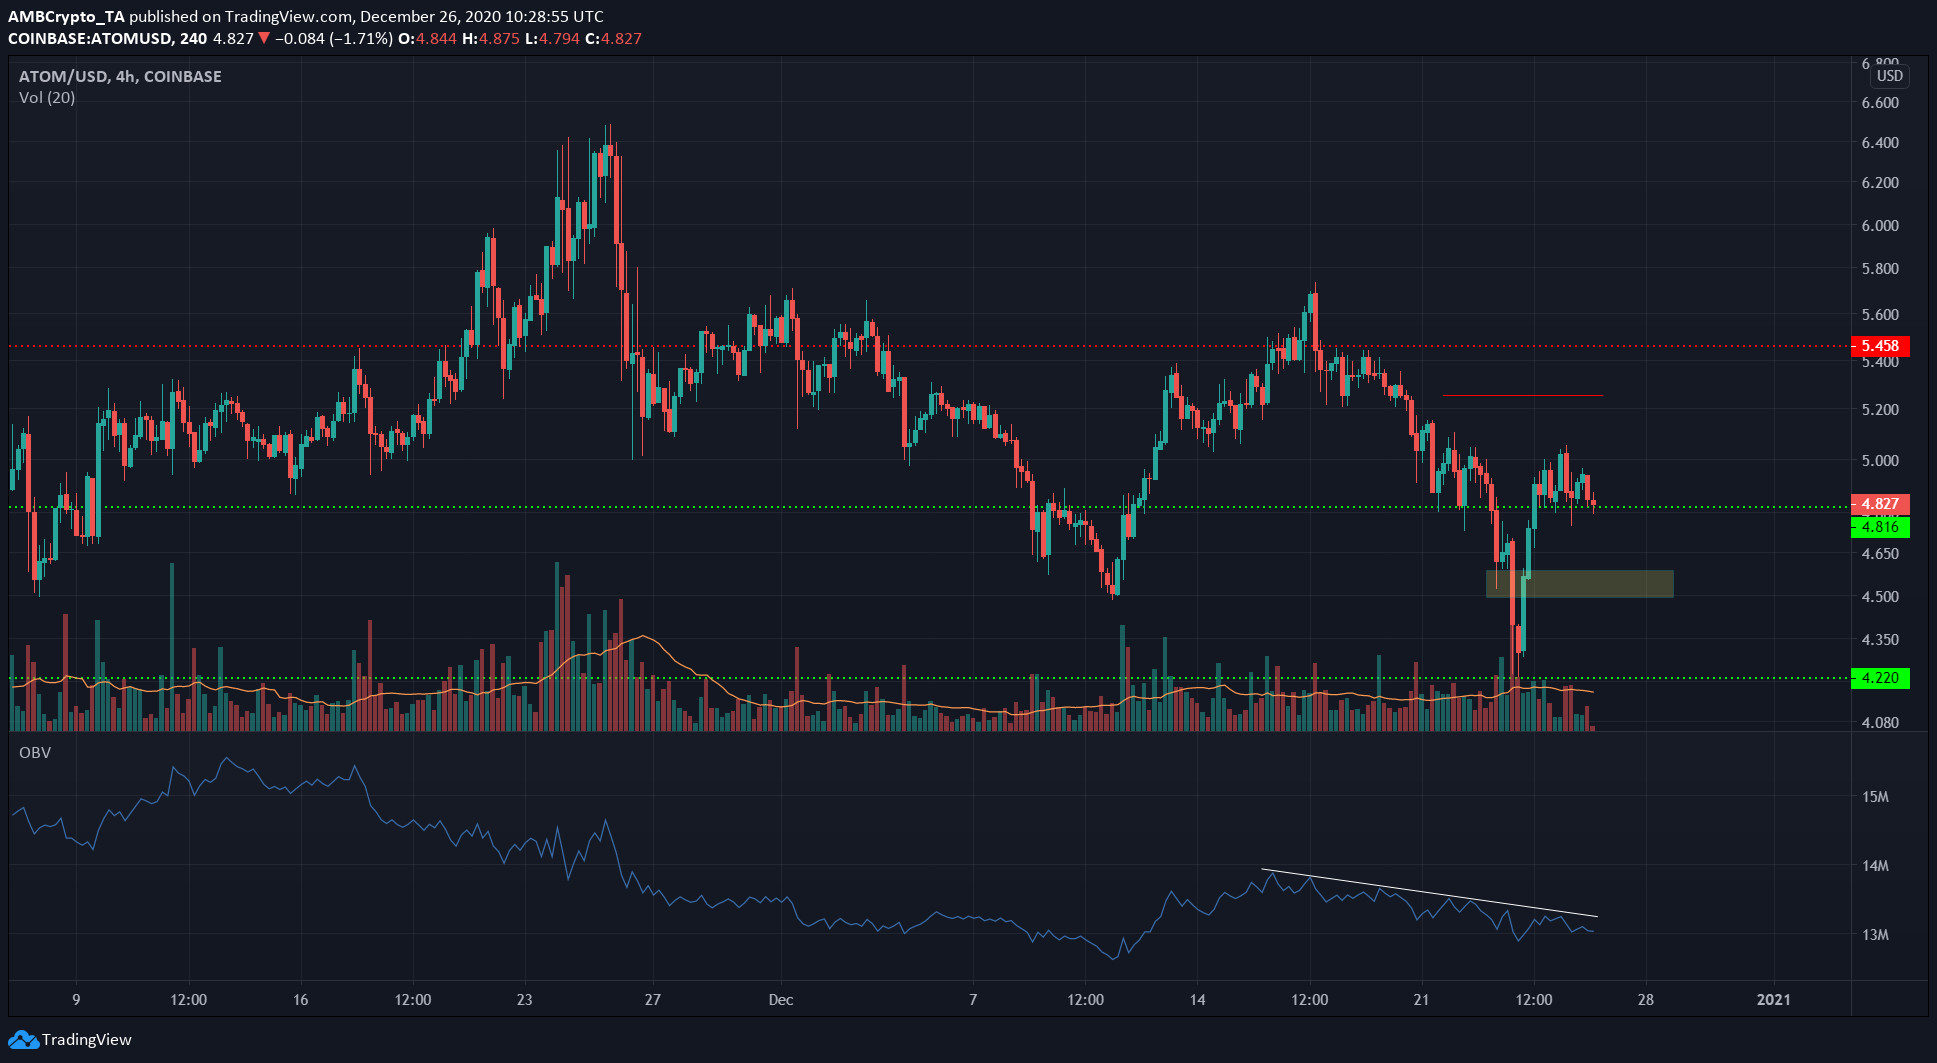
ATOM’s price dropped like a stone past the $4.5-mark and climbed back above it hours later after the latest drop saw ATOM visit $4.2.
At the time of writing, ATOM was in a period of consolidation above the $4.8-level of support.
The OBV was on a downtrend as it noted that the selling volume was greater than the buying volume for the most part since mid-November, even though the price had surged to $6.4 in late-November, before descending.
Over the next couple of days, the price levels of $4.8 and $4.5 will be important for the market bulls to defend against selling pressure.
Crypto.com Coin [CRO]
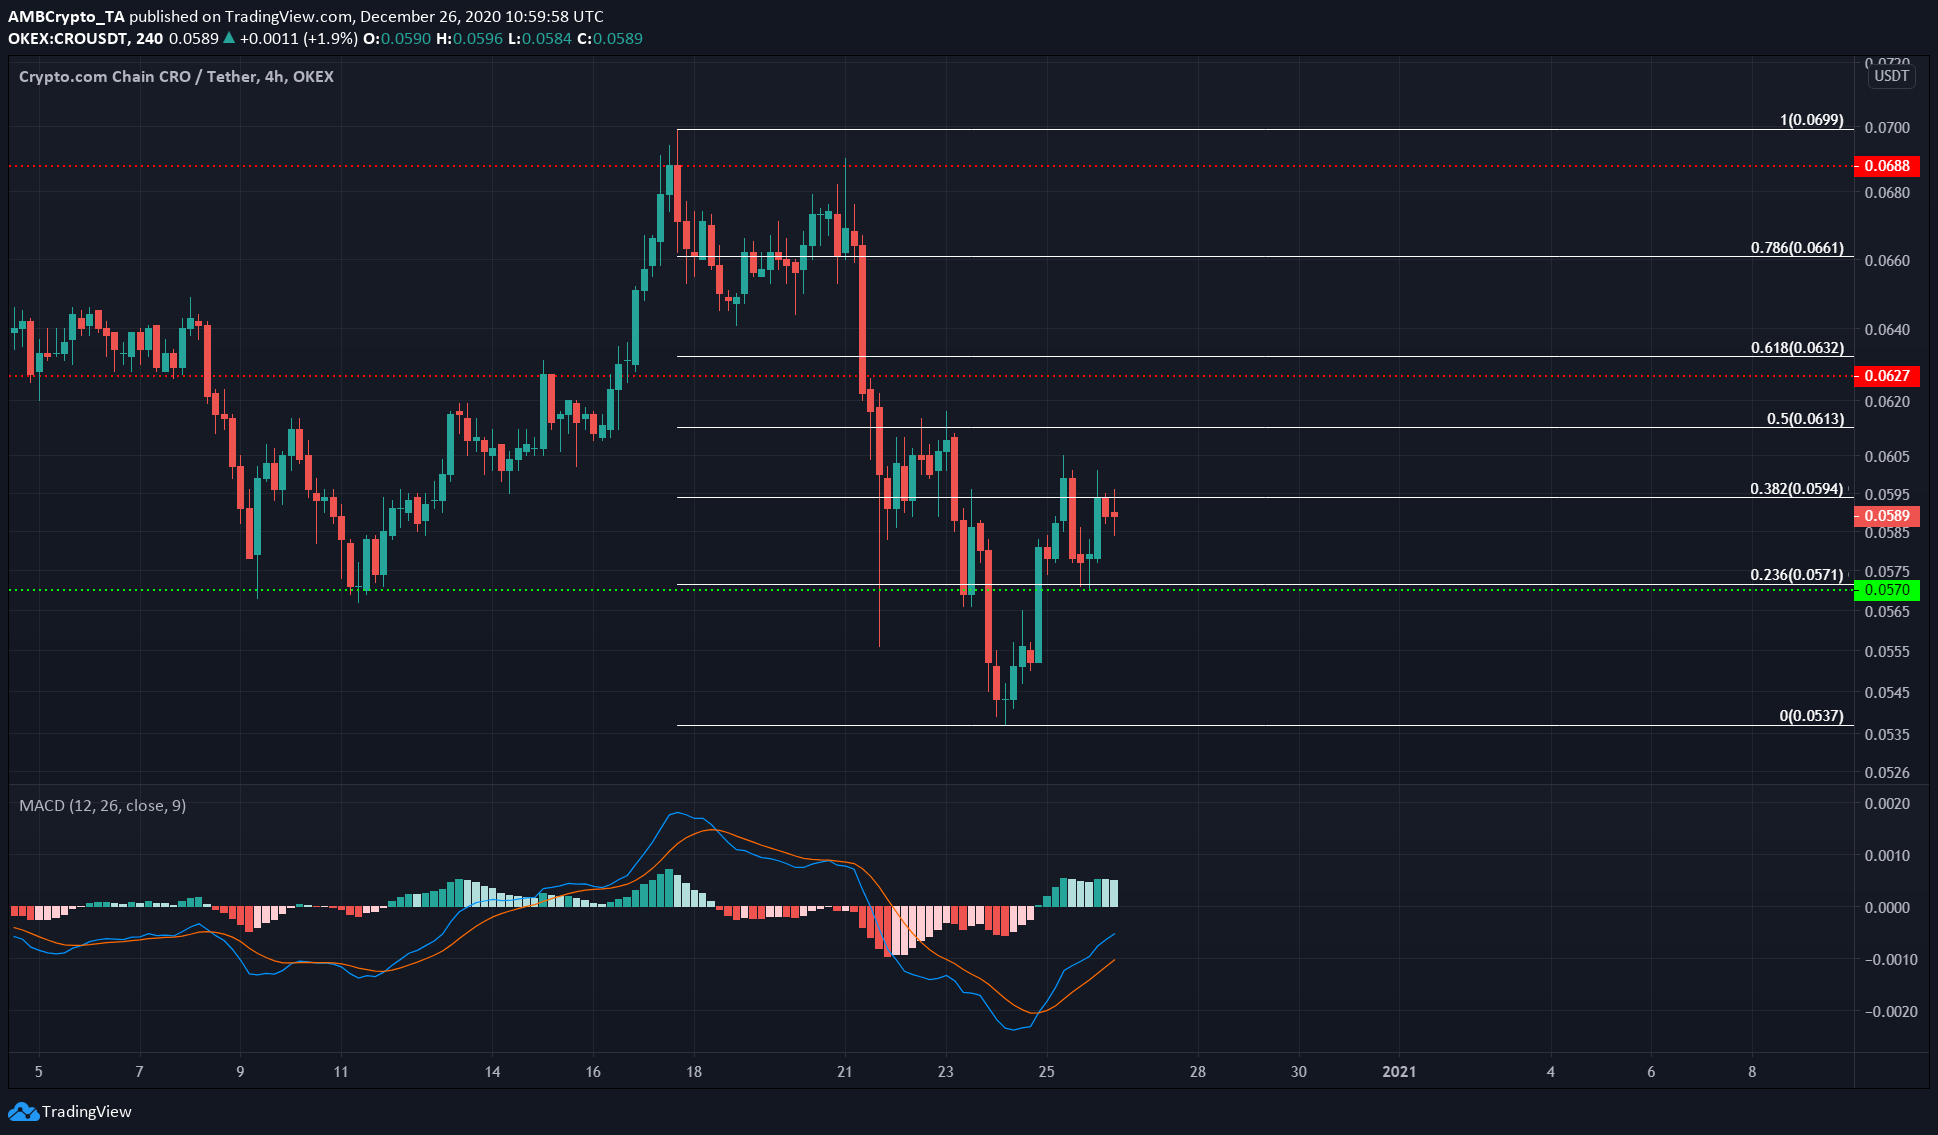
Using the swing high and swing low for CRO’s recent drop, the Fibonacci Retracement tool was used to highlight some important levels of support and resistance for CRO.
Due to the gains posted since the dip to $0.0537, the MACD formed a bullish crossover to signal short-term bullish momentum, but this was a weak signal at best. The prior trend was overwhelmingly in favor of the bears.
CRO was unable to ascend above the 50% level at $0.0613, asserting the position of strength the bears occupied. This would remain unchanged until the price can rise past the same level.