Bitcoin’s price crashes below $58,000 – Which way will BTC go now?

- Prudent Bitcoin traders might want to stay sidelined instead of bidding.
- A drop below the local low could send prices careening lower by close to 15%.
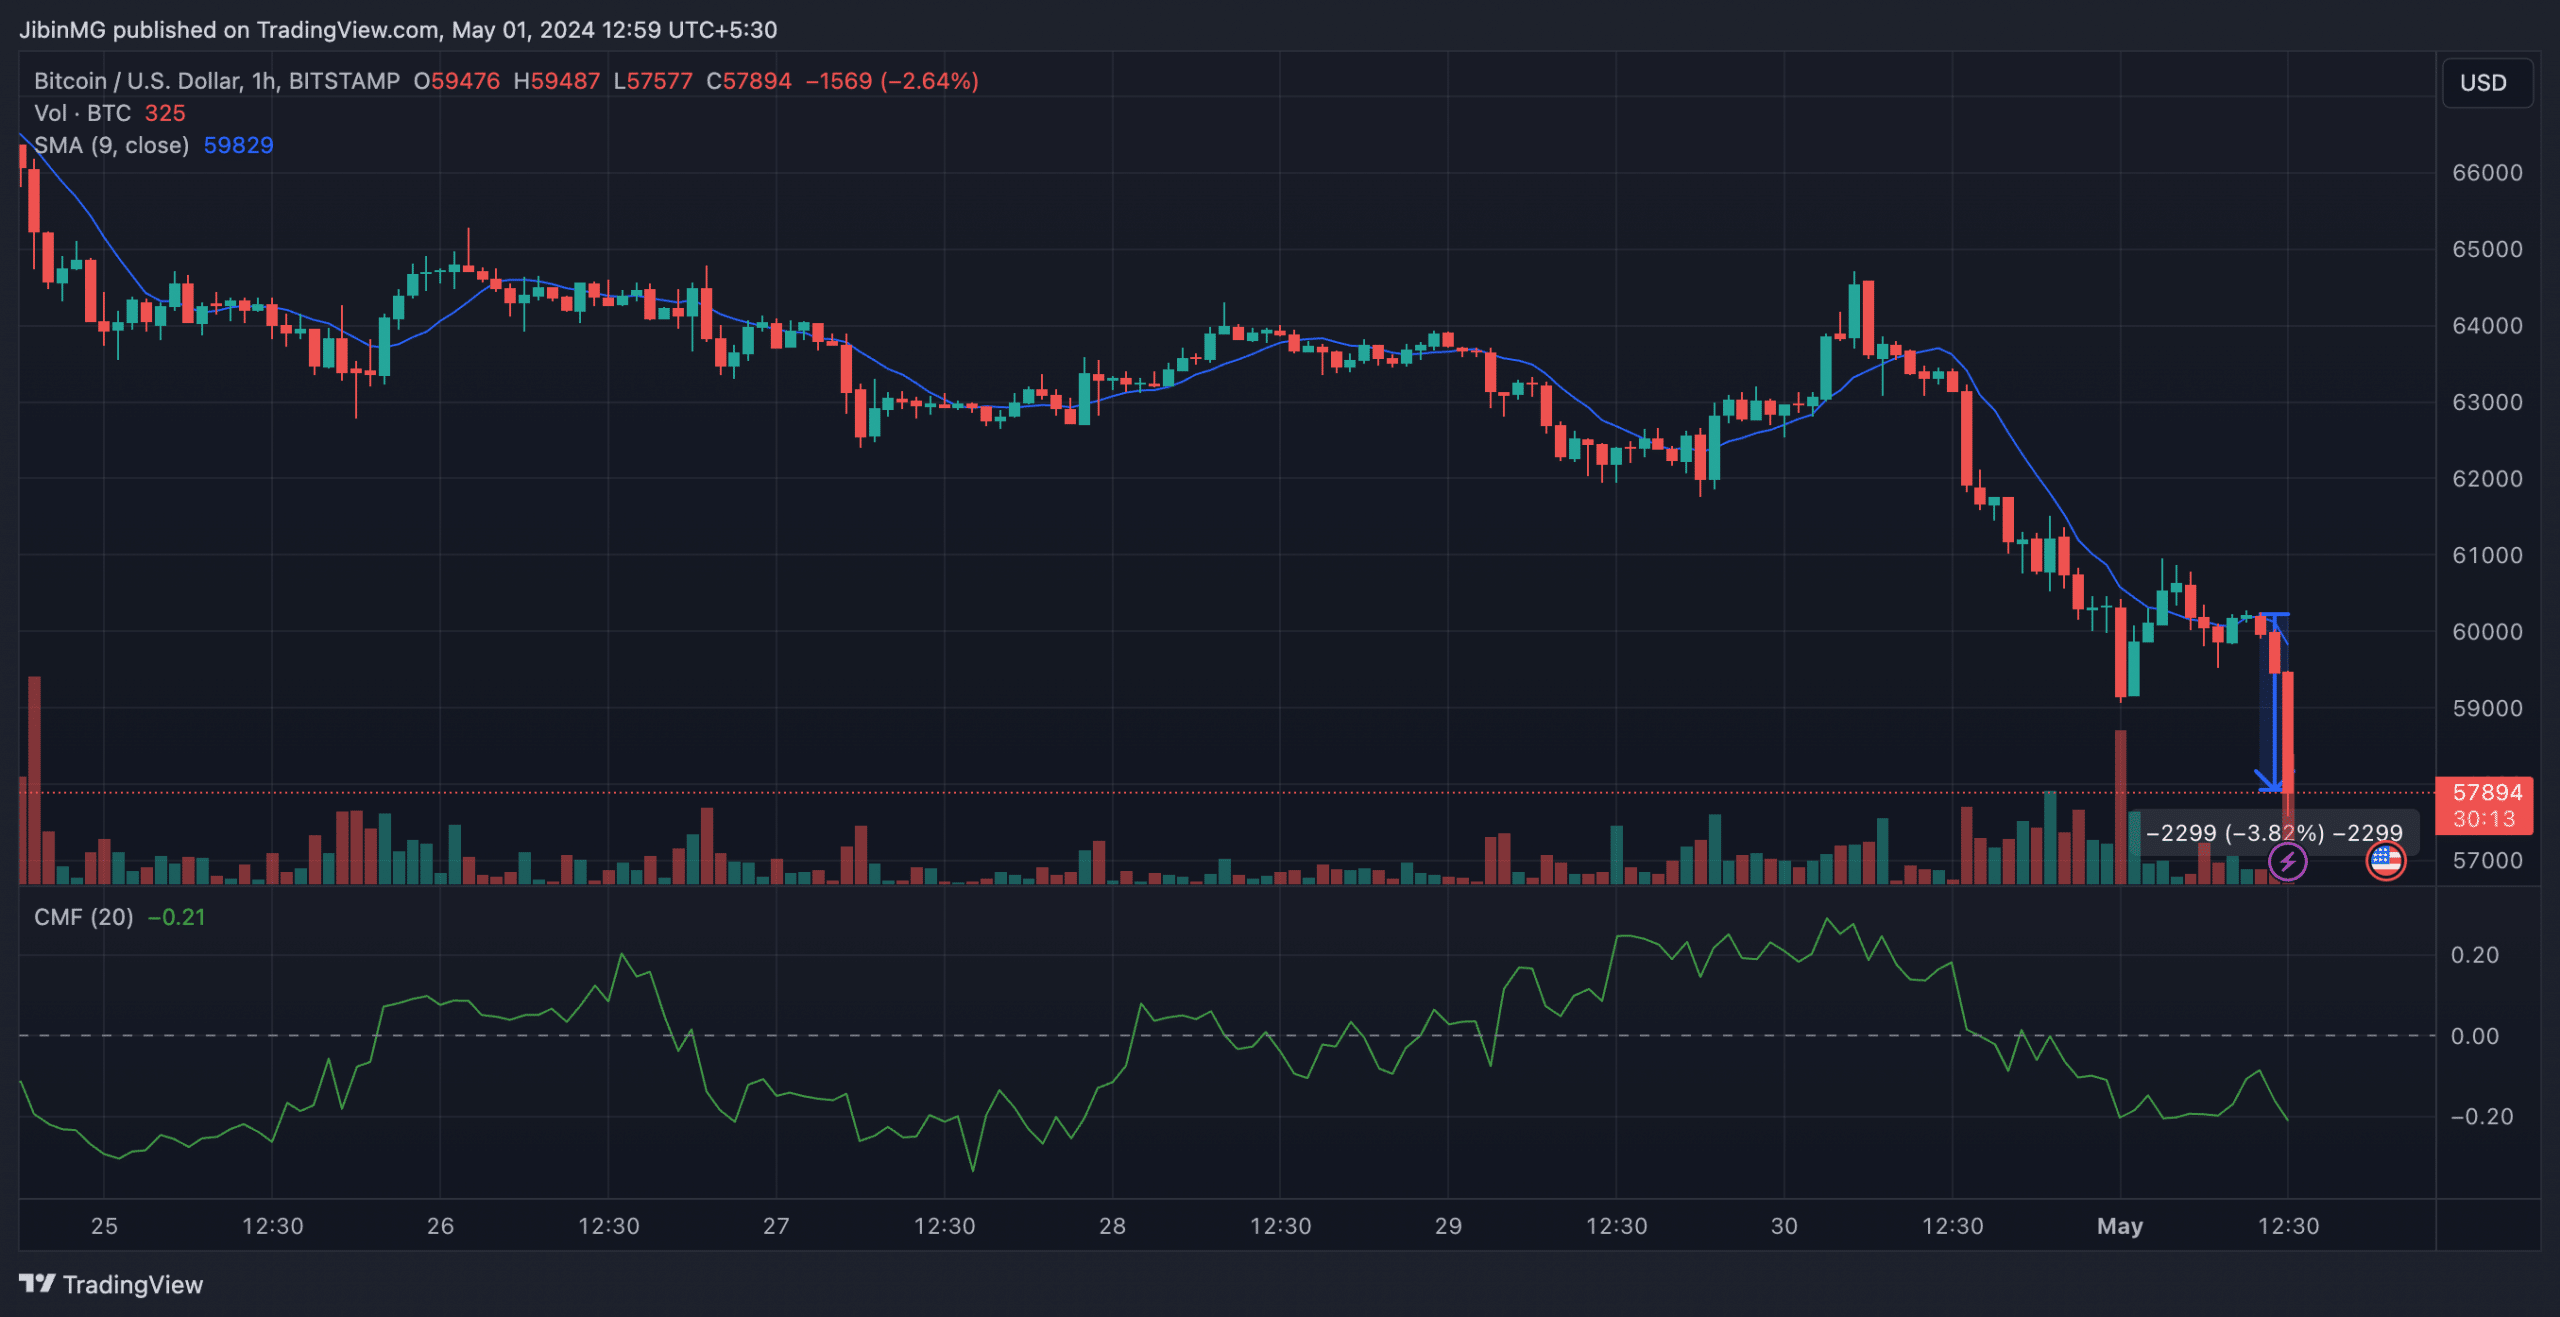
Bitcoin [BTC] crashed by almost 10% from the local high it set earlier on 30 April. At press time, it was trading just below $58k, well outside the previous demand zone of $59.2k-$61k.
Here, it’s worth pointing out that BTC crashed by over 3.5% in the last 1 hour alone.
Source: BTC/USD, TradingView
However, according to crypto-analyst Rekt Capital, Bitcoin is not yet out of the danger zone.
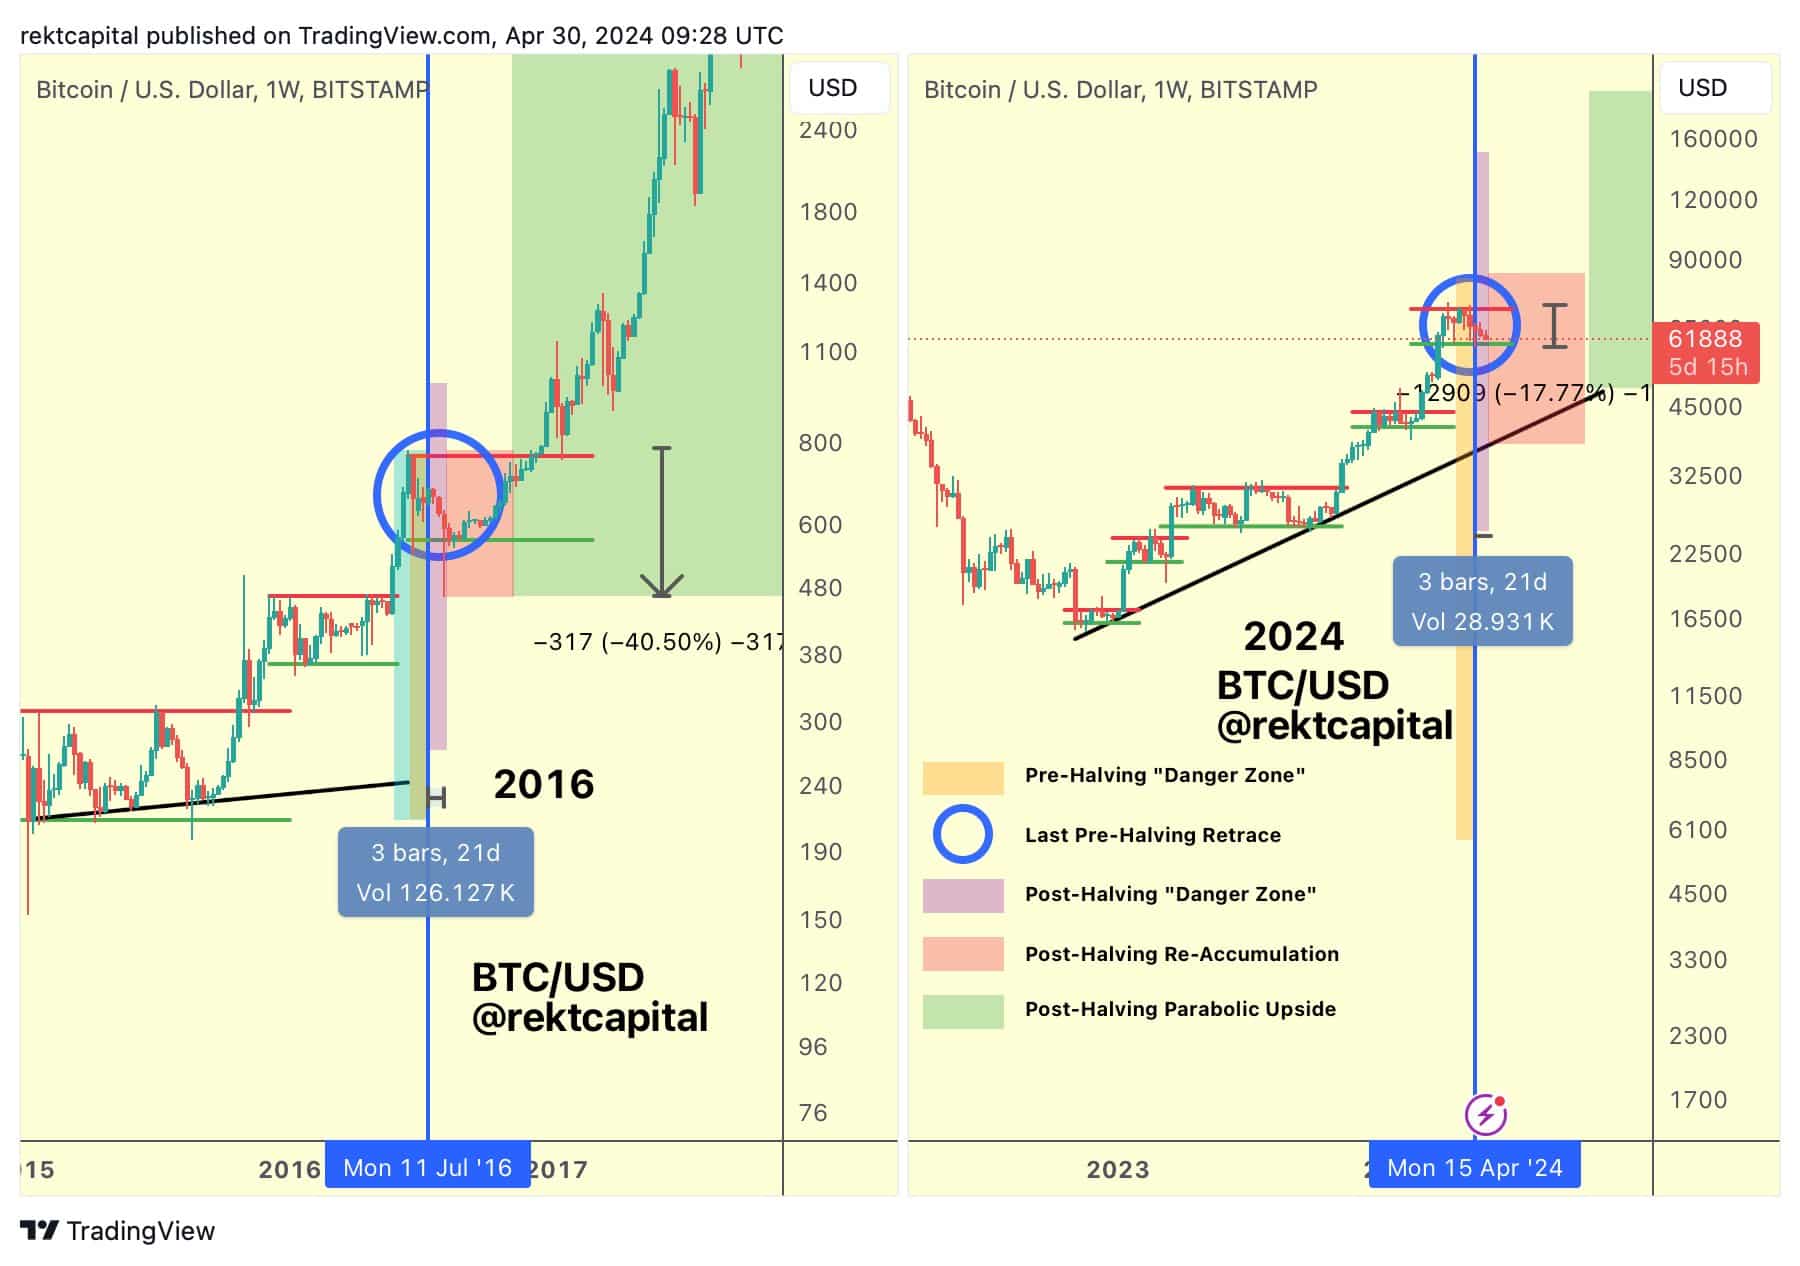
The analyst compared the current Bitcoin price movement with what happened in the 2020 and 2016 cycles, right after the halving. While history might not repeat exactly, it certainly does rhyme.
Are we close to the bottom?
Source: RektCapital on X
The 2024 price action after the halving more closely resembled 2016 than 2020, asserted RektCapital. Back then, an 11% wick downward came 21 days after the halving.
If the same were to repeat, we could expect BTC prices to plunge to $52k.
The $60k region has been a technically sound support zone in the past two months. However, each retest of the support weakens it. This might be the wave that breaches it.
Until it does, buyers could look to buy the dip.
The tightrope is tough to walk, and most traders might prefer staying on the sidelines to wait for a positive reaction, or a drop below the $59k mark to go short.
Source: Coinalyze
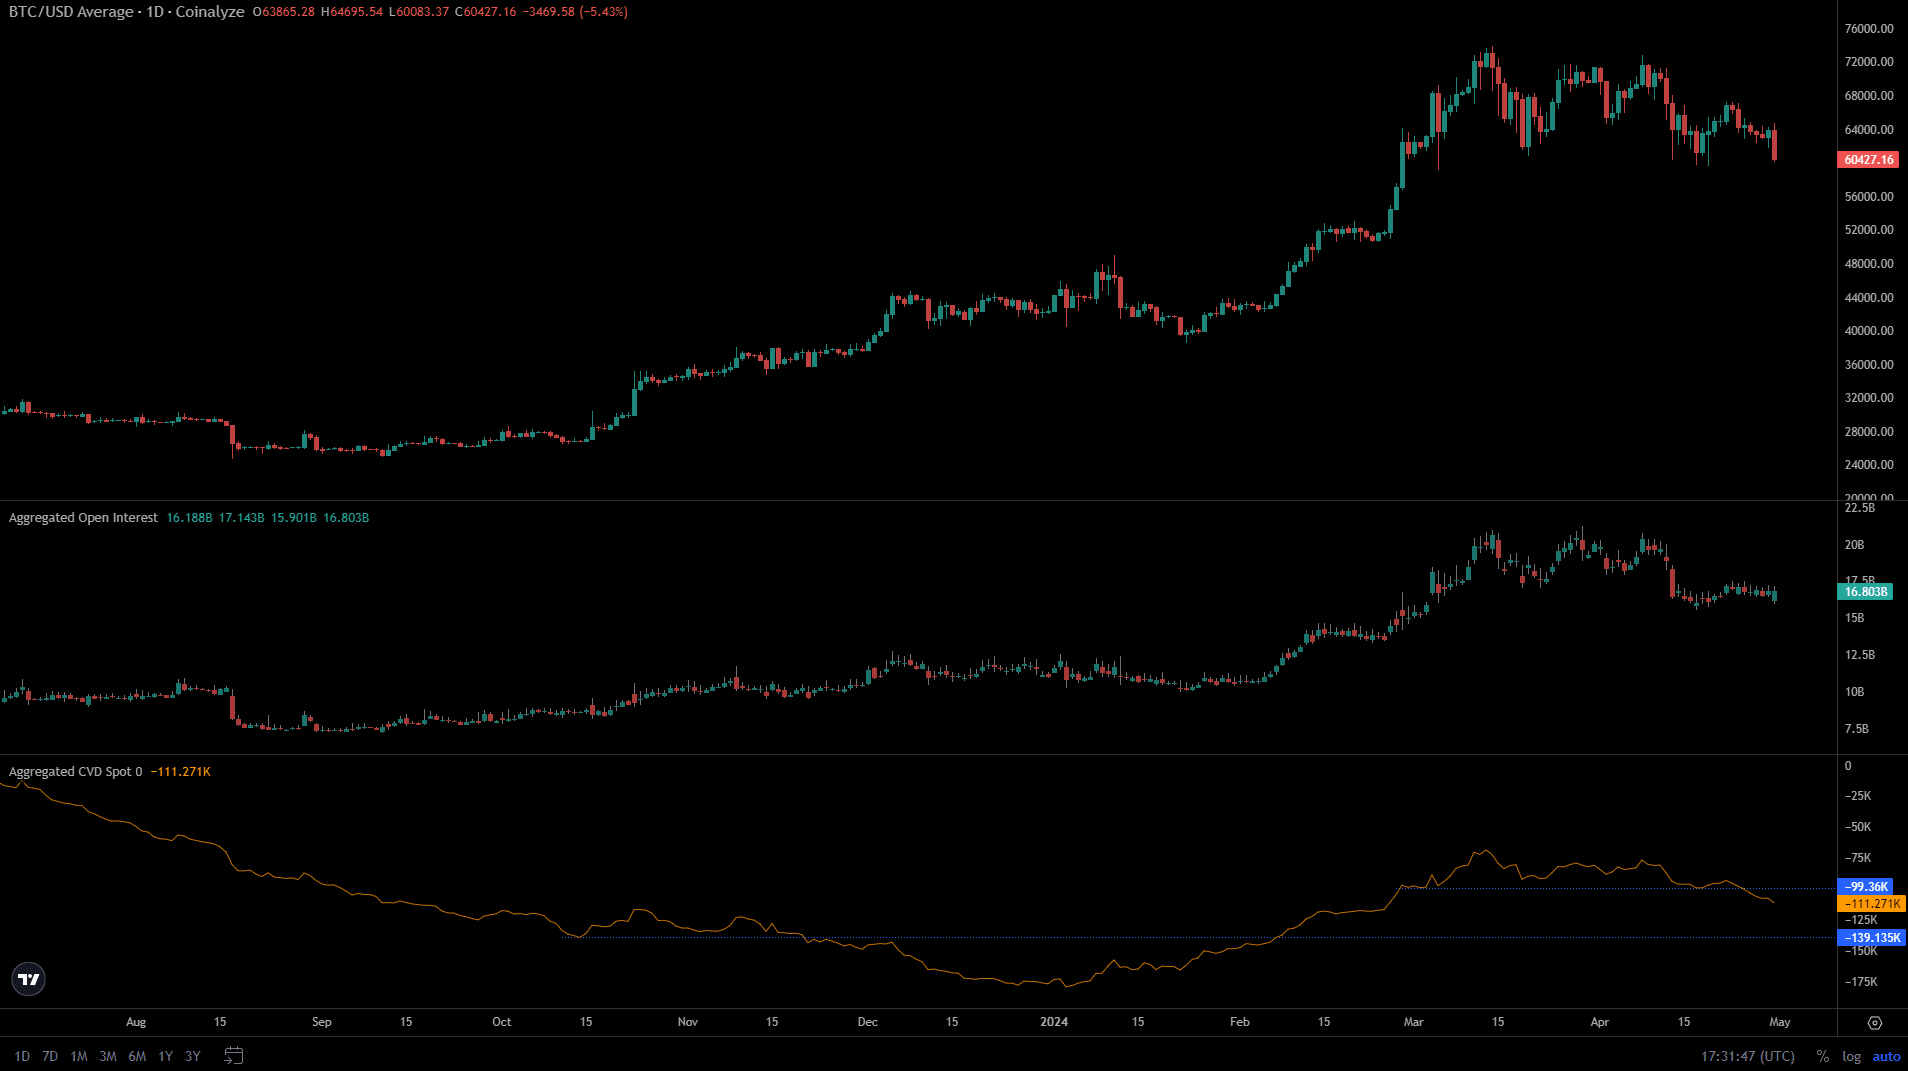
The spot CVD gave investors a reason to be worried. It has been in a downtrend since mid-March and broke beneath a support level that stretched back to late February.
This confirmed the bearish strength on the HTF, and reduced the chances of another bounce from the $60k demand zone. The Open Interest was also in decline and outlined bearish sentiment.
Here’s why this retracement is healthy in the long run
Source: CryptoQuant
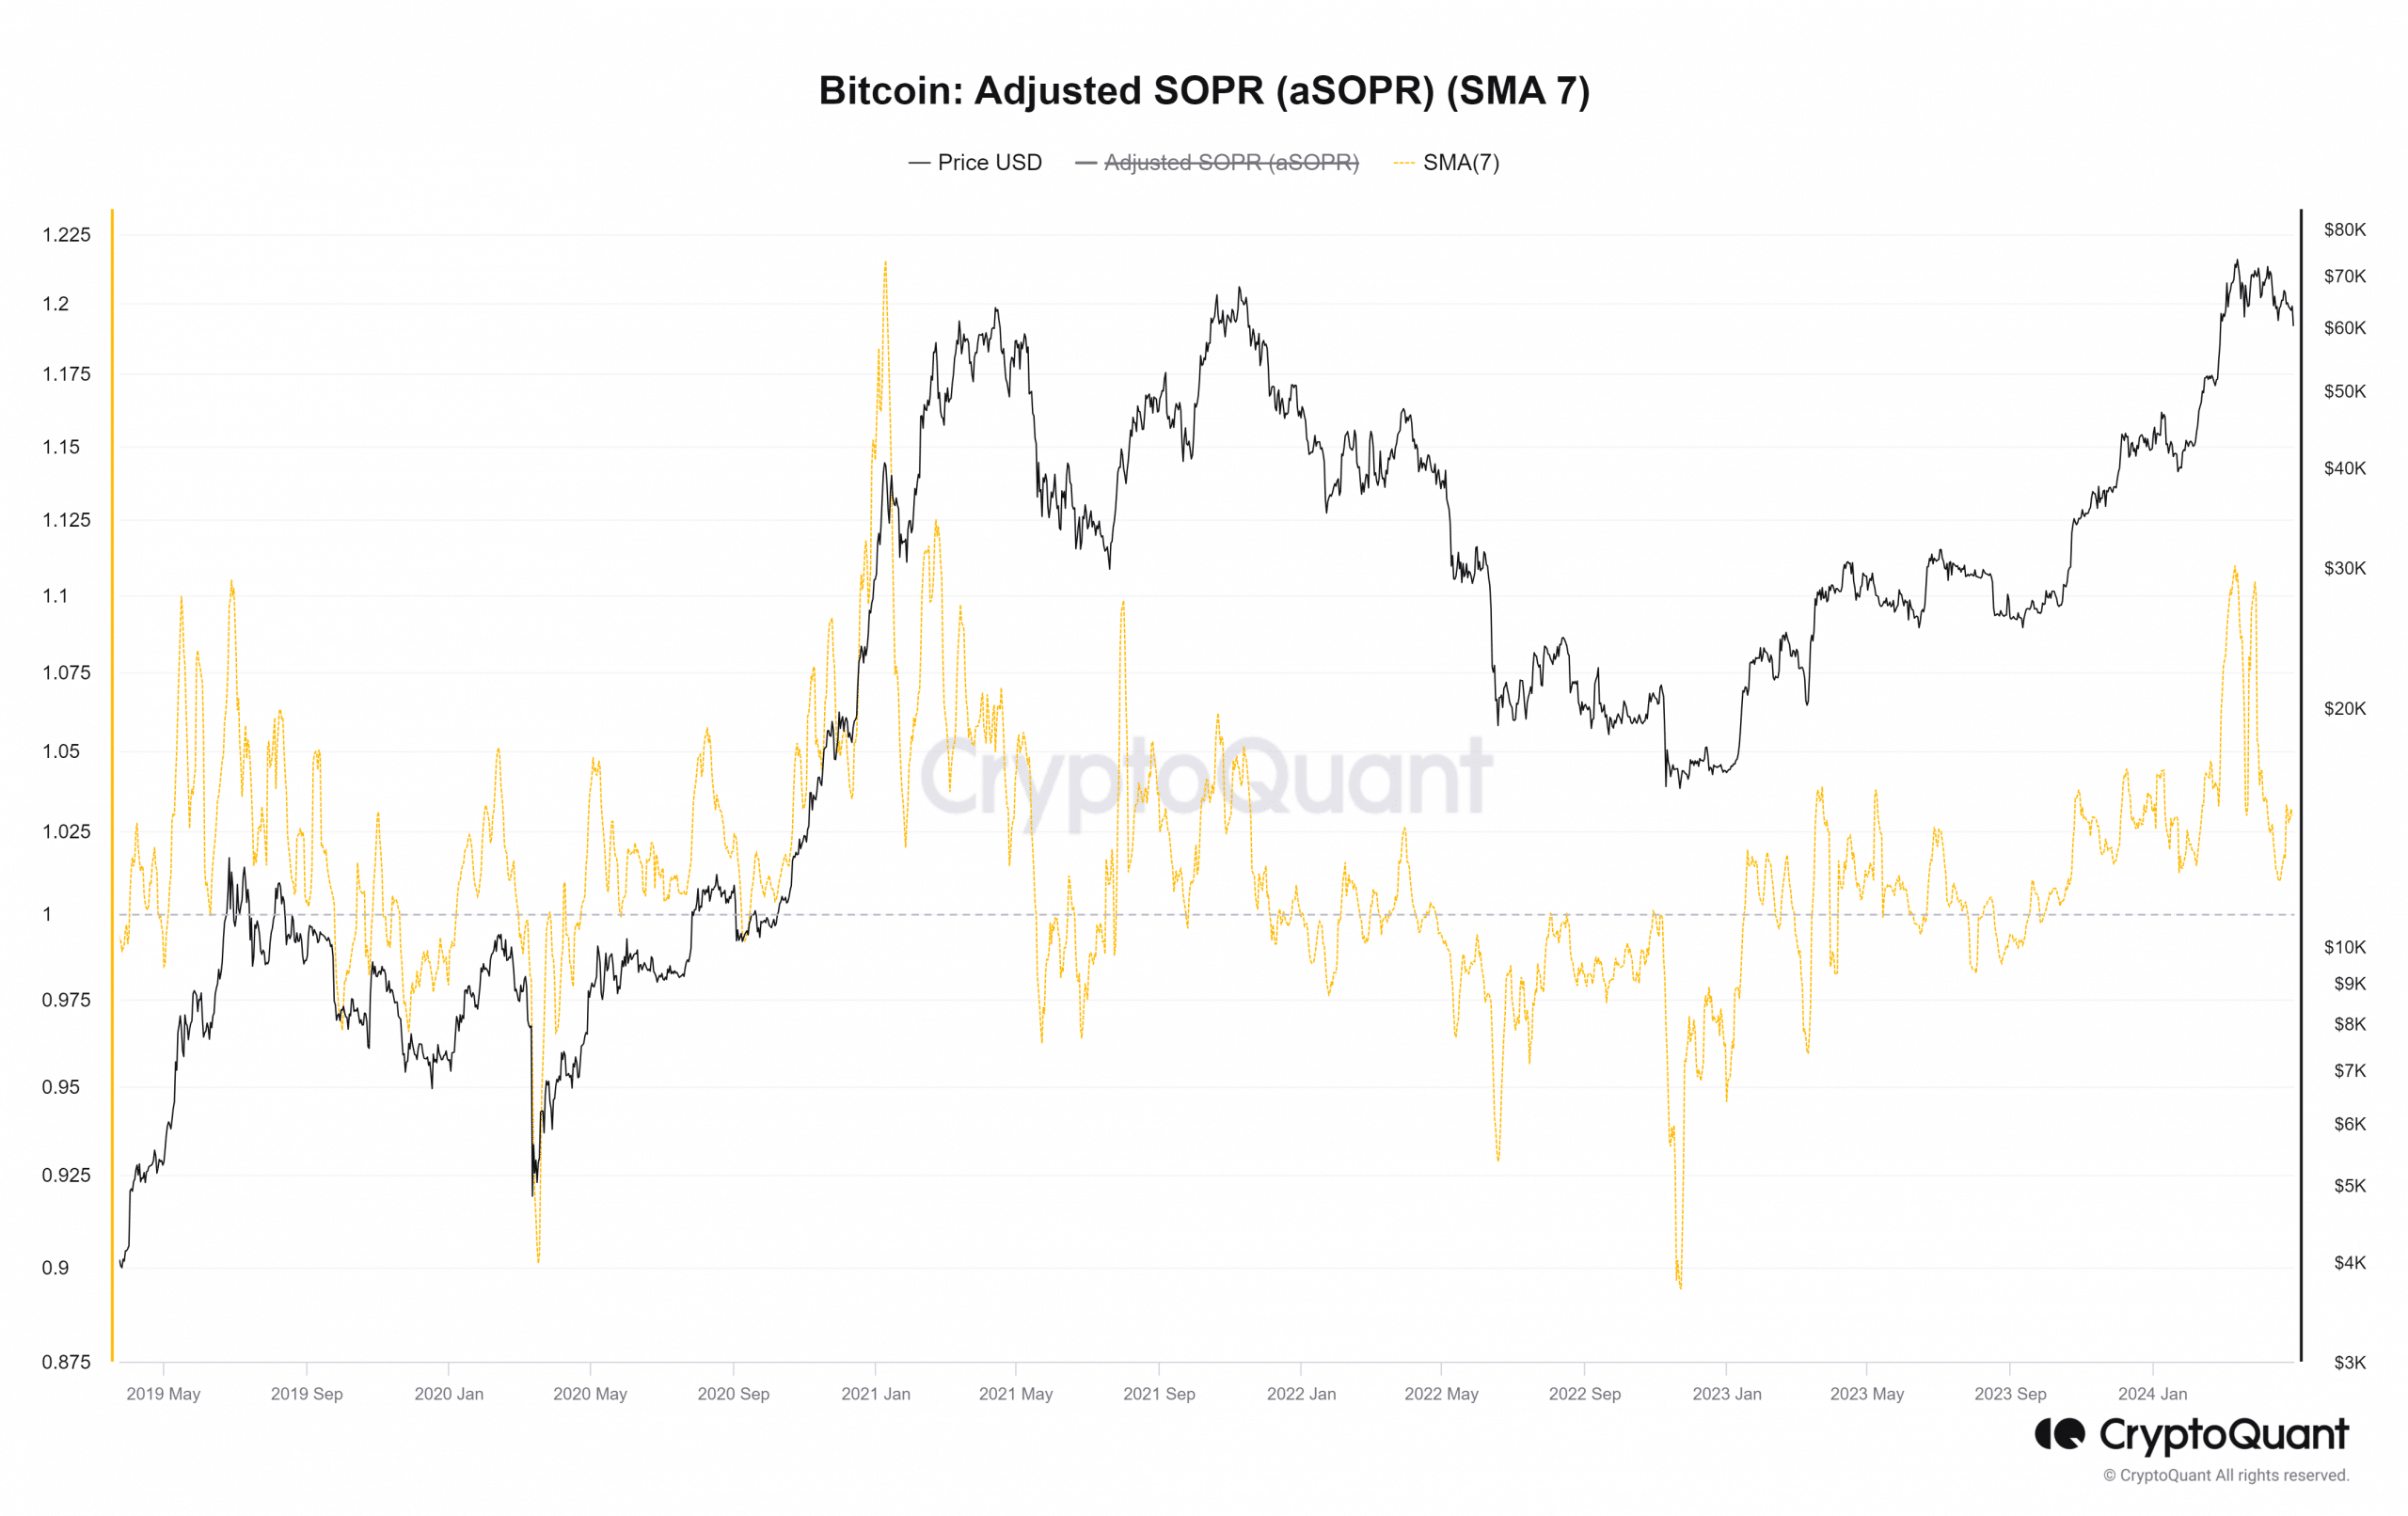
The adjusted spent output profit ratio (aSOPR) saw a massive upward move to 1.1 a month ago but has fallen to 1.029 at press time. In May and August 2020, a similar scenario played out.
Once the overeager bulls were forced to deleverage, the market saw a more sustainable rally, supported by spot demand.
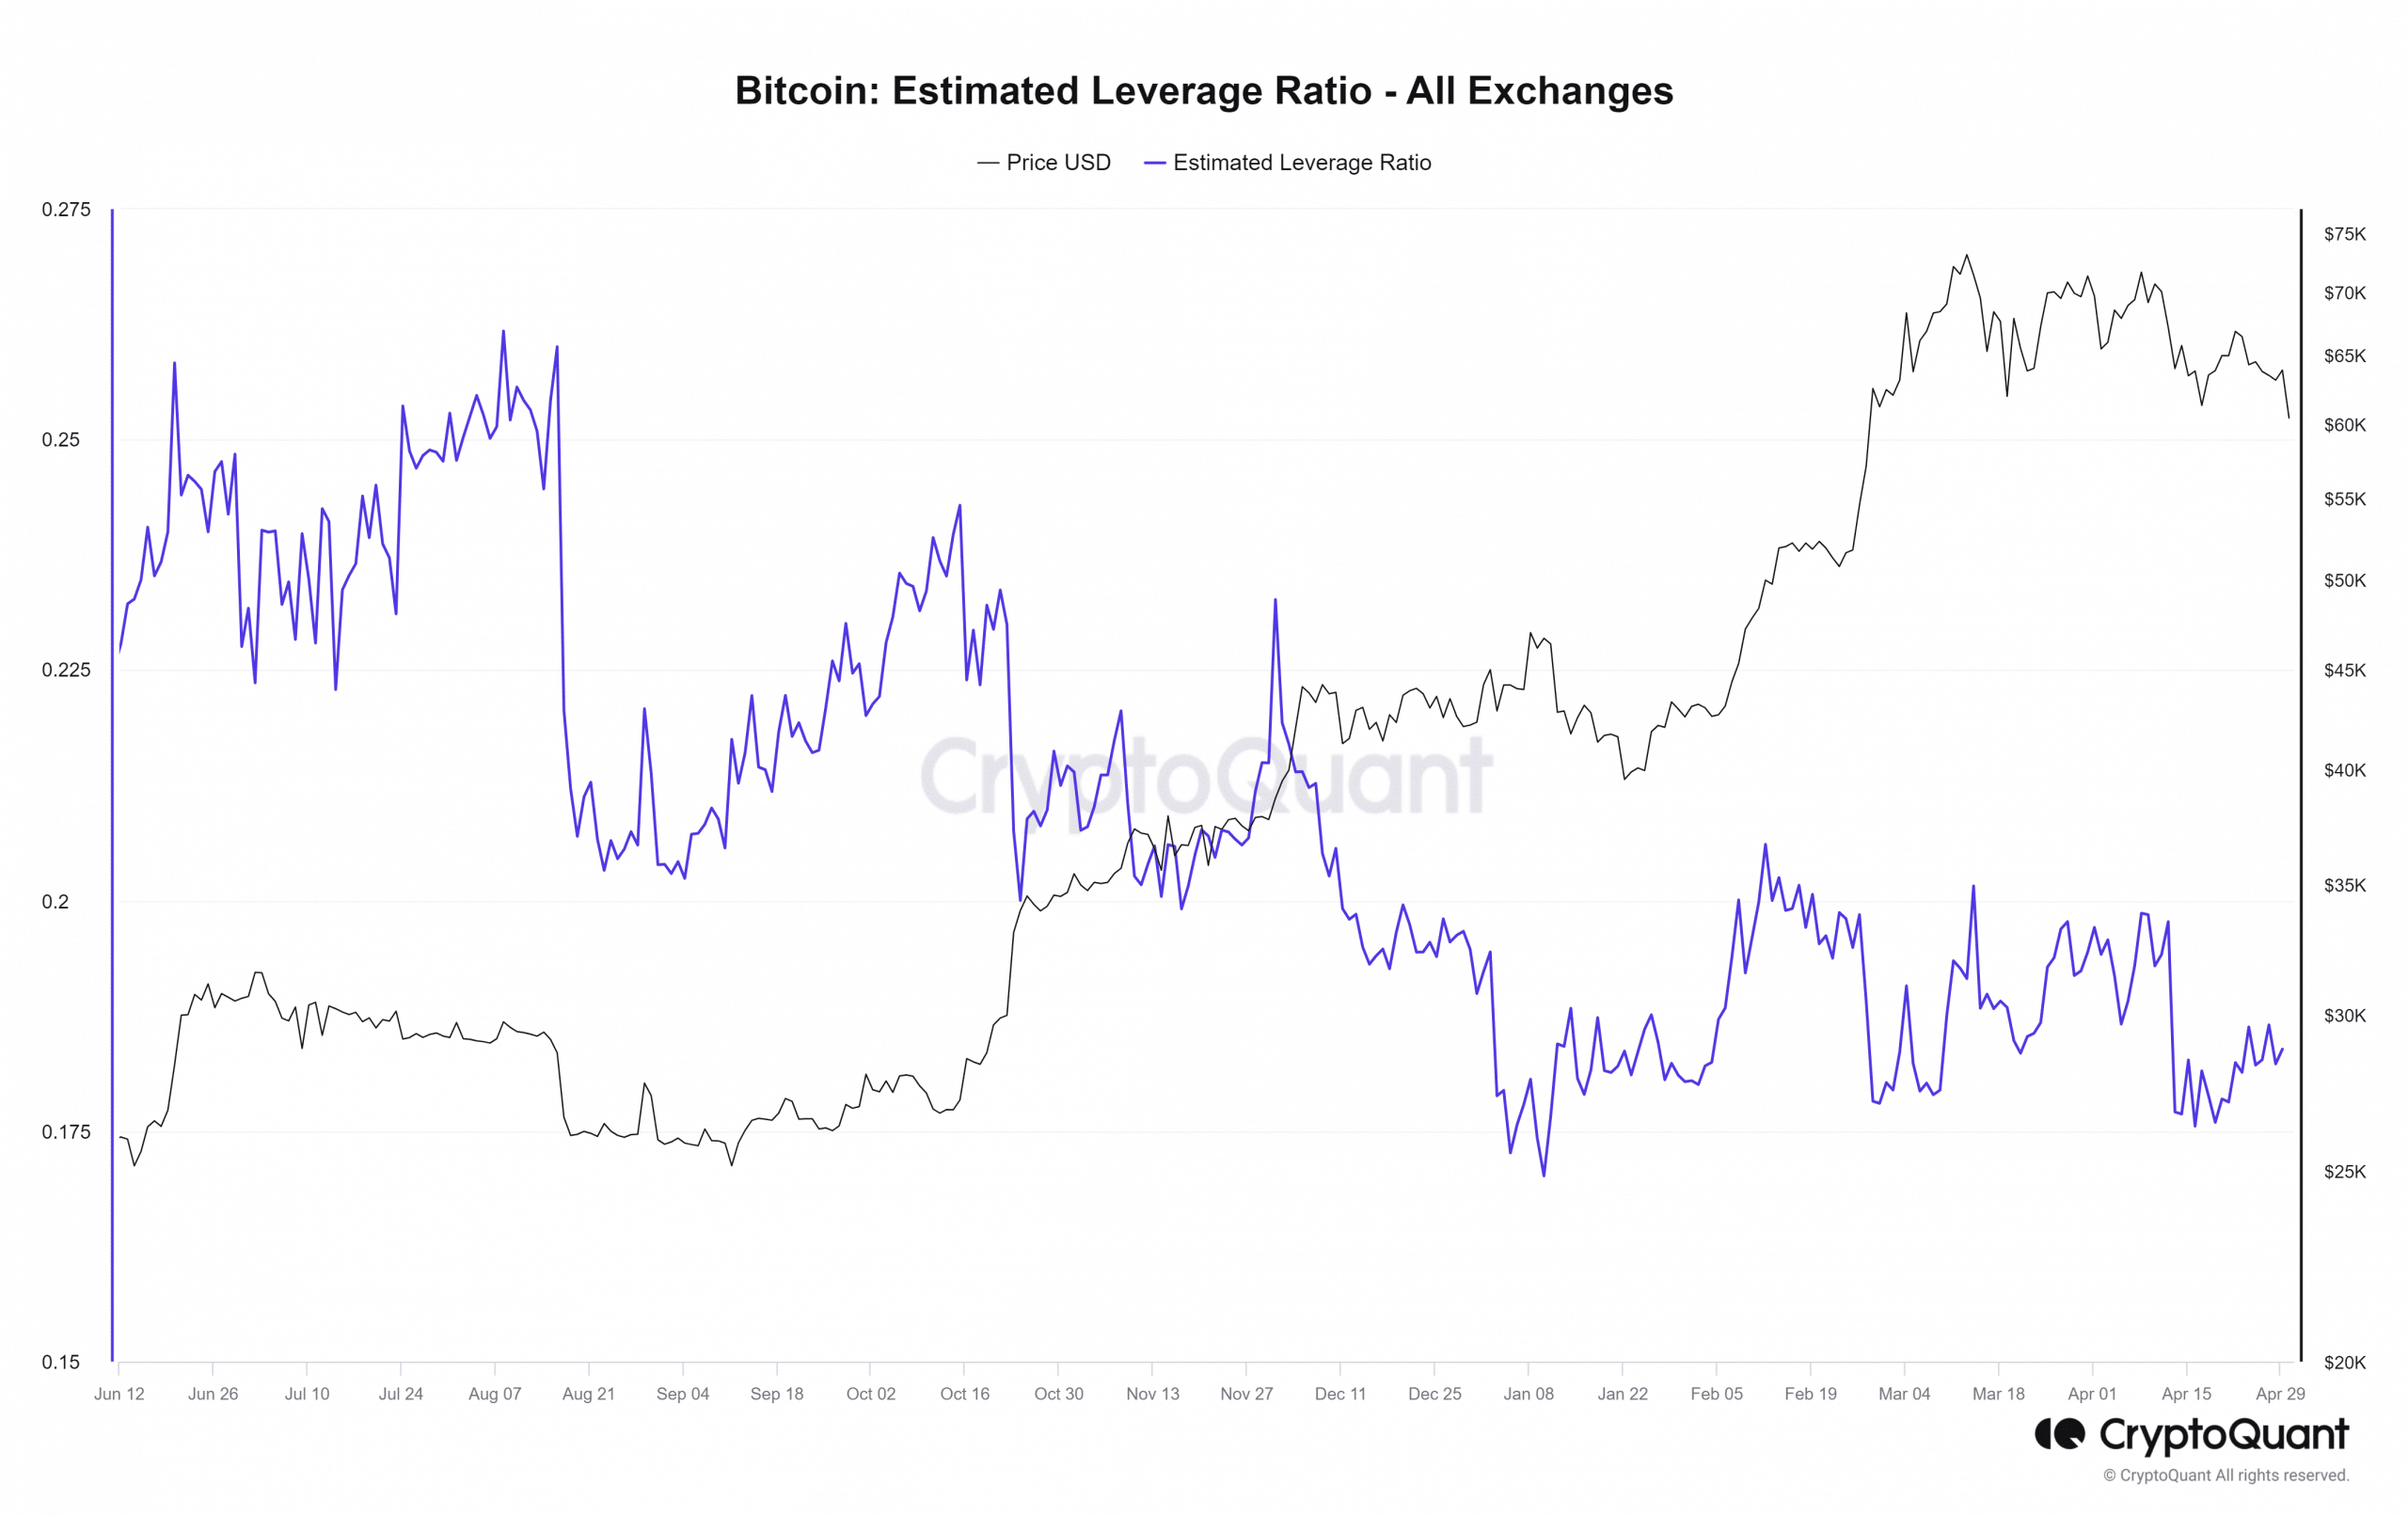
Source: CryptoQuant
Is your portfolio green? Check out the BTC Profit Calculator
The estimated leverage ratio jumped past 0.18 multiple times in 2024 but was forced to fall back. This showed that overleveraged positions have mostly been wiped out by the latest drop.
However, it does not mean BTC will see a positive price reaction. A move below the $59.4k mark will likely see prices fall to the $55k and $52k support zones.


