
Can XRP prices target $3.60 next after bullish retest? Assessing…

- The rising leverage ratio and Open Interest might be holding Bitcoin back.
- The pitchfork and 200 DMA support failure pointed to a price drop below $60k.
Update – Within hours of publication, Bitcoin [BTC] fell to $49k in the early hours of the Asian trading session. However, it recovered slightly to trade above $50k at press time.
CoinMarketCap showed the Crypto Fear and Greed index was at 48. Bearish sentiment gripped the market and traders might be tempted to trade on margin to make back losses, which can backfire spectacularly.
Is the Bitcoin bottom near?
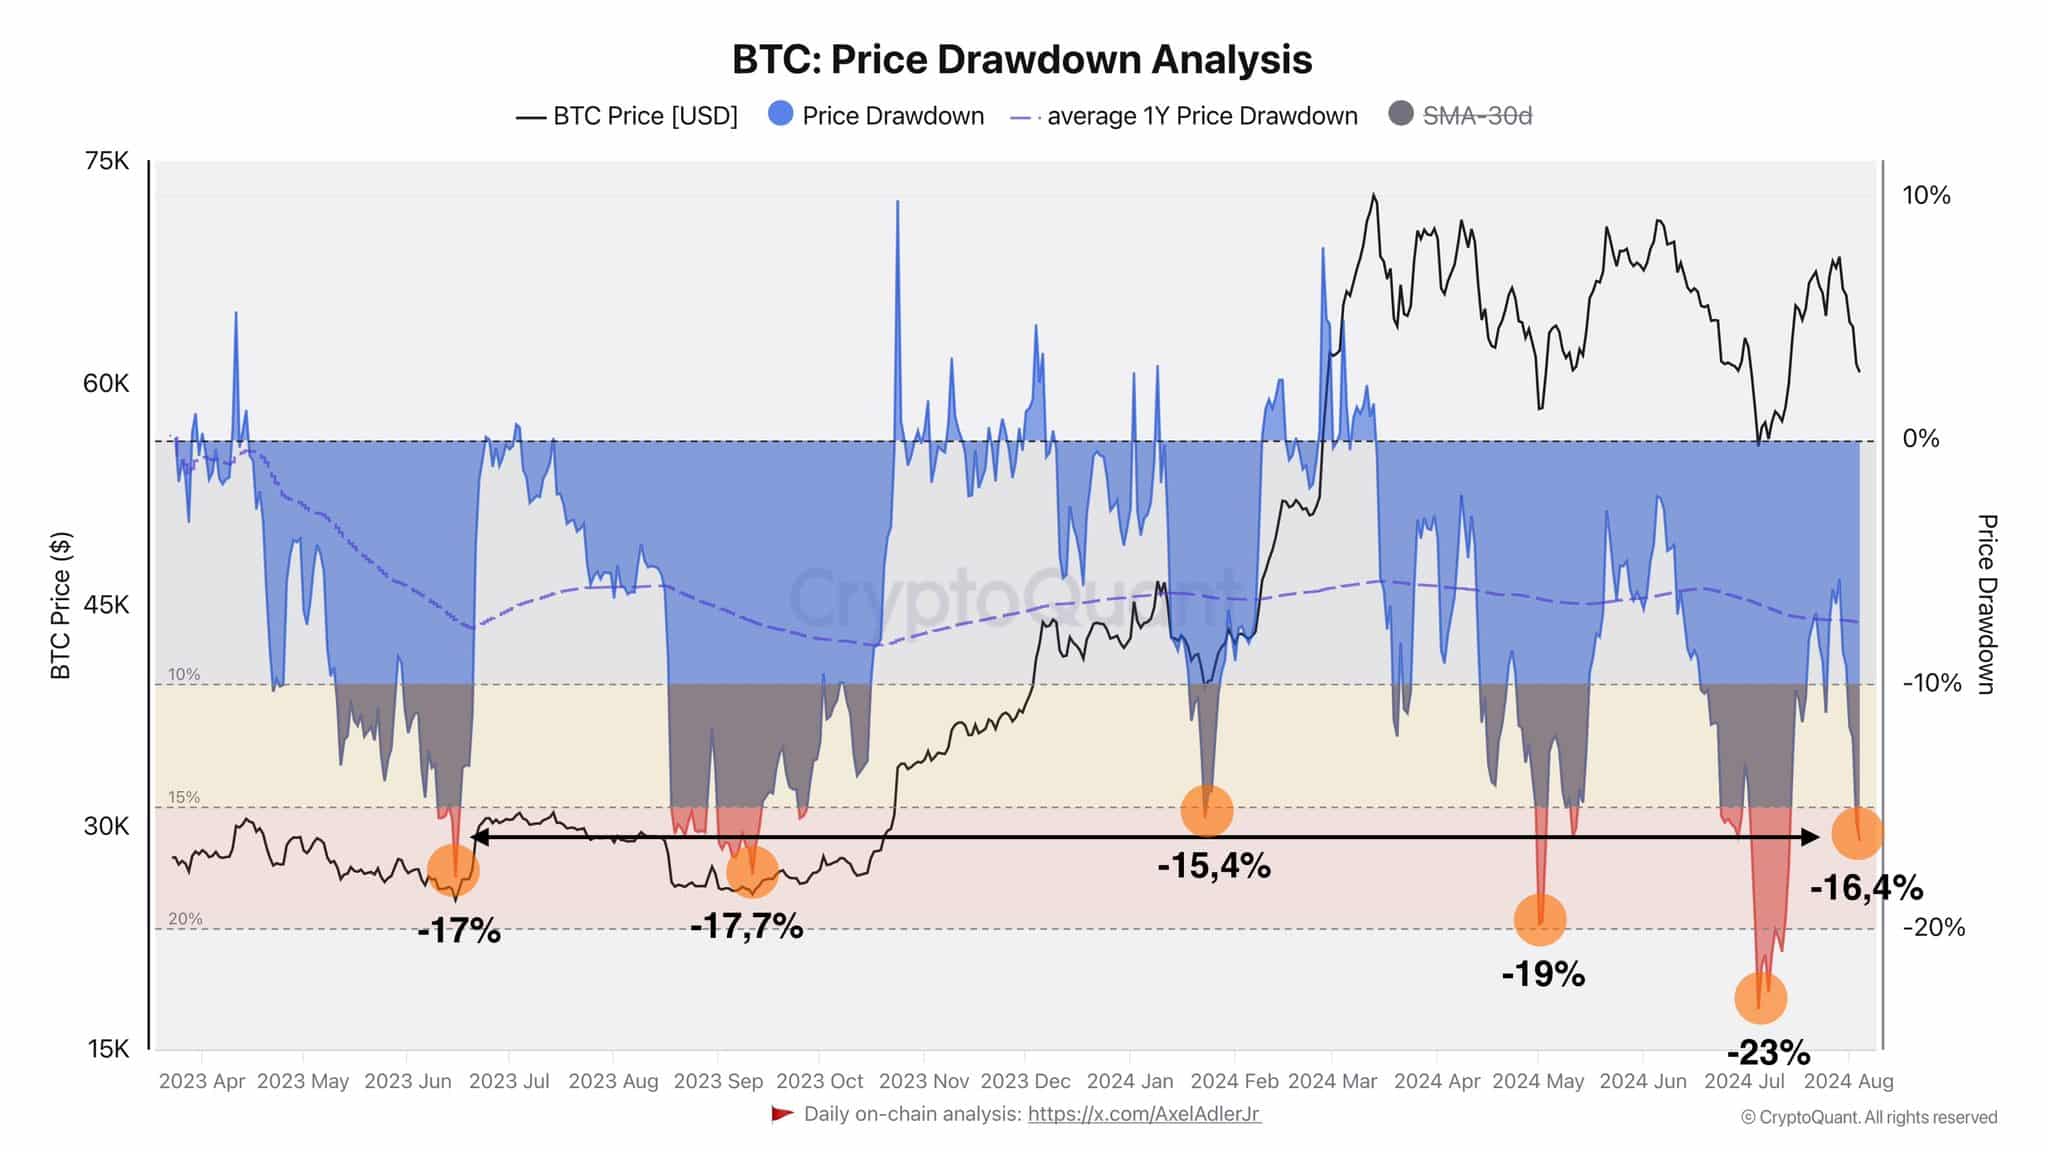
Source: Axel Adler on X
Crypto analyst Axel Adler pointed out that the price crashes since 2023 May have had drawdowns from 17% to 23%. The current figure was at 16.4%. Compared to the past twelve months, the bottom appeared to be close.
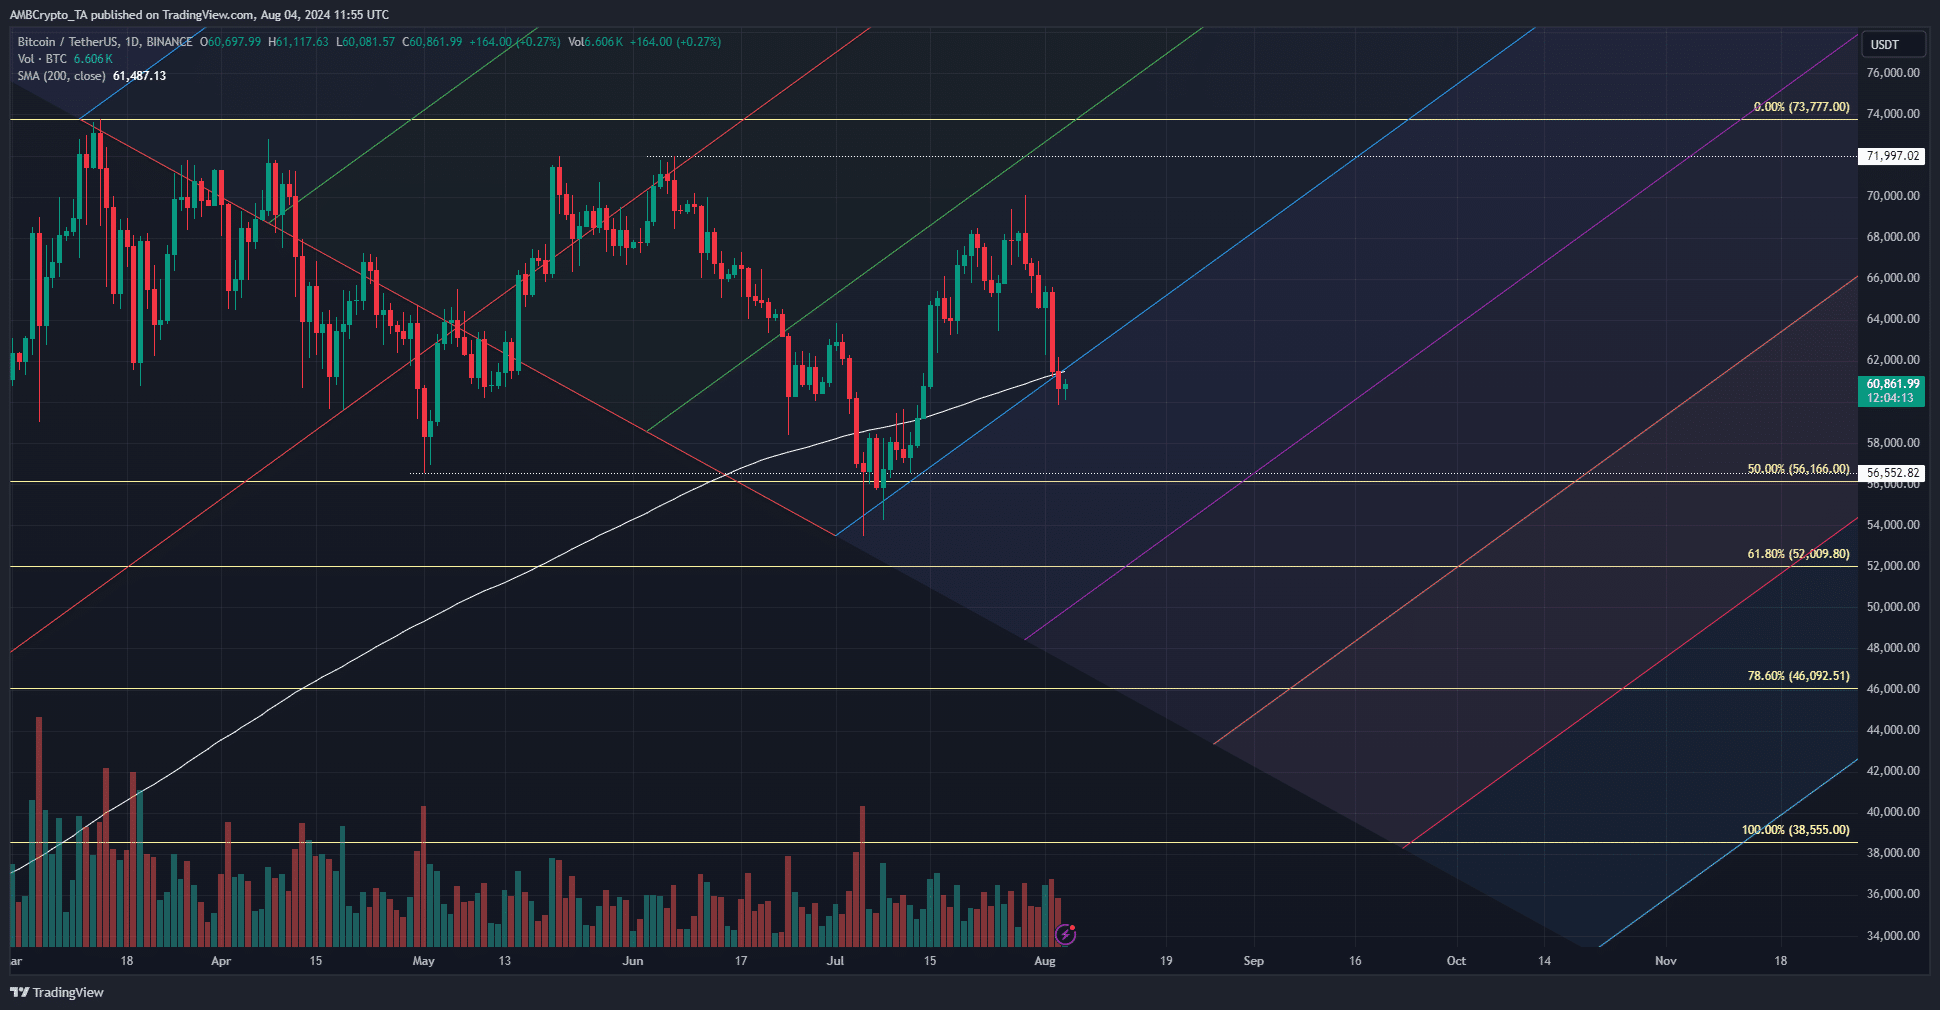
Source: BTC/USDT on TradingView
The Fibonacci retracement level was at the $56k level, which has already been tested as support in early July. The fact that the bulls were unable to defend the 200-day simple moving average was a strongly bearish sign.
Additionally, the pitchfork plotted in the above chart showed that the $61.3k level was a confluence of 200DMA and the pitchfork support, making its failure more significant.
Was the derivatives market too heated up?
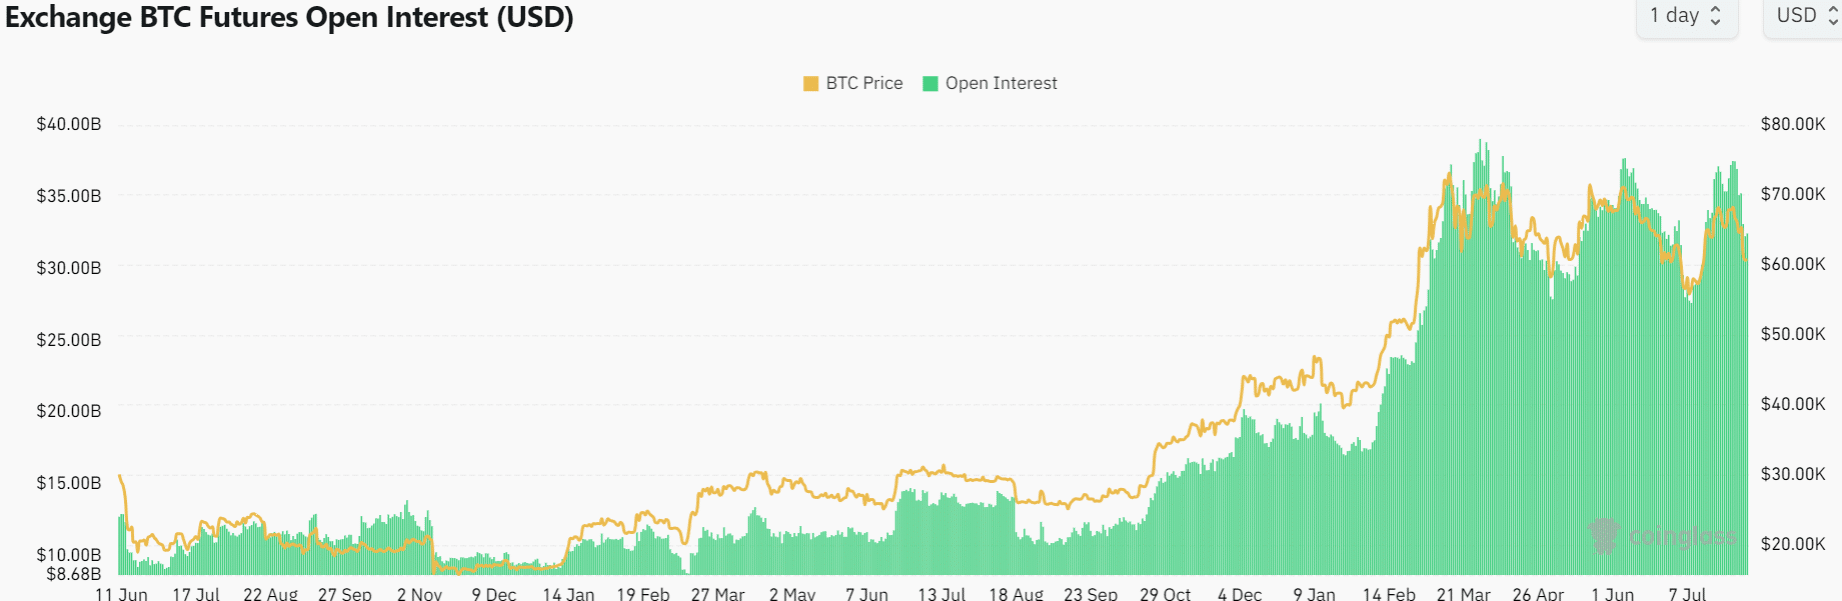
Source: Coinglass
Since March, the $70k level, which is also close to the all-time high, has not been convincingly beaten. During this period, the Open Interest has hovered in the $30 billion to $35 billion territory.
Over the past week, it has fallen by $4 billion to reflect bearish short-term sentiment.
A proper bull run requires high spot demand, and when the futures market gets too heated up, the overeager bulls and bears generally experience pain through price volatility, which can reset the upward trajectory.
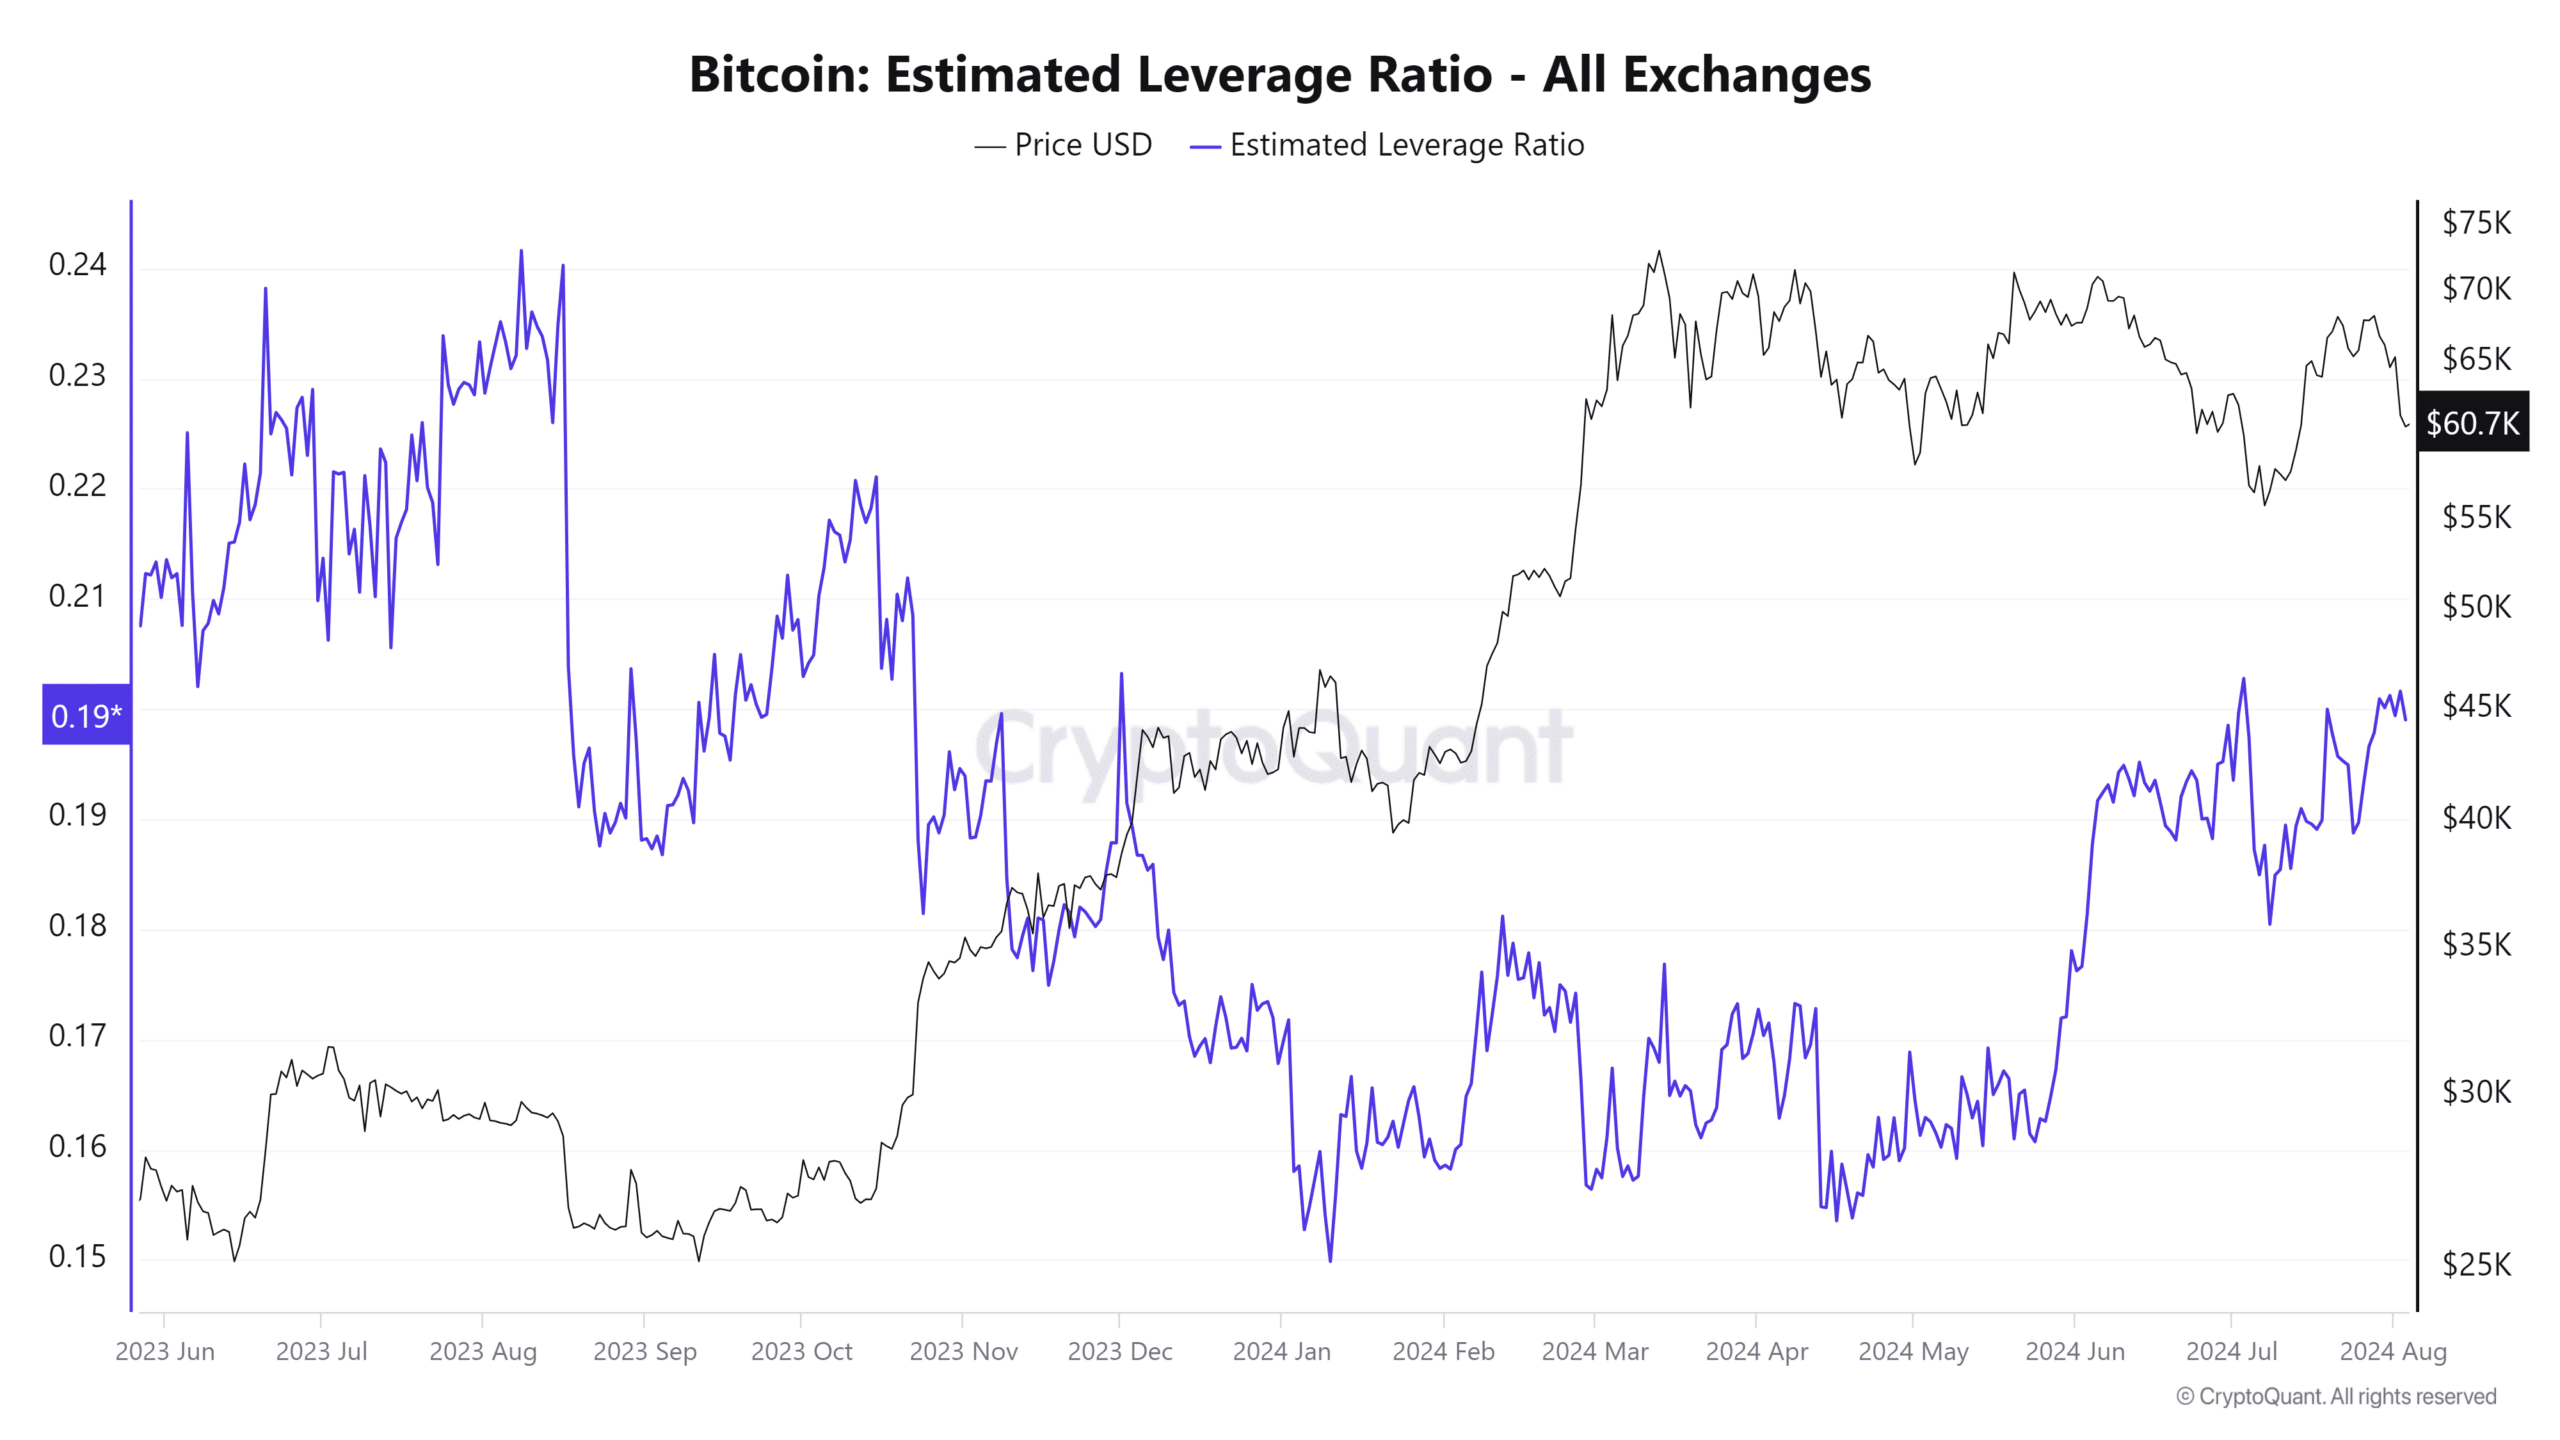
Source: CryptoQuant
The estimated leverage ratio has been rising since June. An increase in this metric indicates investors are taking increased risks with leverage trading. This could be due to hopes of a bullish breakout.
Read Bitcoin’s [BTC] Price Prediction 2024-25
This can hurt the chances of a breakout since the price is attracted to the long liquidations levels to the south.
An earlier report noted that the long-term holder selling pressure has fallen in recent weeks. This meant that the $60k might be the local bottom, but a deeper retracement due to the macro events and market-wide panic can not be ruled out.


